Price: Paid Templates

The best free & paid Looker Studio templates, curated and quality-ranked for data reporting.

Clear All

Showing 1 - 5 of 5

GA4 Full Funnel 44 E-Commerce Metrics cover image
GA4 Full Funnel 44 E-Commerce Metrics

GA4 e-commerce funnel map with 44 metrics and guided insights to find drop‑offs and boost conversions.

GA4 e-commerce funnel template that maps 44 metrics from traffic to revenue using a metrics-tree approach. Includes two metrics maps (full 44 and a 10‑metric focus) and 47 pages designed to pinpoint drop‑offs and the levers that move sales. Each metric comes with trends, breakdowns by audience, device, geography, and channel, connected metrics, plain‑language explanations, and 260+ brainstorming ideas. Ideal for diagnosing changes in add‑to‑cart, checkout, purchases, and revenue, then prioritizing tactics to lift CVR and AOV. Requires GA4 with e‑commerce events enabled.
$0|$199|$299
4-Step CRO Funnel cover image
4-Step CRO Funnel

GA4-powered Looker Studio template that analyzes a 4‑step e‑commerce funnel with built‑in CRO insights to find and fix conversion drop‑offs.

Looker Studio template for e‑commerce CRO that maps the full GA4 funnel and pinpoints drop‑offs across four key steps: Landing → Product View, Product View → Add to Cart, Add to Cart → Begin Checkout, and Begin Checkout → Purchase. A guided metric map with 17 e‑commerce KPIs and trend/target comparisons highlights weak points and potential data issues. Built‑in insights and test hypotheses from Enavi explain why conversion rates fall and how to fix them. Segment by device, source/medium, landing page type, new vs. returning, browser, screen resolution, and more to uncover high‑impact opportunities. Ideal for CRO specialists, e‑commerce teams, and agencies that want faster diagnosis and prioritization of experiments.
$0|$99|$169
50 Google Ads Performance Metrics Dashboard cover image
50 Google Ads Performance Metrics Dashboard

Google Ads Metrics Map template with 50 connected metrics and 26 pages to analyze performance and act on insights.

Google Ads performance template for Looker Studio built on the Metrics Map method to reveal how 50 metrics connect and drive results. It covers conversions, cost, CTR, ROAS, impression share, video engagement and more across 26 focused pages with current values, trends, slice charts, and a connected metrics map. Each page adds plain‑English explanations, why it matters, and actionable hypotheses to help prioritize optimizations. Connects directly to Google Ads, with options including a lifetime white‑label version.
$0|$199|$299
E-commerce Metrics Overlap Dashboard cover image
E-commerce Metrics Overlap Dashboard

Compare pairs of GA4 e‑commerce metrics to diagnose funnel issues and pinpoint growth, friction, and decline.

Pairs up key GA4 e‑commerce metrics to reveal how signals change across the conversion funnel and where drop‑offs happen. Nine curated metric pairs (e.g., product views vs add‑to‑cart, purchase rate vs revenue, sessions vs revenue) are visualized as overlaps with clear ✅/⚠️/❌ indicators. 30‑day trend comparisons and short, plain‑English insights highlight real growth, hidden friction, and performance declines. Built for e‑commerce teams, agencies, and consultants who need to explain the “why” behind results and prioritize fixes. Works with Google Analytics 4 data and offers a white‑label option for client delivery.
$0|$10|$79
Google Ads Pulse Dashboard cover image
Google Ads Pulse Dashboard

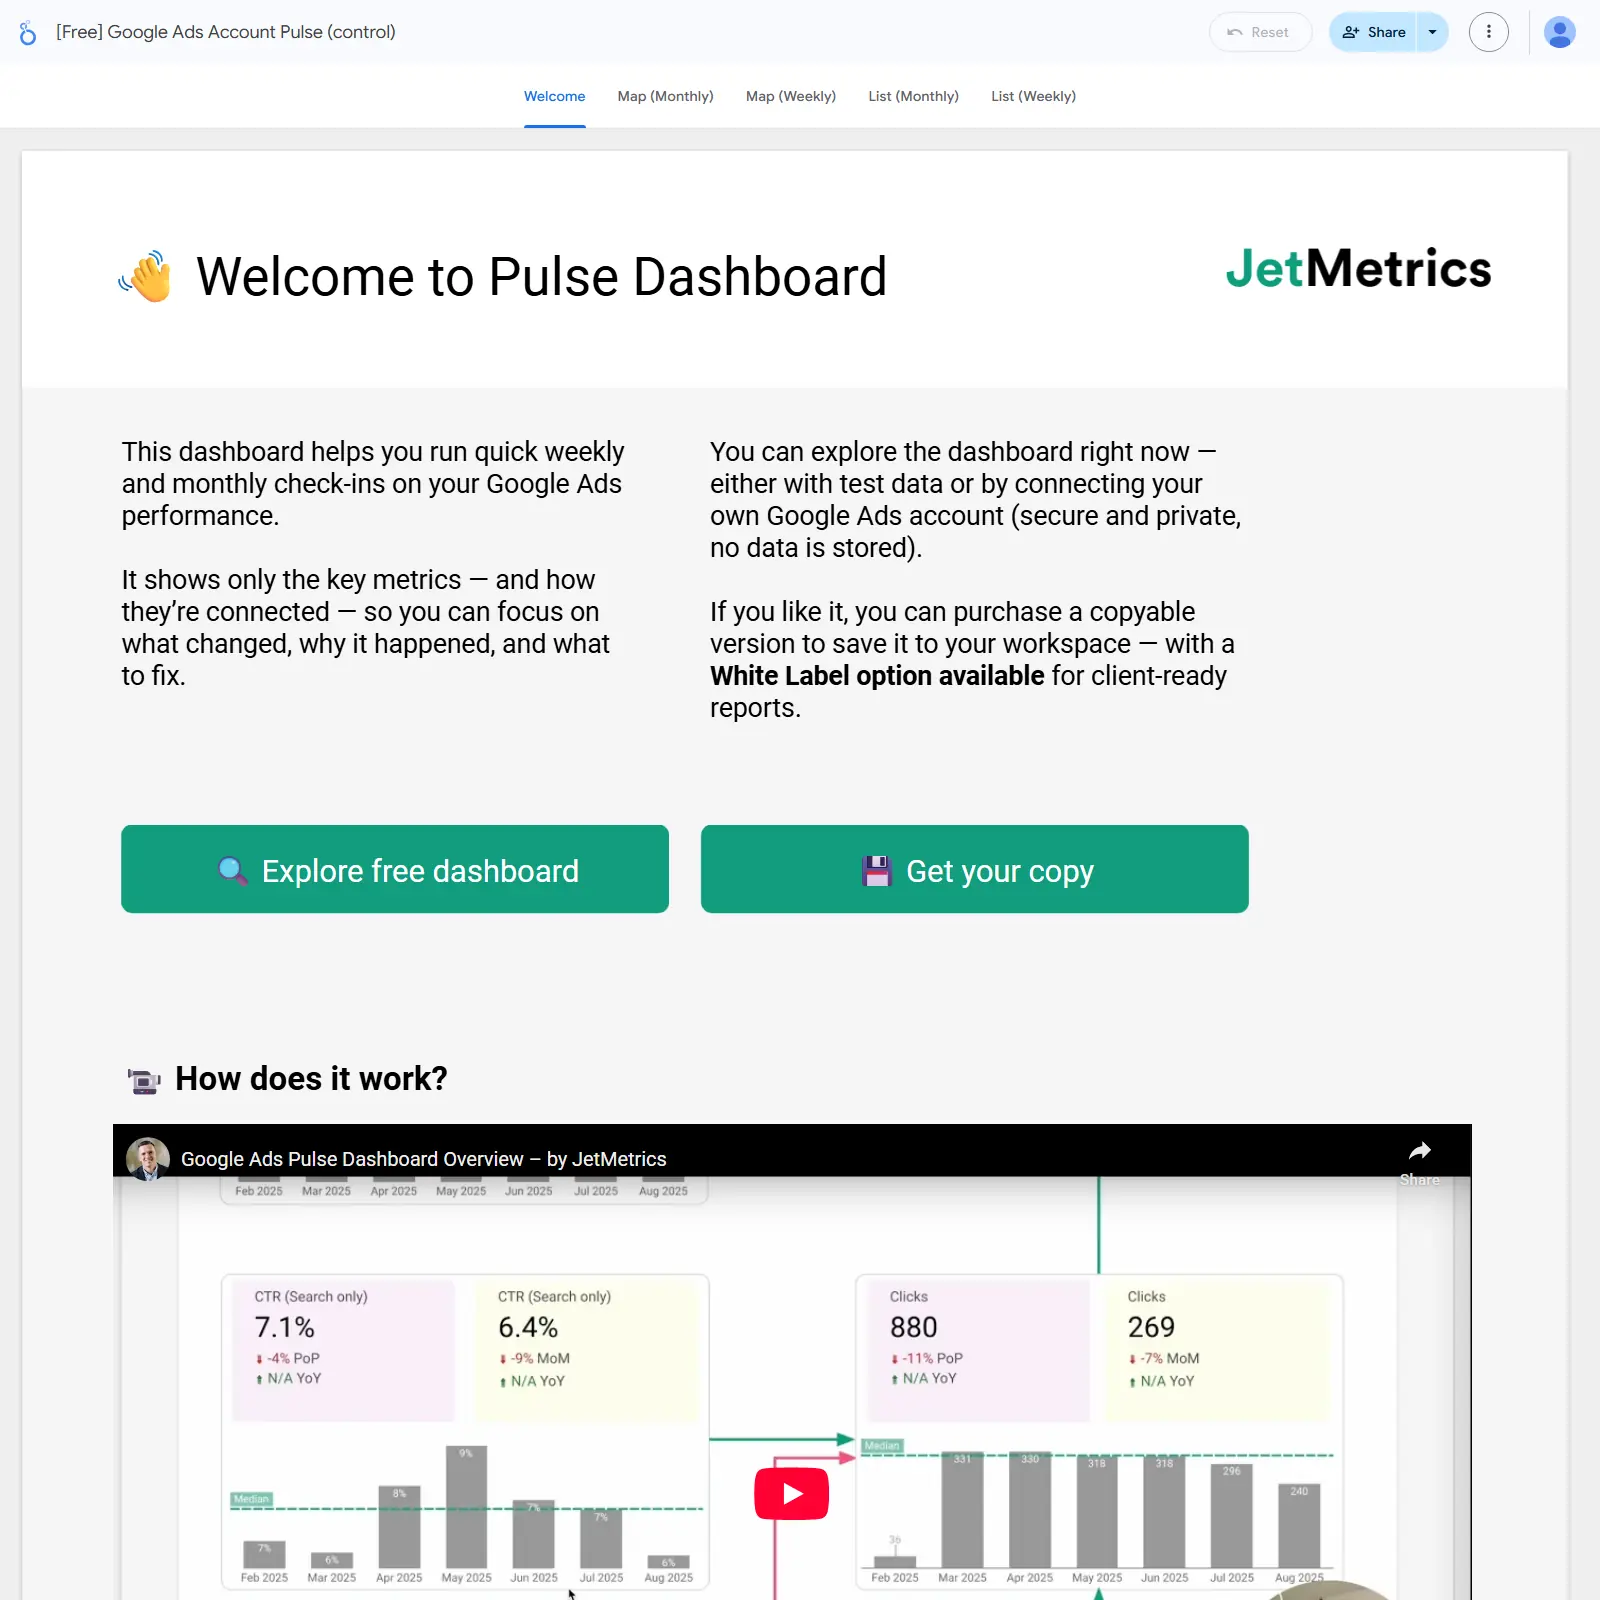
Focused Google Ads pulse check that links key metrics and trends to explain what changed and why, with weekly and monthly views.

Concise Google Ads performance pulse for marketers. A visual metrics map links clicks, impressions, CTR, CPC, cost, conversions, CPA, and conversion rate with arrows, color cues, and trend comparisons to explain movement. Weekly (7‑day) and monthly (30‑day) modes highlight short‑term and broader shifts, with filters for device, campaign type, campaign, and conversion type. A compact list view provides a fast metric‑by‑metric scan alongside the map for context. Built to quickly spot what changed, why it changed, and where to act.
$0|$79|$99