Author: coupler

The best free & paid Looker Studio templates, curated and quality-ranked for data reporting.

Clear All

Showing 1 - 9 of 9

Sales KPI dashboard for Pipedrive cover image
Sales KPI dashboard for Pipedrive

Comprehensive sales overview for revenue, win rate, losses, and rep performance with deal-level insights.

Sales performance template focused on revenue growth, win rate, and pipeline health. Tracks closed amount, closed deals, average deal size, close rate, median sales cycle, and lost value. Highlights trends in closed vs. lost value, top closed and top lost deals, and loss reasons such as budget constraints or pricing. Compares rep results with best and worst owners by close amount to pinpoint coaching opportunities. Includes dedicated views for sales pipeline and team performance for a complete CRM snapshot.
Free
Shopify orders dashboard cover image
Shopify orders dashboard

Unified Shopify analytics in Looker Studio covering orders, inventory, marketing attribution, and customer insights.

Shopify dashboard templates by Coupler.io bring orders, inventory, marketing, and customer data into Looker Studio for clear, real-time ecommerce tracking. Monitor orders, total sales, average order value, discounts, tax, returns, customers, and processing time, with breakdowns by traffic source and shipping country. Connect Shopify with GA4 and ad platforms to link spend to conversions and ROI, uncover funnel drop‑offs, and optimize budget allocation. Use SKU‑level insights like days of stock remaining to prevent stockouts and plan procurement with confidence. Ideal for store owners and marketers who need a consolidated view of performance and growth levers.
Free
Shopify marketing funnel dashboard cover image
Shopify marketing funnel dashboard

Cross‑channel marketing funnel template that tracks acquisition from impressions to revenue to surface bottlenecks and scale top‑performing channels.

Cross‑channel marketing funnel template that unifies ads, web analytics, ecommerce, and email data to map the path from first impression to purchase. It tracks spend, clicks, CTR, CPC/CPM, new users/customers, orders, total sales, ROI/ROAS, cost per order, and average order value with clear funnel stages. Weekly breakdowns and trend charts reveal drop‑offs between stages and highlight the campaigns and emails driving qualified leads and revenue. Ideal for optimizing budgets, improving product and checkout flow, and proving impact across Facebook Ads, Google Ads, GA4, Klaviyo/Mailchimp, and Shopify.
Free
Shopify store traffic overview dashboard cover image
Shopify store traffic overview dashboard

Shopify + GA4 funnel tracker covering traffic, conversions, customers, orders, and revenue trends.

Ecommerce performance template for Shopify that connects store sales with GA4 traffic to map the full funnel from sessions and views to add‑to‑carts, checkouts, and purchases. Highlights key KPIs like orders, total sales, average order value, and average items per order alongside total and new users. A monthly funnel table and trend charts reveal sales growth, customer acquisition, and conversion bottlenecks. Ideal for spotting what drives revenue and where shoppers drop off.
Free
Salesforce sales team performance dashboard cover image
Salesforce sales team performance dashboard

Salesforce sales performance template tracking win/loss, revenue, rep comparisons, and task efficiency.

Looker Studio template for analyzing Salesforce pipeline outcomes and team productivity. Visualizes won and lost opportunities, won/lost amounts, win rate, and reasons for lost deals by rep, opportunity type, size, and lead source. Highlights totals and trends to benchmark performance and spot revenue swings. Adds task analytics—open/closed tasks and median task age—to monitor throughput and remove bottlenecks. Ideal for sales leaders to prioritize coaching, refine tactics, and forecast more accurately.
Free
Shopify sales funnel dashboard cover image
Shopify sales funnel dashboard

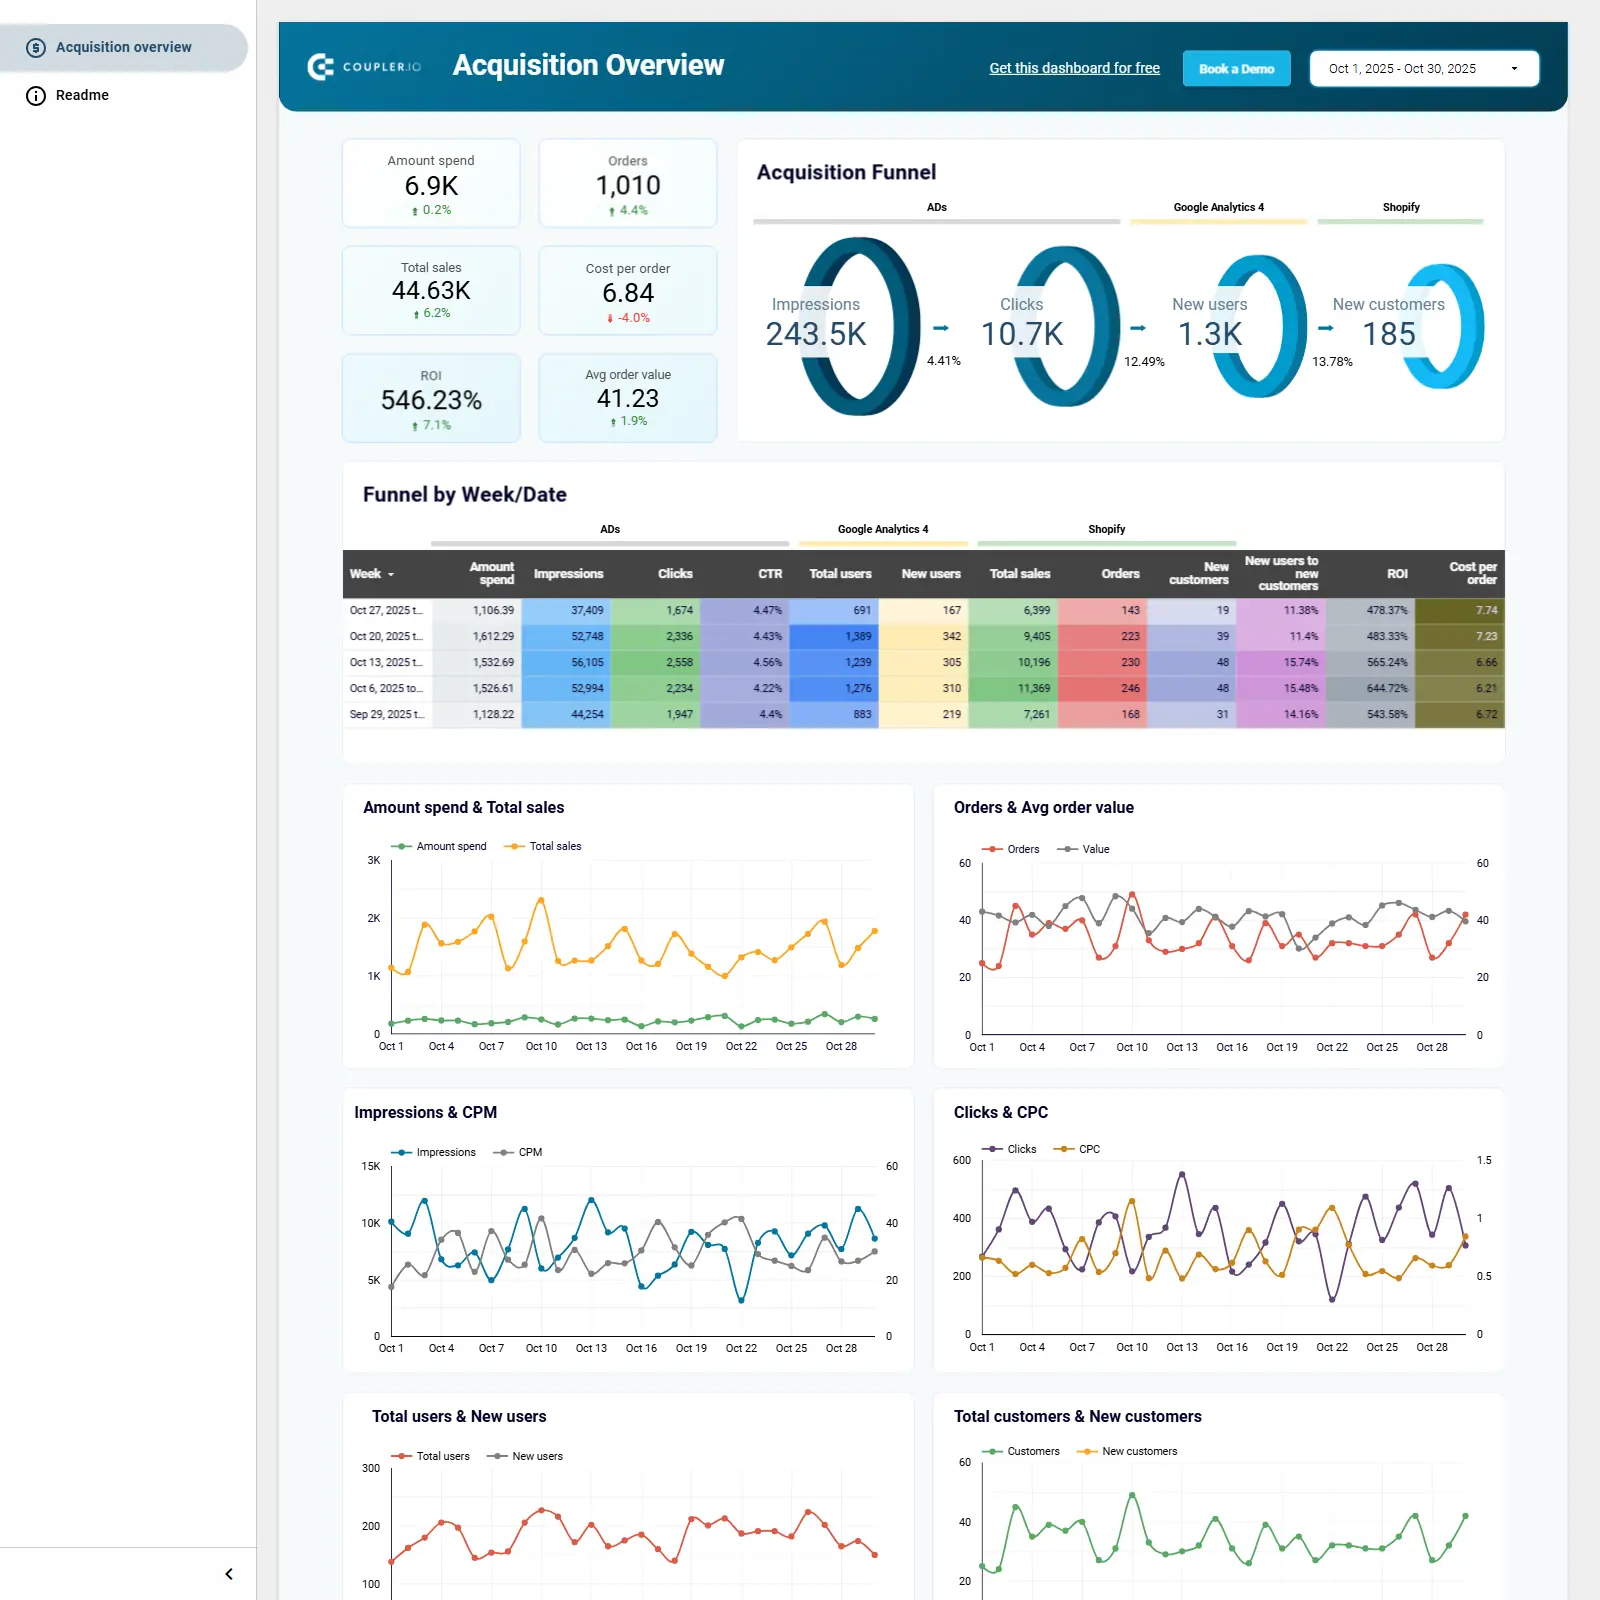
Unified sales funnel template mapping conversions from ad impression to customer across CRM and marketing channels with channel, geo, and ROI insights.

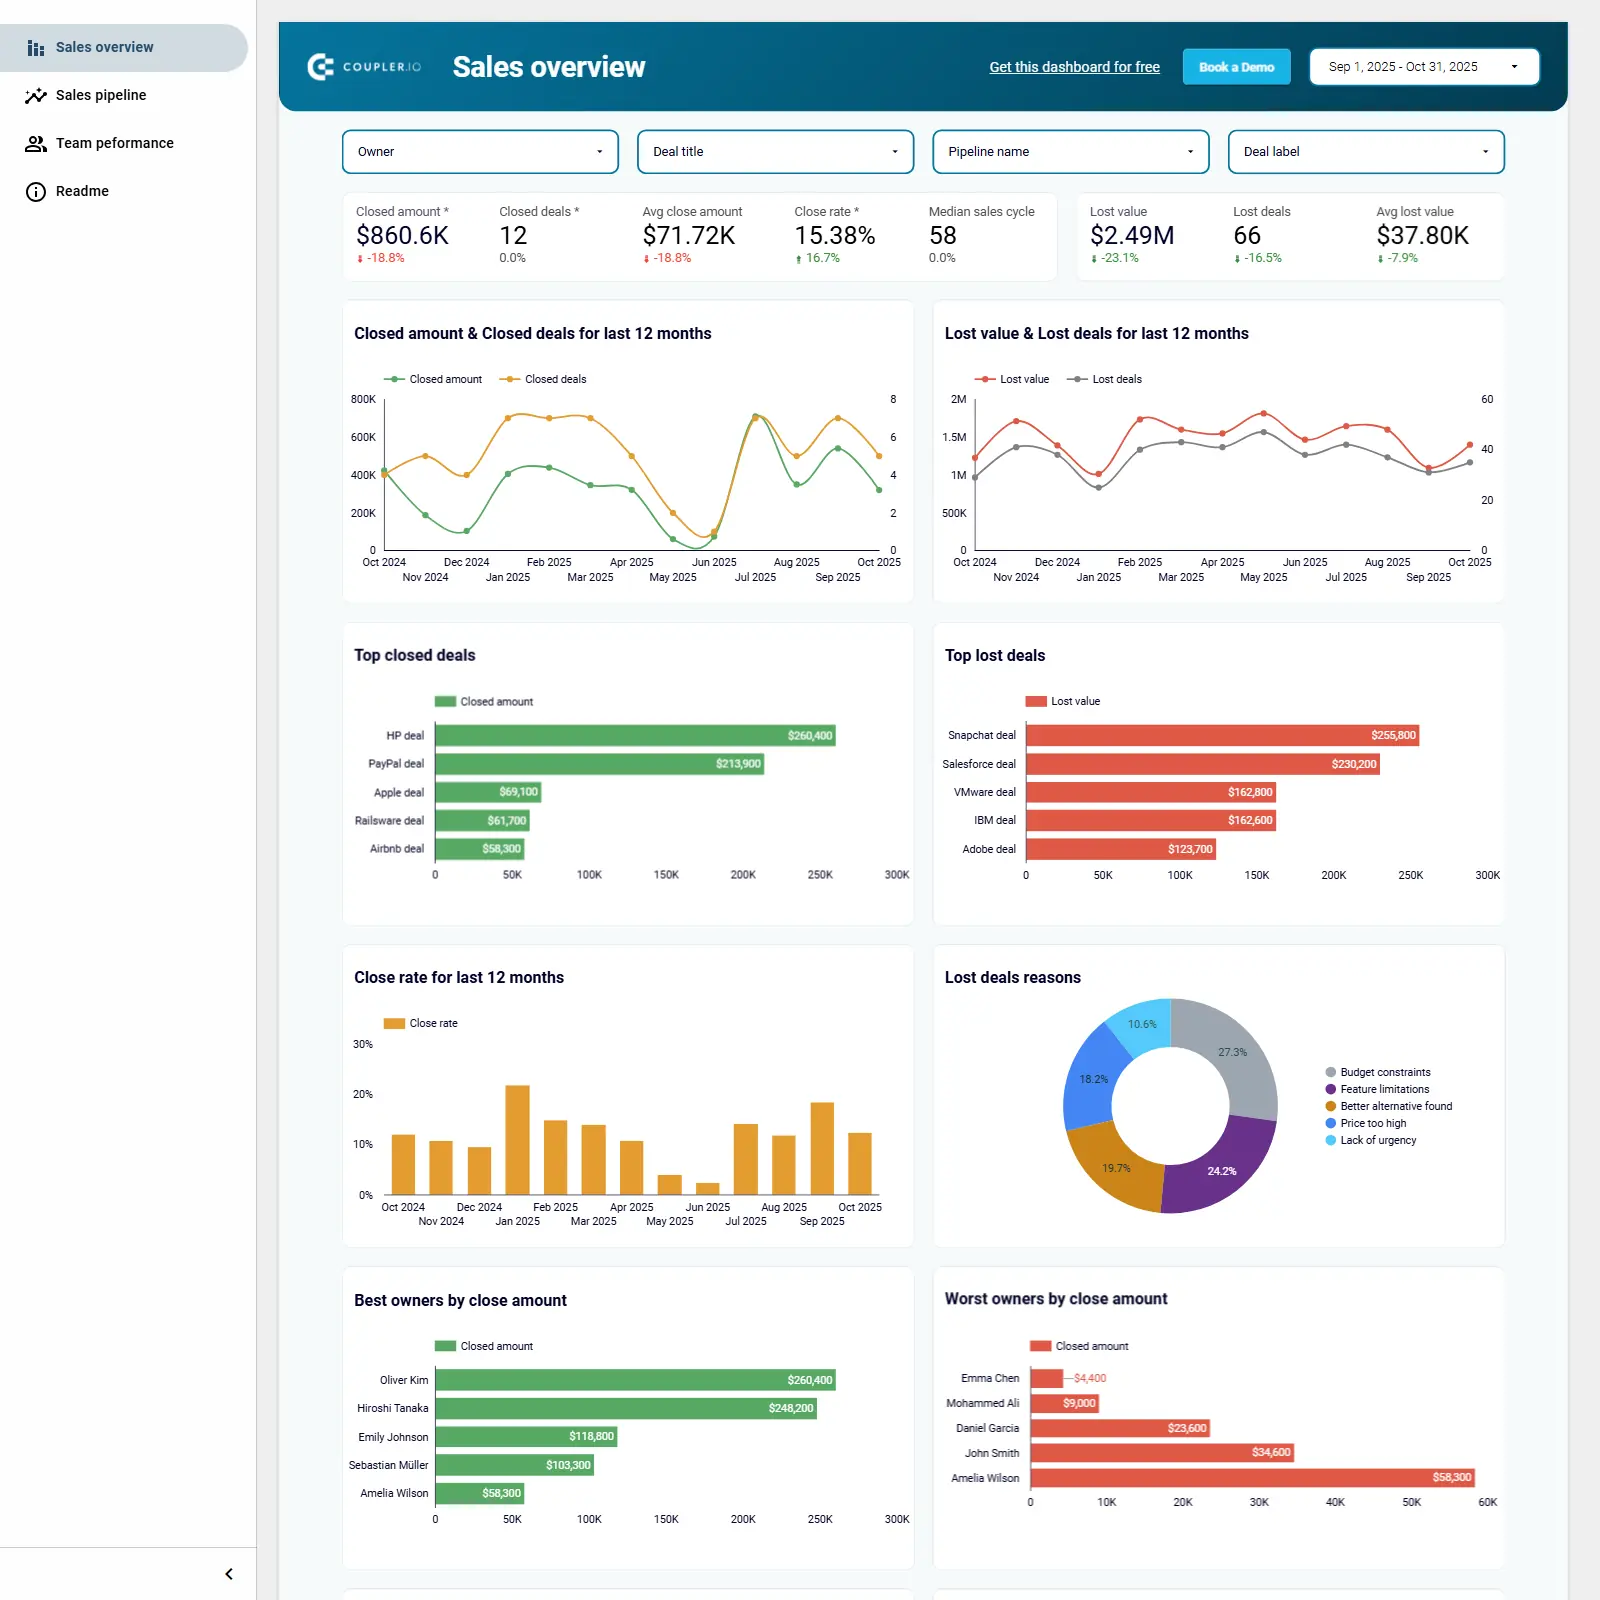
Sales funnel dashboard template that tracks the full journey from first touch to closed customer by unifying CRM and marketing data. Integrates HubSpot or Pipedrive with Google Analytics, Google Ads, and Facebook Ads to visualize multi‑stage conversions and drop‑offs by channel, country, and item. Highlights channel attribution, geographic performance, and spend vs. conversion efficiency so you can reallocate budget and fix bottlenecks faster. Monitors impressions, clicks, website visitors, CRM leads, MQLs, SQLs, conversion rates, CPL, cost per SQL, bounce rate, and revenue impact. Ideal for marketers, sales teams, and agencies needing a clear view of acquisition performance and ROI.
Free
Salesforce sales dashboard cover image
Salesforce sales dashboard

Salesforce-to-Looker Studio template for tracking pipeline, win/loss, team performance, and revenue drivers with automated Coupler.io sync.

Salesforce sales analytics template for Looker Studio that unifies team performance, pipeline movement, and revenue trends into one view. Prebuilt pages surface Sales overview plus Open, Won, and Lost opportunities with breakdowns by owner, account, source, and deal size. Tracks the essentials: total sales, pipeline value, expected revenue, win/close/lost rates, average days to close, open deal age, and won/lost counts and amounts. Surfaces top performers, stage bottlenecks, and win/loss patterns to improve forecasting and execution. Powered by Coupler.io with automated refresh to keep Salesforce data current in Looker Studio.
Free
Facebook Ads ecommerce performance dashboard cover image
Facebook Ads ecommerce performance dashboard

Facebook Ads ecommerce analytics with ROAS, funnel performance, and campaign-level insights for profitable scaling.

Facebook Ads ecommerce dashboard focused on ROAS and revenue impact across campaigns and ad sets. Tracks the full acquisition funnel from impressions and link clicks to adds to cart, checkouts, and purchases, with key cost metrics like CPM, CPC, CPA, and cost per purchase. Visualizes spend vs. purchases value over time and highlights average purchase value for quick ROI reads. Includes trend charts for clicks and purchases plus a detailed campaign performance table to pinpoint top- and under-performing ads. Built for ecommerce teams to optimize budgets, reduce funnel drop‑offs, and grow profitable conversions.
Free
Sales KPI dashboard for HubSpot cover image
Sales KPI dashboard for HubSpot

Sales deals performance dashboard for tracking closed revenue, close rate, rep leaderboards, and loss reasons with 12‑month trends.

Sales performance template focused on closed deals and revenue impact. Track closed revenue, average deal size, lost amount, and 12‑month trends for closed and lost deals. Monitor close rate, top won and lost deals, and loss reasons to improve win rates. Compare best and worst owners by closed amount to pinpoint coaching and recognition opportunities. Filter by date and source to see which channels drive results and where deals stall.
Free