Author: coupler

The best free & paid Looker Studio templates, curated and quality-ranked for data reporting.

Clear All

Showing 1 - 8 of 8

Facebook Ads purchases breakdown dashboard cover image
Facebook Ads purchases breakdown dashboard

Facebook Ads analytics dashboards with funnel, ROAS, and creative insights to optimize spend and growth.

Facebook Ads performance dashboards that consolidate Ads Manager data to track spend, impressions, reach, clicks, CTR, CPC/CPM, purchases, and ROAS. Funnel views map the journey from impression to purchase to spot drop‑offs and true cost per purchase. Creative and audience breakdowns surface winning assets and segments, while a frequency meter helps avoid ad fatigue. Variants for ecommerce, lead‑gen, apps, and brand awareness highlight the KPIs that matter to each goal so you can reallocate budget with confidence.
Free
Ads and social media performance dashboard for Meta cover image
Ads and social media performance dashboard for Meta

Unified Facebook and Instagram ads + social analytics with KPIs, trends, geo insights, and post-level performance.

All-in-one Looker Studio template for tracking ads and social media across Facebook and Instagram. Monitor core KPIs—impressions, clicks, spend, CPM, CPC, and CTR—with clear time-series trends. Compare organic reach and paid performance, including spend and CPM/CPC changes. View country-level insights for ad impressions, page likes, and follower growth. Drill into post performance with likes, comments, and shares to find winning content and optimize budgets.
Free
Meta Ads creatives dashboard cover image
Meta Ads creatives dashboard

Creative-level Meta Ads analytics with KPIs and trends to compare, optimize, and scale ad performance.

Meta Ads creative performance tracking focused on comparing ads across campaigns and ad groups. Highlights the core KPIs marketers need—impressions, clicks, amount spent, CPC, CPM, CTR, and post engagement—to quickly identify winning and underperforming creatives. A detailed table ranks each ad by efficiency, while time‑series charts reveal trends for impressions vs. CPM, clicks vs. CPC, and spend dynamics. Helps pinpoint cost drivers, pacing issues, and optimization opportunities for higher ROI. Built for advertisers seeking clear, creative‑level insights.
Free
Facebook Ads leads breakdown dashboard cover image
Facebook Ads leads breakdown dashboard

Looker Studio template to track Facebook Ads spend, funnel, and campaign/creative performance with metrics like CPL, ROAS, CTR, and lead value.

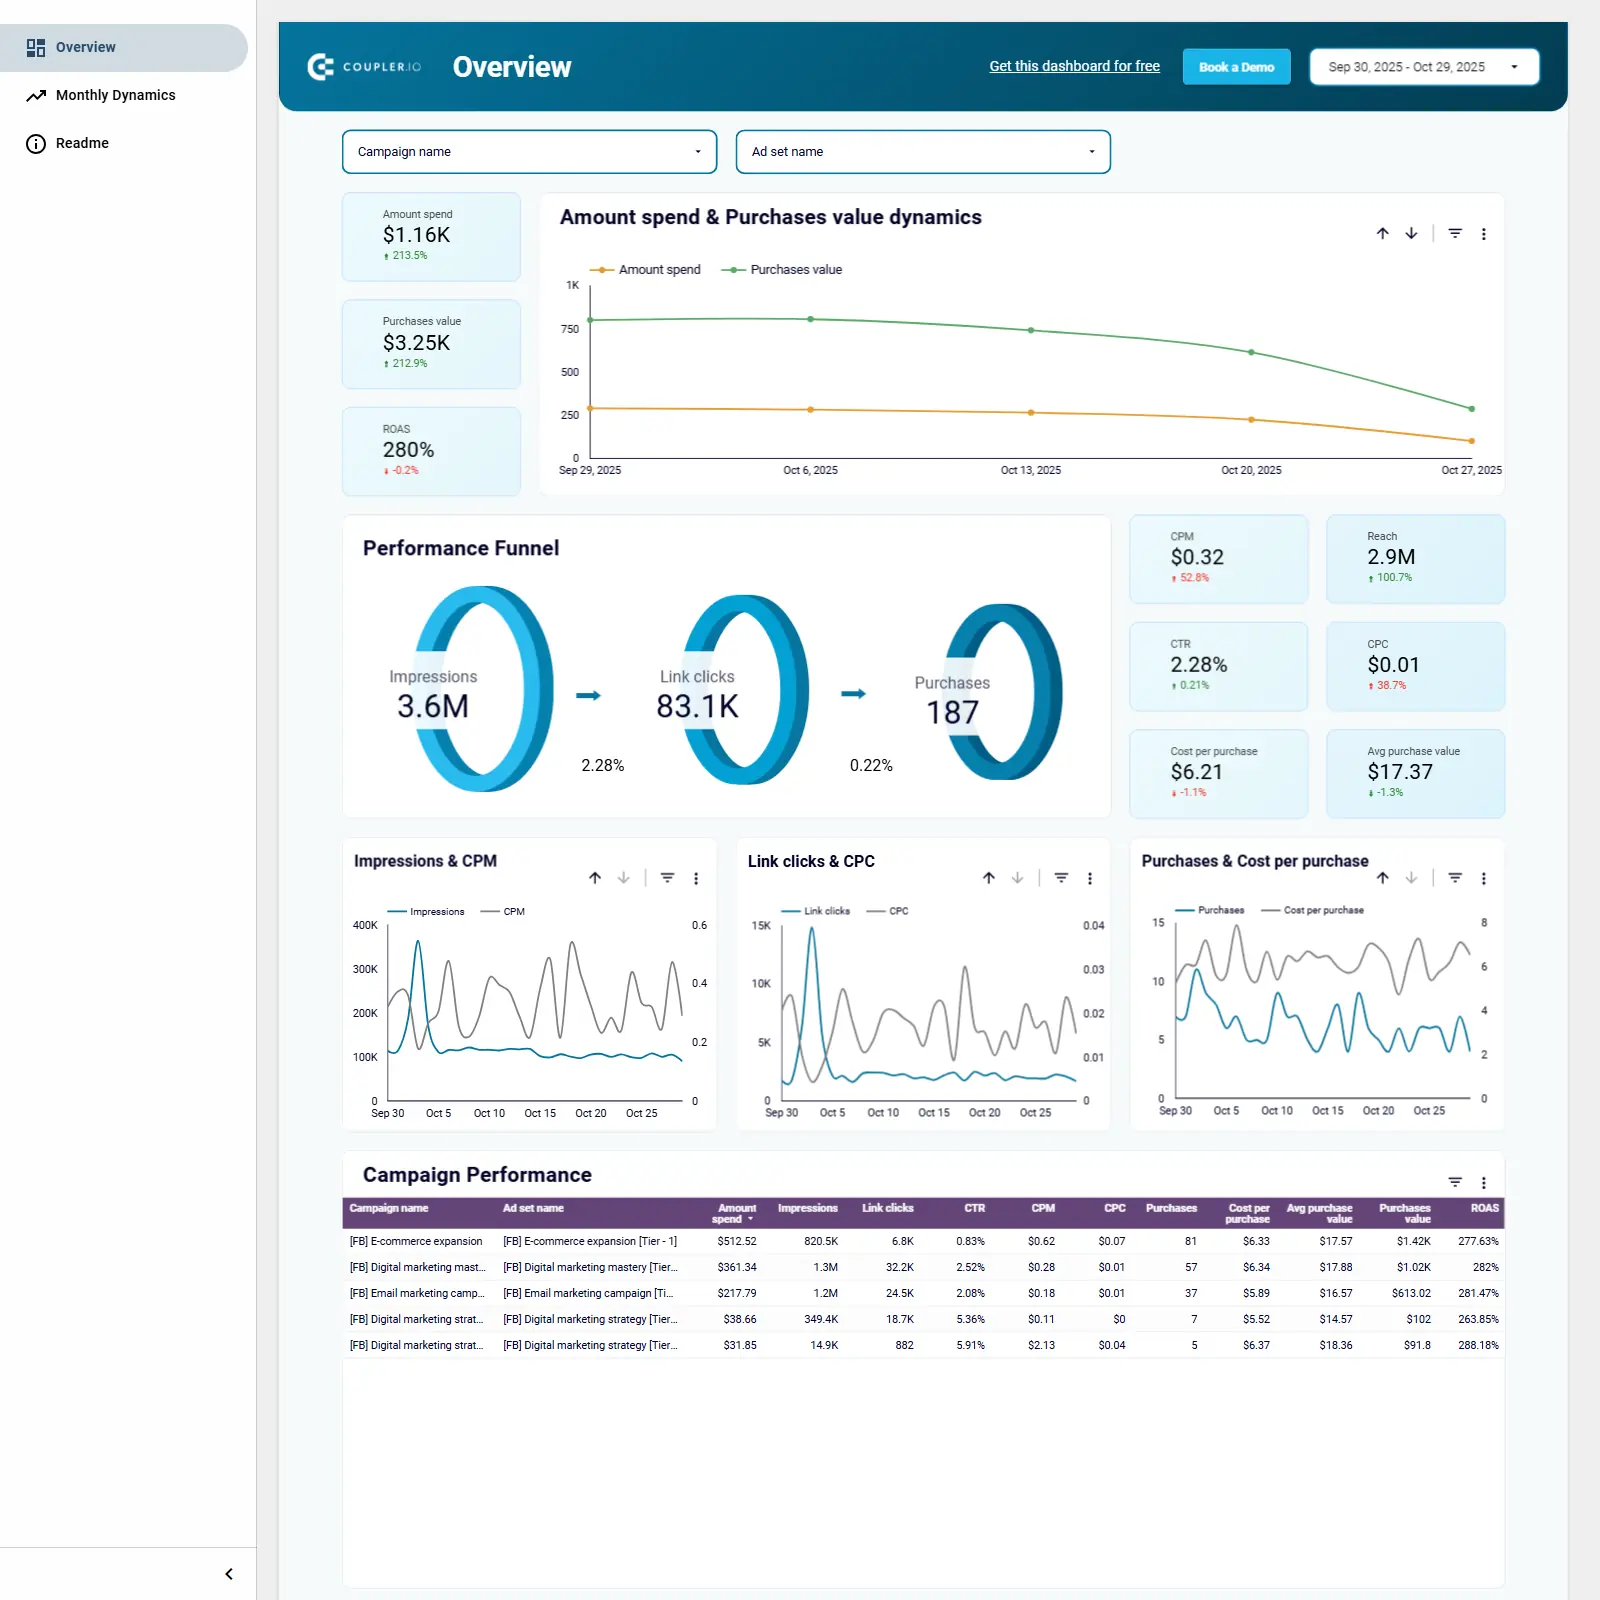
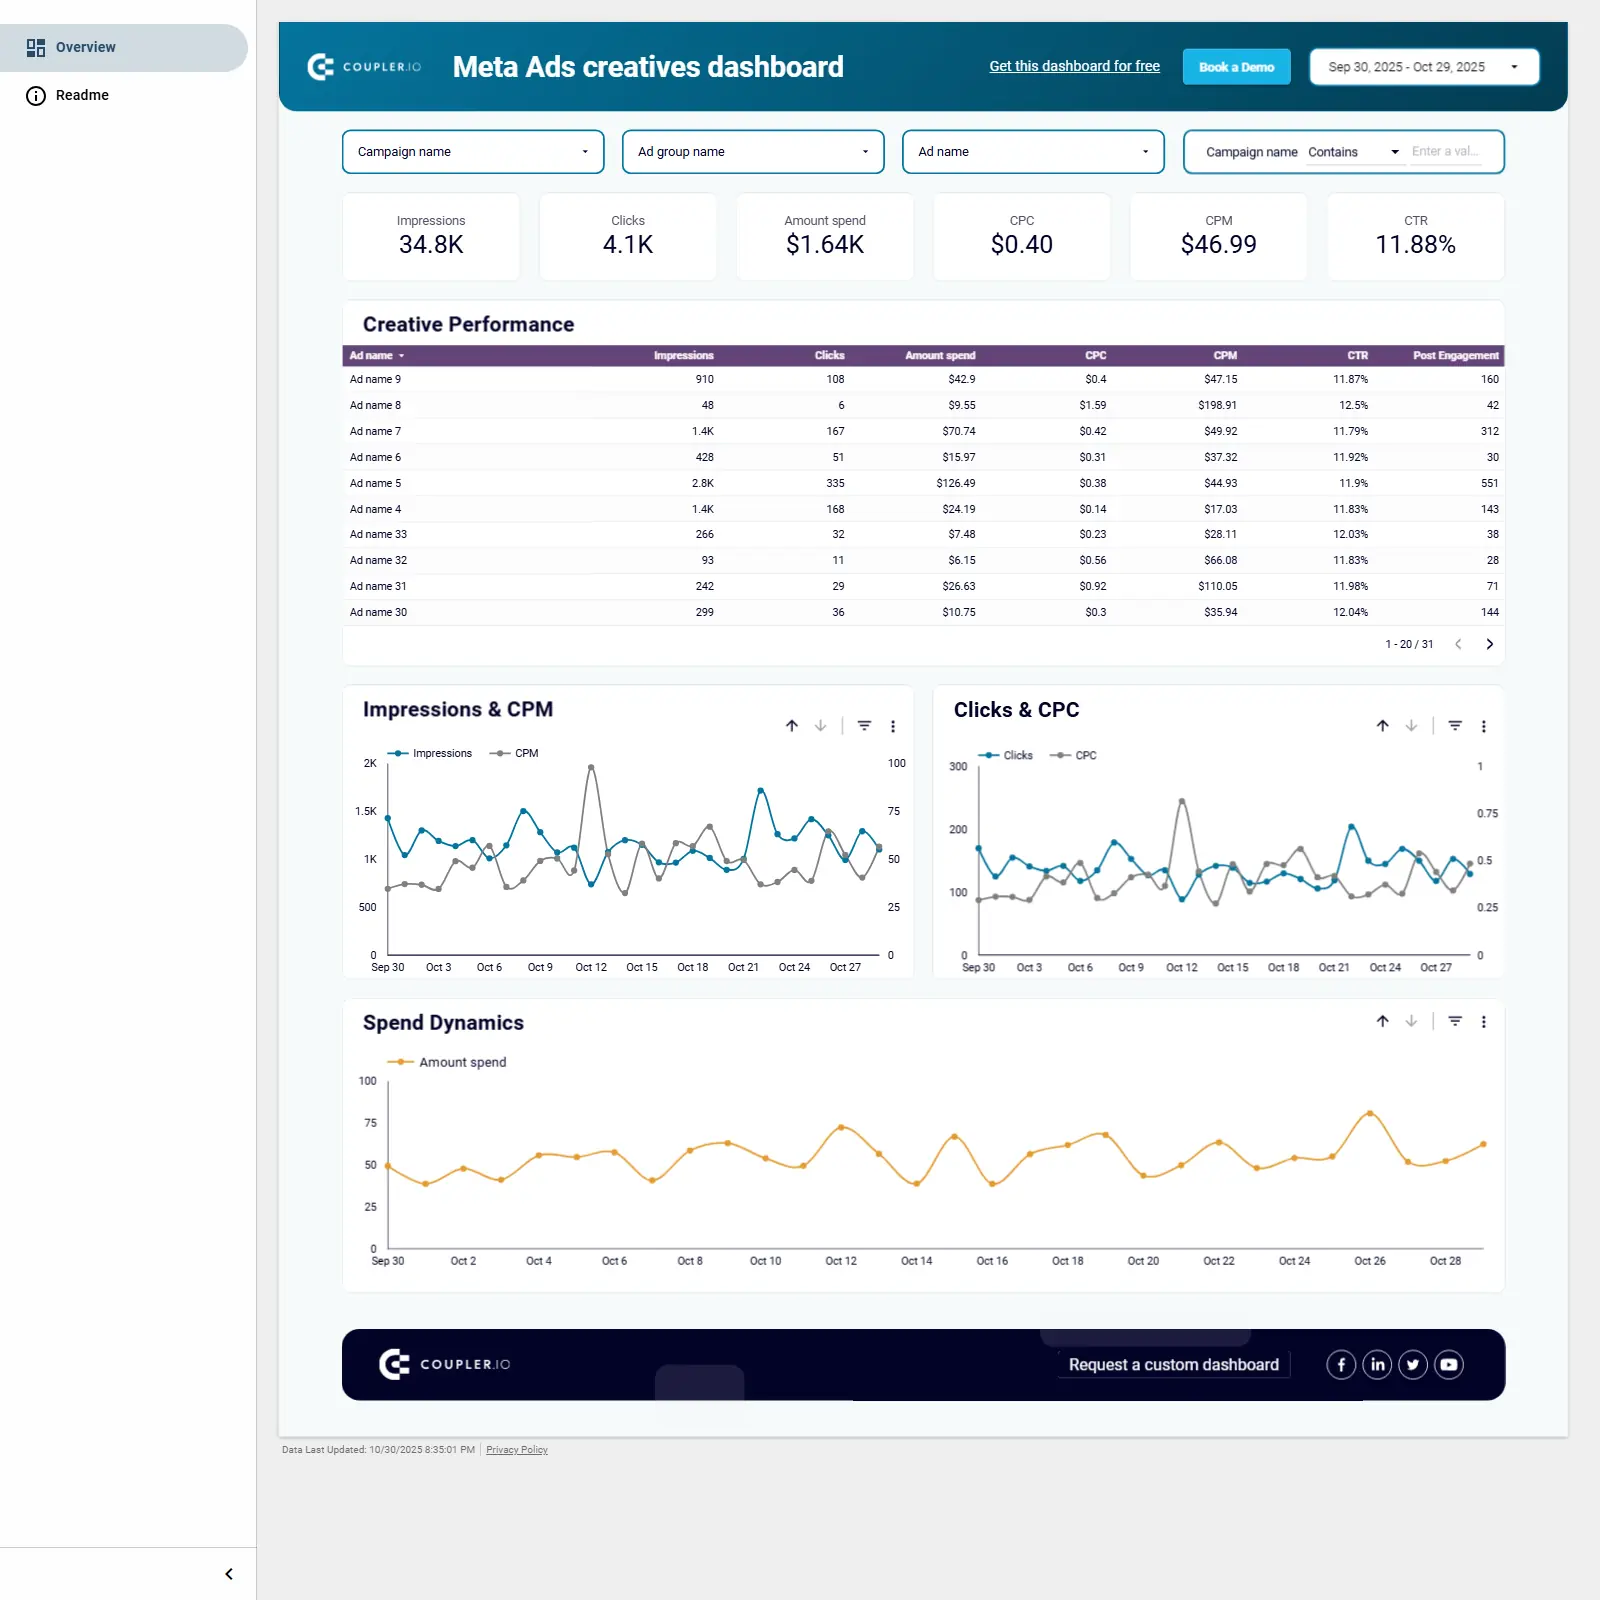
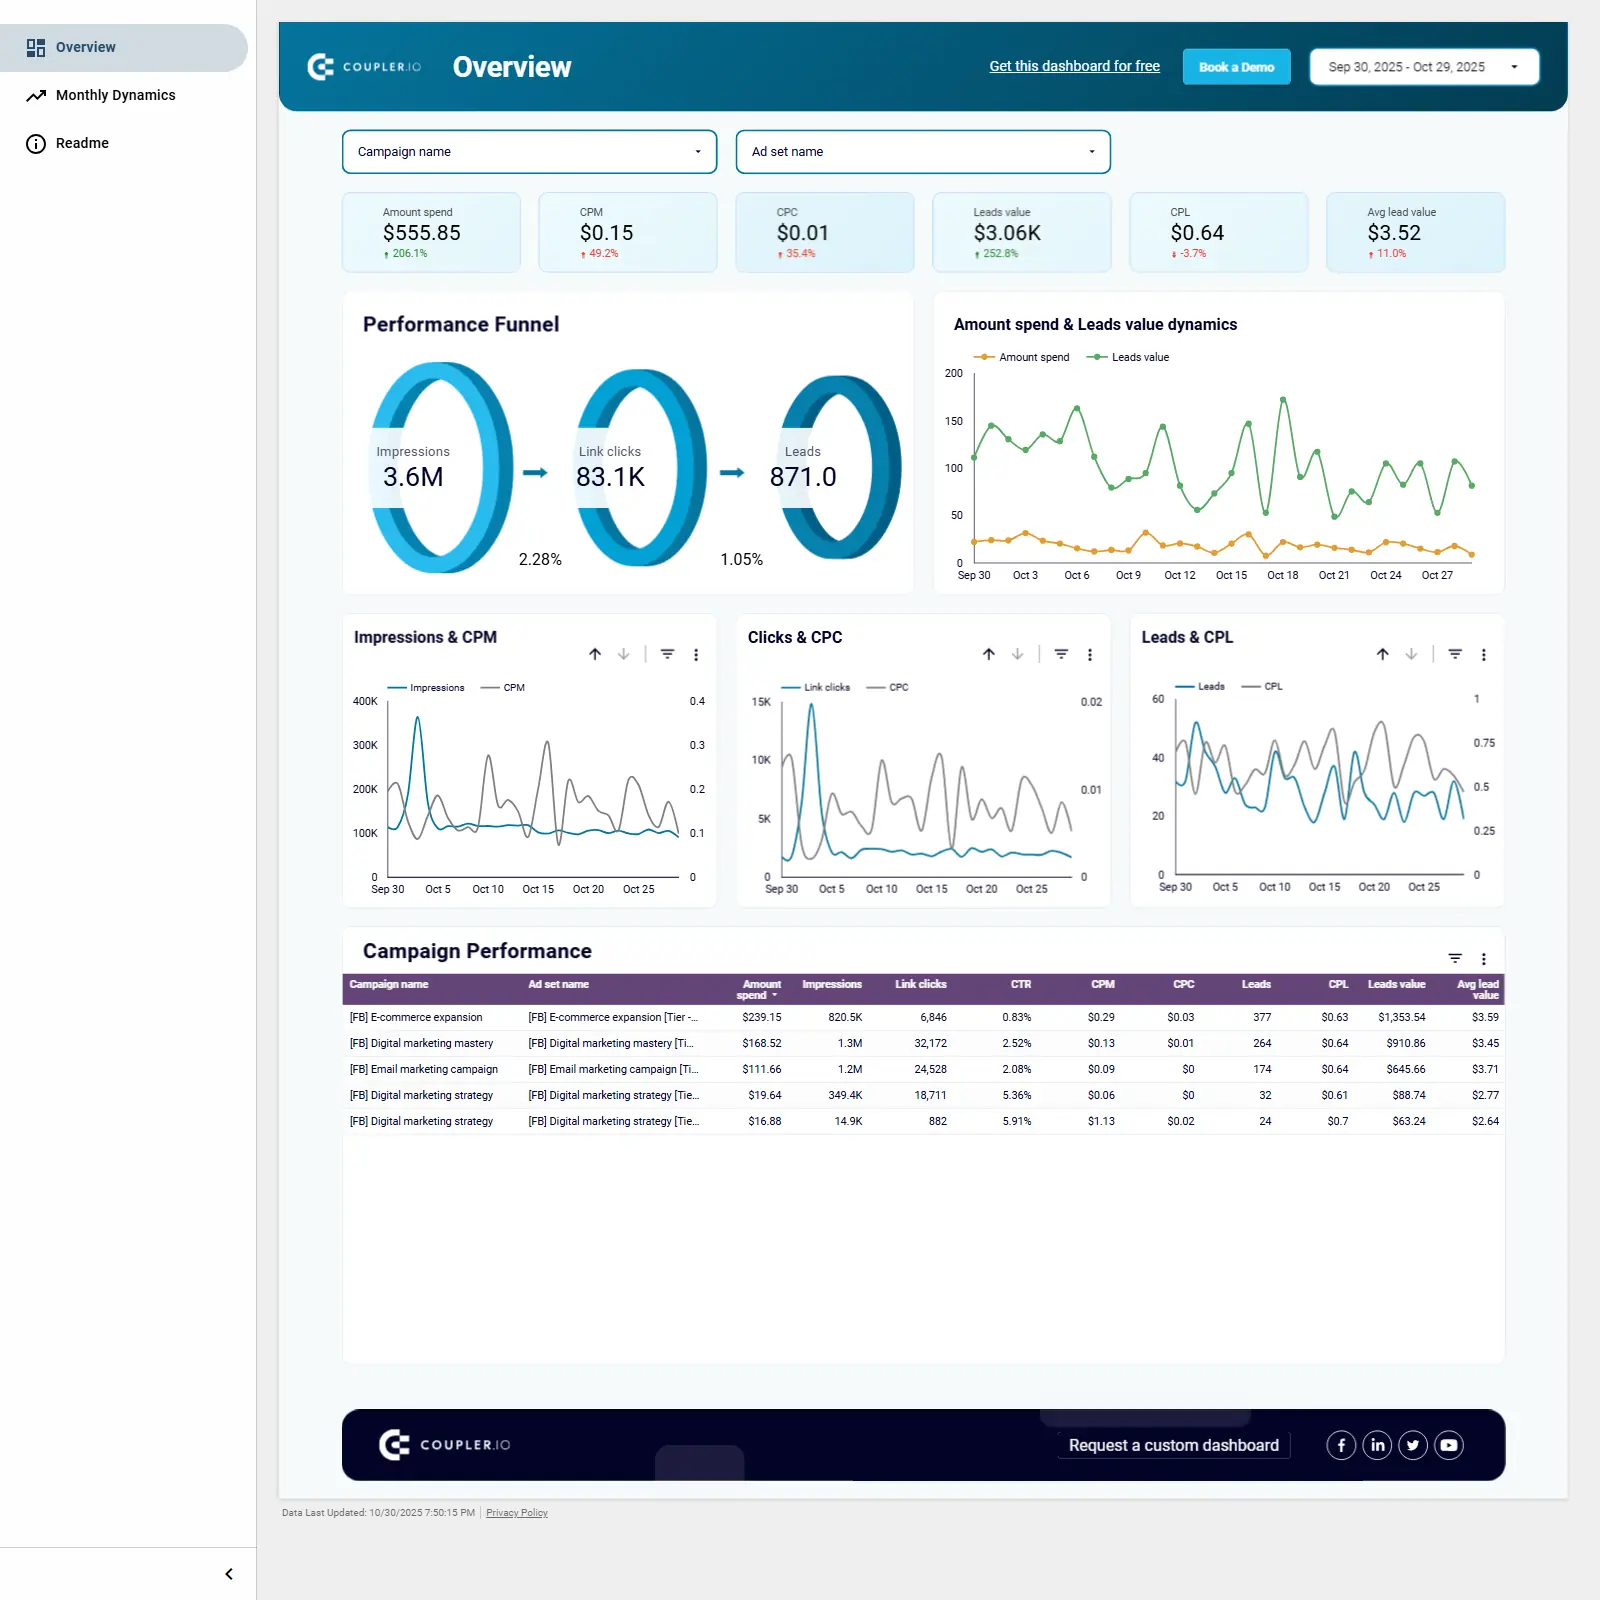
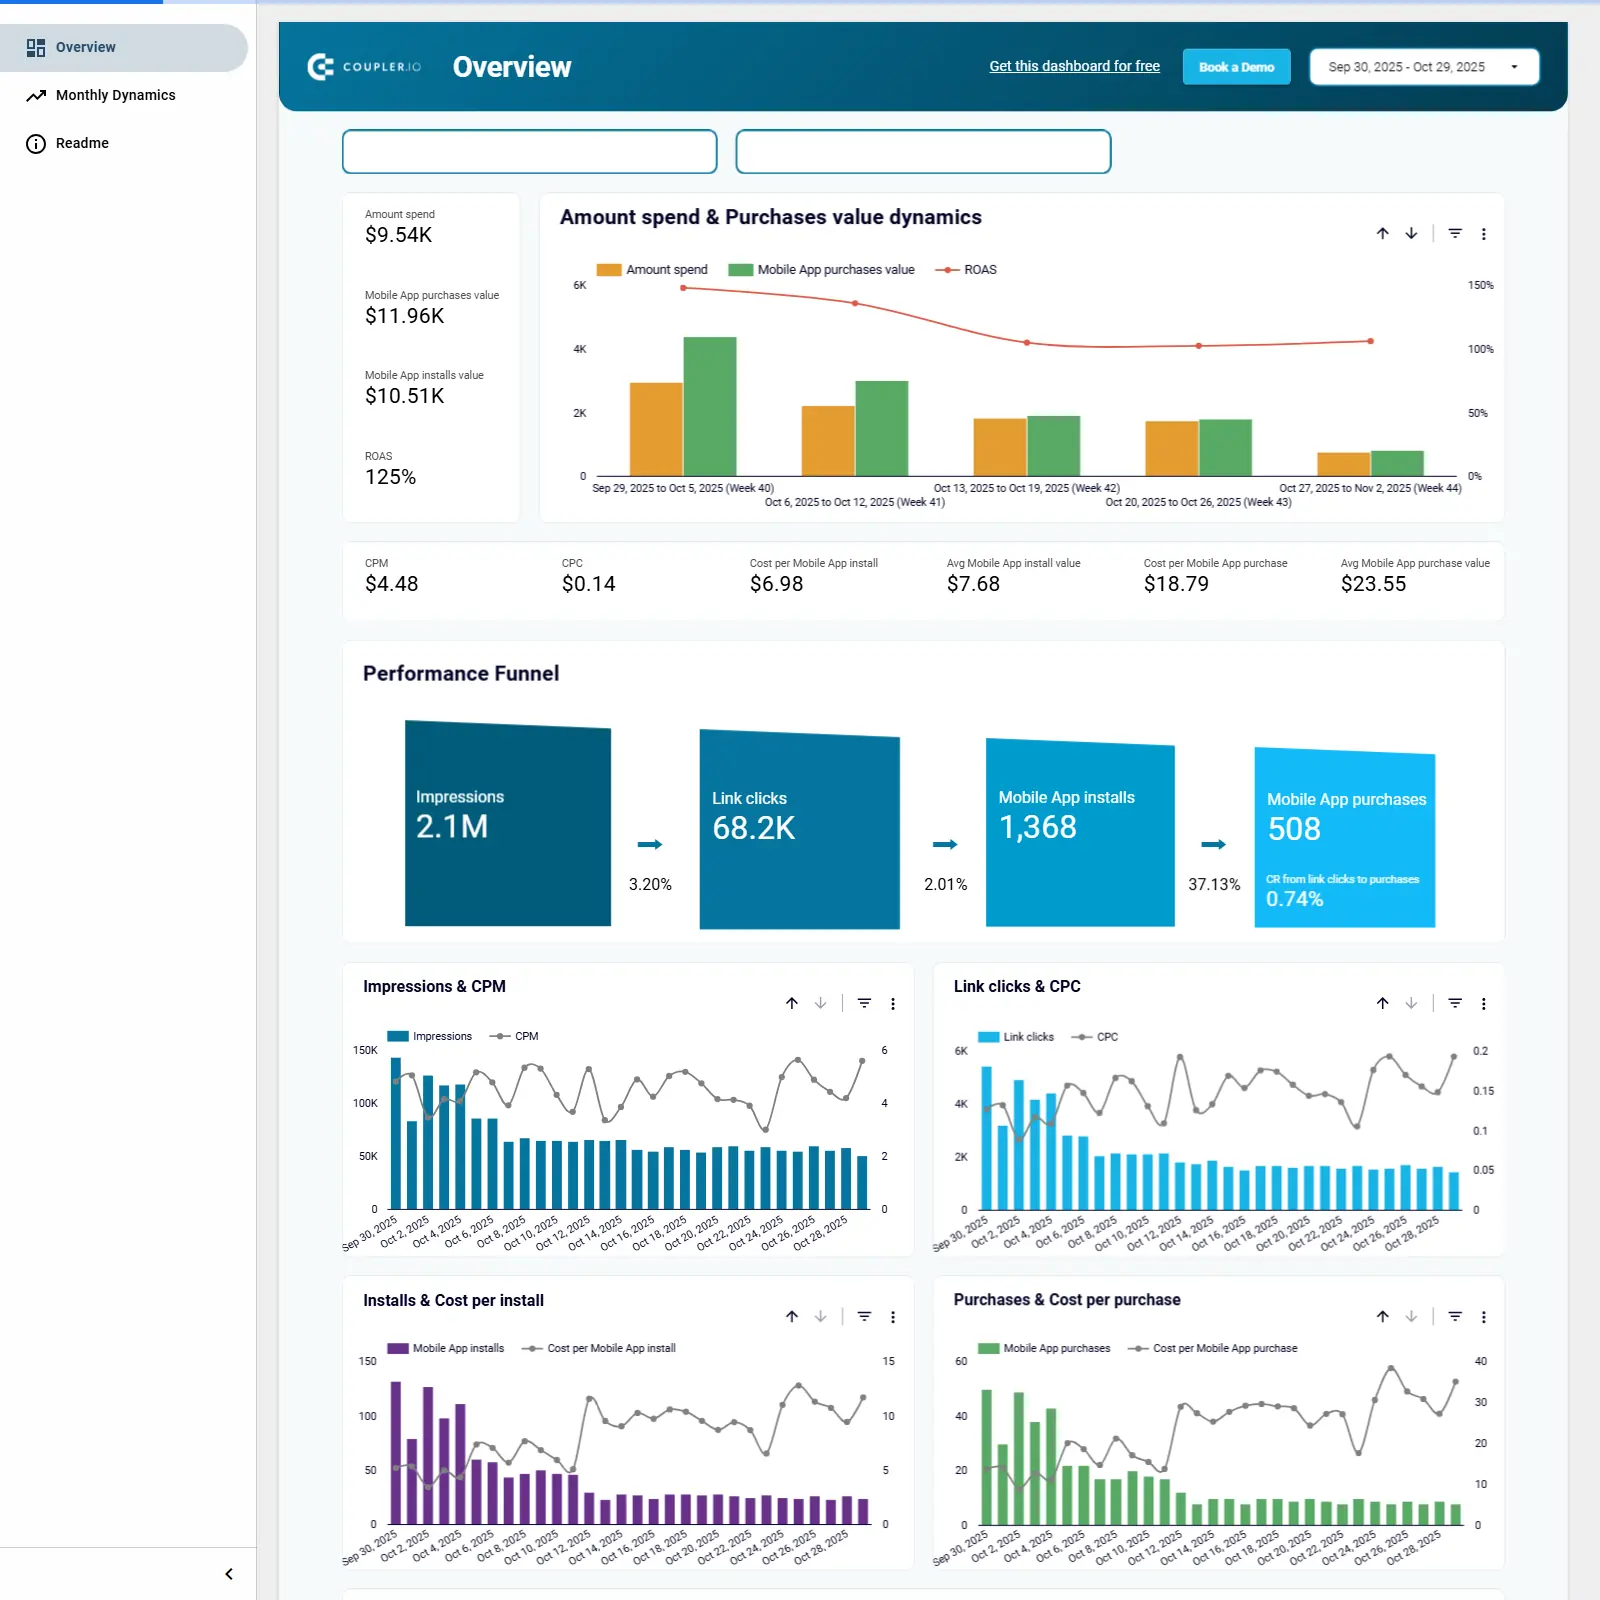
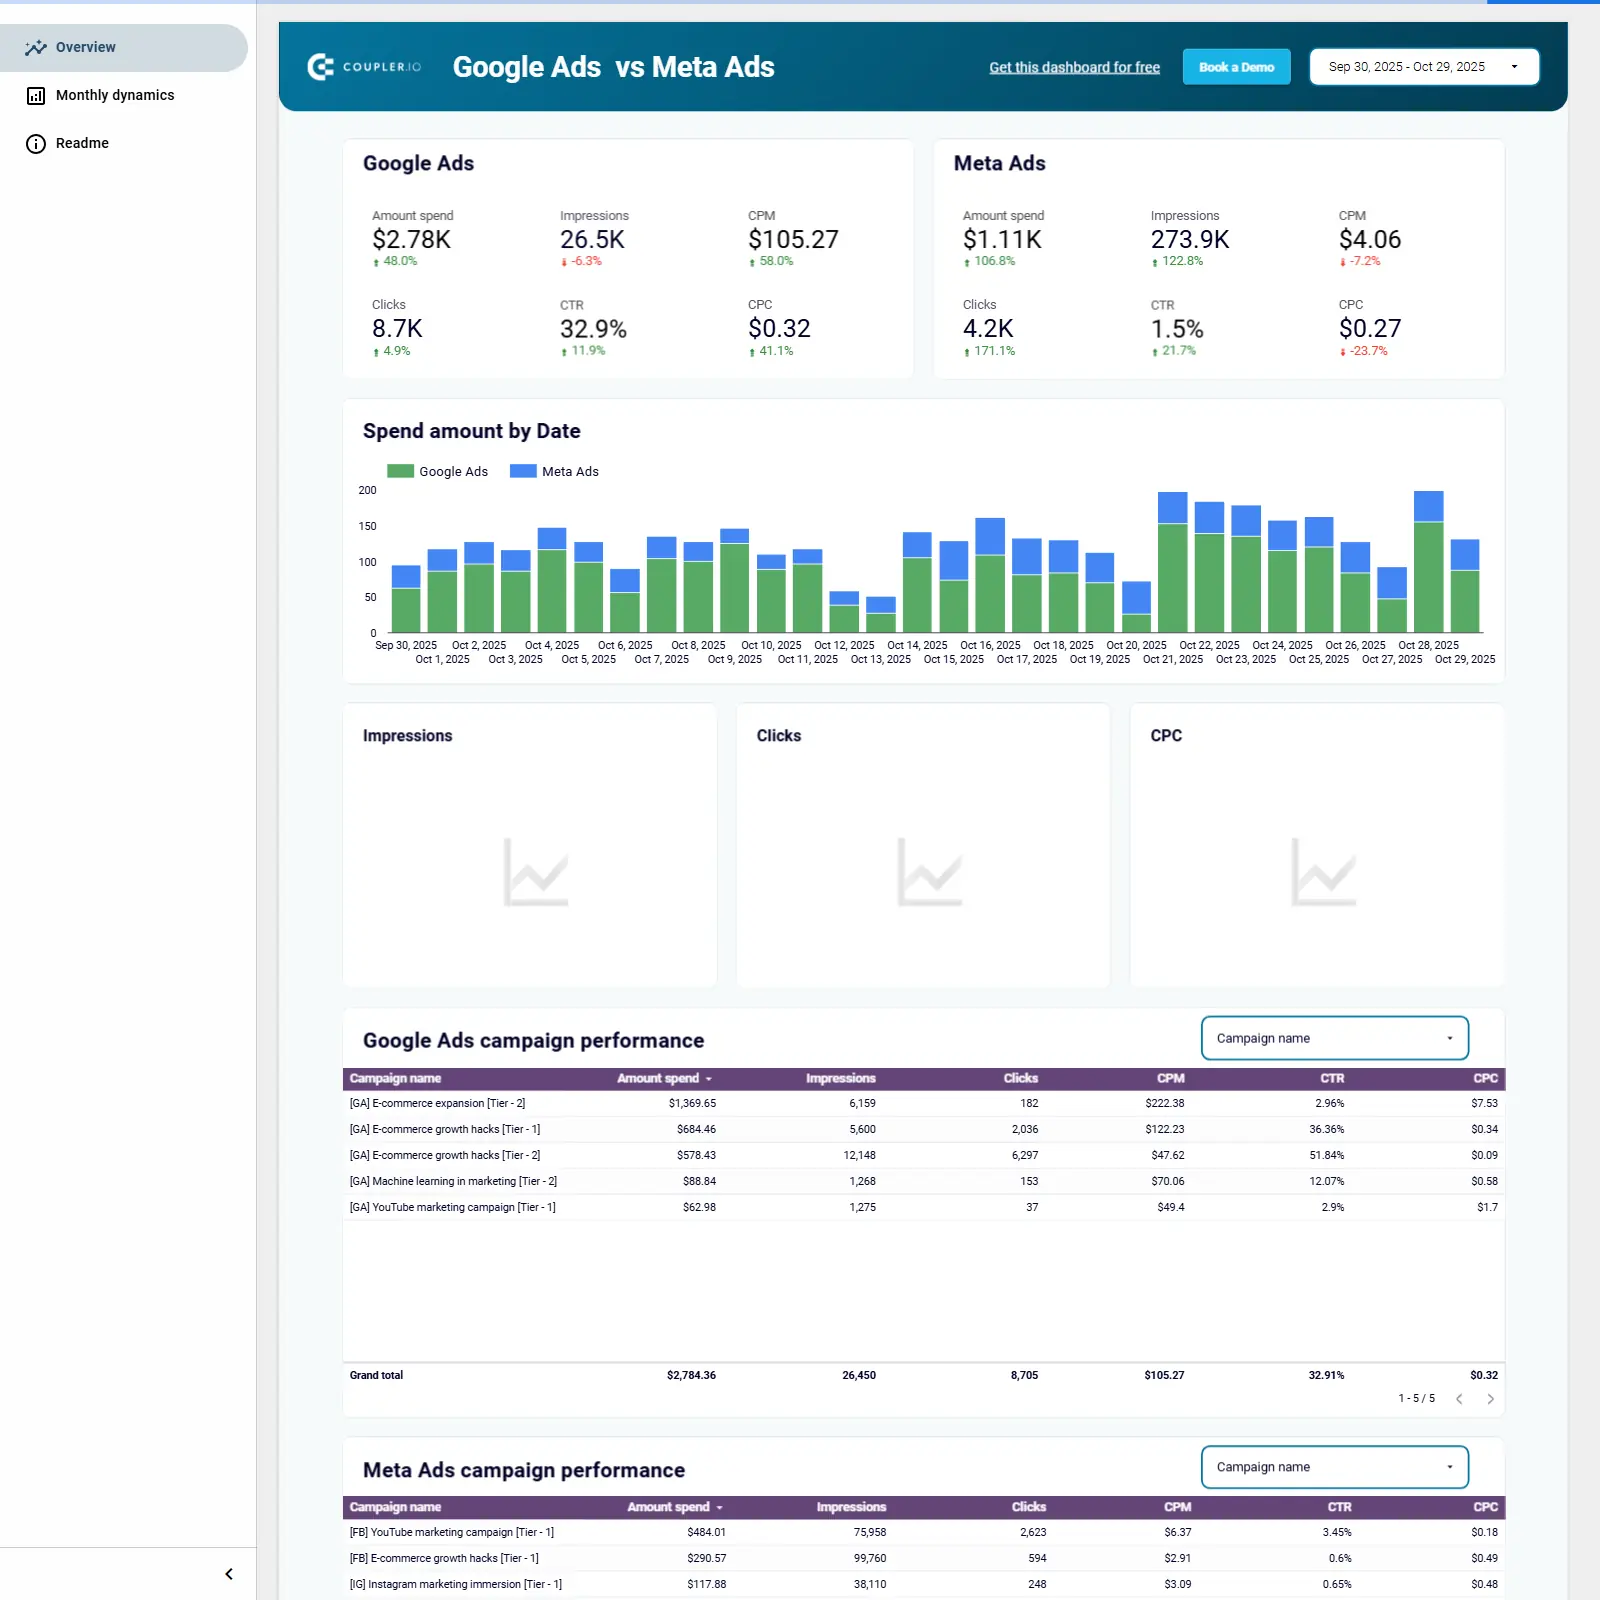
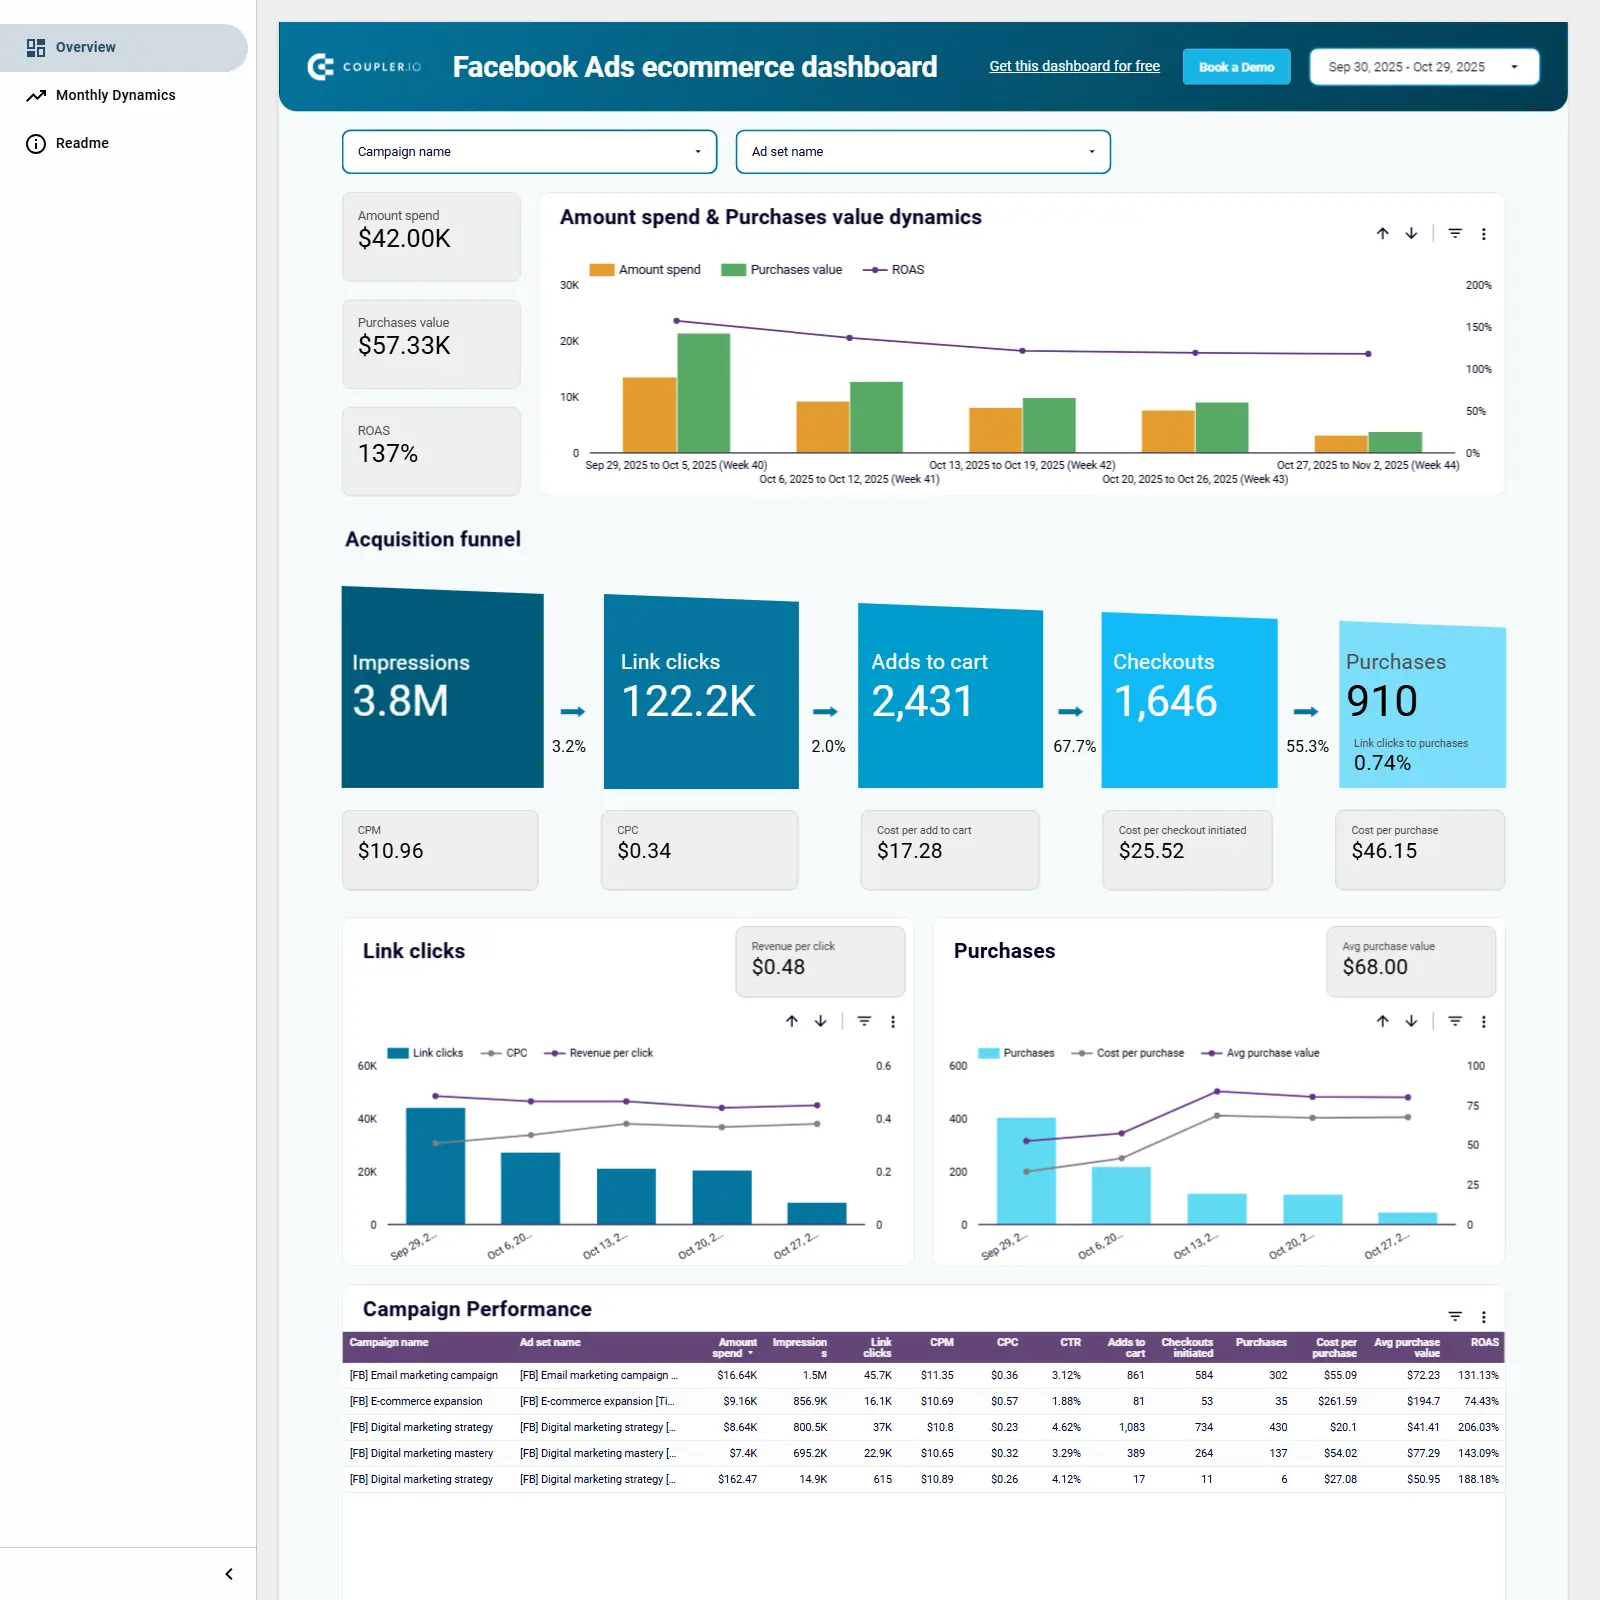
A Looker Studio template for Facebook Ads that consolidates data from Ads Manager into one view of spend, CPM, CPC, CTR, link clicks, leads, CPL, lead value, and ROAS. It visualizes the full funnel from impressions to conversions and includes a frequency meter to balance reach and avoid audience fatigue. Time-series trends, geographic insights, and a campaign/ad set/creative breakdown make it easy to spot winners and bottlenecks. Designed for marketers and agencies to compare performance across segments and reallocate budget with confidence.
Free
Facebook Ads performance for mobile apps dashboard cover image
Facebook Ads performance for mobile apps dashboard

Mobile app UA dashboard tracking spend, ROAS, CPM/CPC/CPI, and funnel from impressions to purchases with weekly trends.

Looker Studio template for tracking mobile app user acquisition across paid campaigns, from impression to purchase. Highlights spend vs. purchase value with ROAS, plus CPM, CPC, CPI, average install value, and average purchase value. A funnel summarizes conversion at each stage (impressions, link clicks, installs, purchases) while weekly trend charts reveal changes in costs and volume. Ideal for spotting bottlenecks, optimizing budgets and creatives, and quantifying revenue impact of marketing efforts.
Free
Google Ads and Meta Ads campaign performance dashboard cover image
Google Ads and Meta Ads campaign performance dashboard

Cross‑channel Google Ads vs Meta Ads dashboard for fast spend, reach, and efficiency comparisons by day and campaign.

Side‑by‑side view of Google Ads and Meta Ads performance that consolidates spend, impressions, clicks, CTR, CPC/CPM, and trend lines over time. Highlights daily spend dynamics and key totals for each network to spot spikes, dips, and efficiency shifts quickly. Campaign-level tables for both platforms surface winners and underperformers so you can reallocate budget with confidence. Designed for quick cross‑channel comparisons and monthly performance reviews without digging through multiple ad accounts.
Free
Facebook Ads ecommerce performance dashboard cover image
Facebook Ads ecommerce performance dashboard

Facebook Ads ecommerce analytics with ROAS, funnel performance, and campaign-level insights for profitable scaling.

Facebook Ads ecommerce dashboard focused on ROAS and revenue impact across campaigns and ad sets. Tracks the full acquisition funnel from impressions and link clicks to adds to cart, checkouts, and purchases, with key cost metrics like CPM, CPC, CPA, and cost per purchase. Visualizes spend vs. purchases value over time and highlights average purchase value for quick ROI reads. Includes trend charts for clicks and purchases plus a detailed campaign performance table to pinpoint top- and under-performing ads. Built for ecommerce teams to optimize budgets, reduce funnel drop‑offs, and grow profitable conversions.
Free
Facebook Ads Dashboard cover image
Facebook Ads Dashboard

Facebook Ads performance tracker for impressions, clicks, costs, spend trends, and campaign results.

Facebook Ads Overview template focused on paid social performance. Tracks impressions, clicks, CPM, CPC, spend dynamics, and campaign performance across time. Surfaces a frequency benchmark to flag when audiences are overexposed. Includes an overview and monthly dynamics to spot trends and budget shifts. Helps identify winning campaigns and areas to optimize for cost and reach.
Free