Author: twominutereport

The best free & paid Looker Studio templates, curated and quality-ranked for data reporting.

Clear All

Showing 41 - 50 of 50

Google Ads Overview Dashboard cover image
Google Ads Overview Dashboard

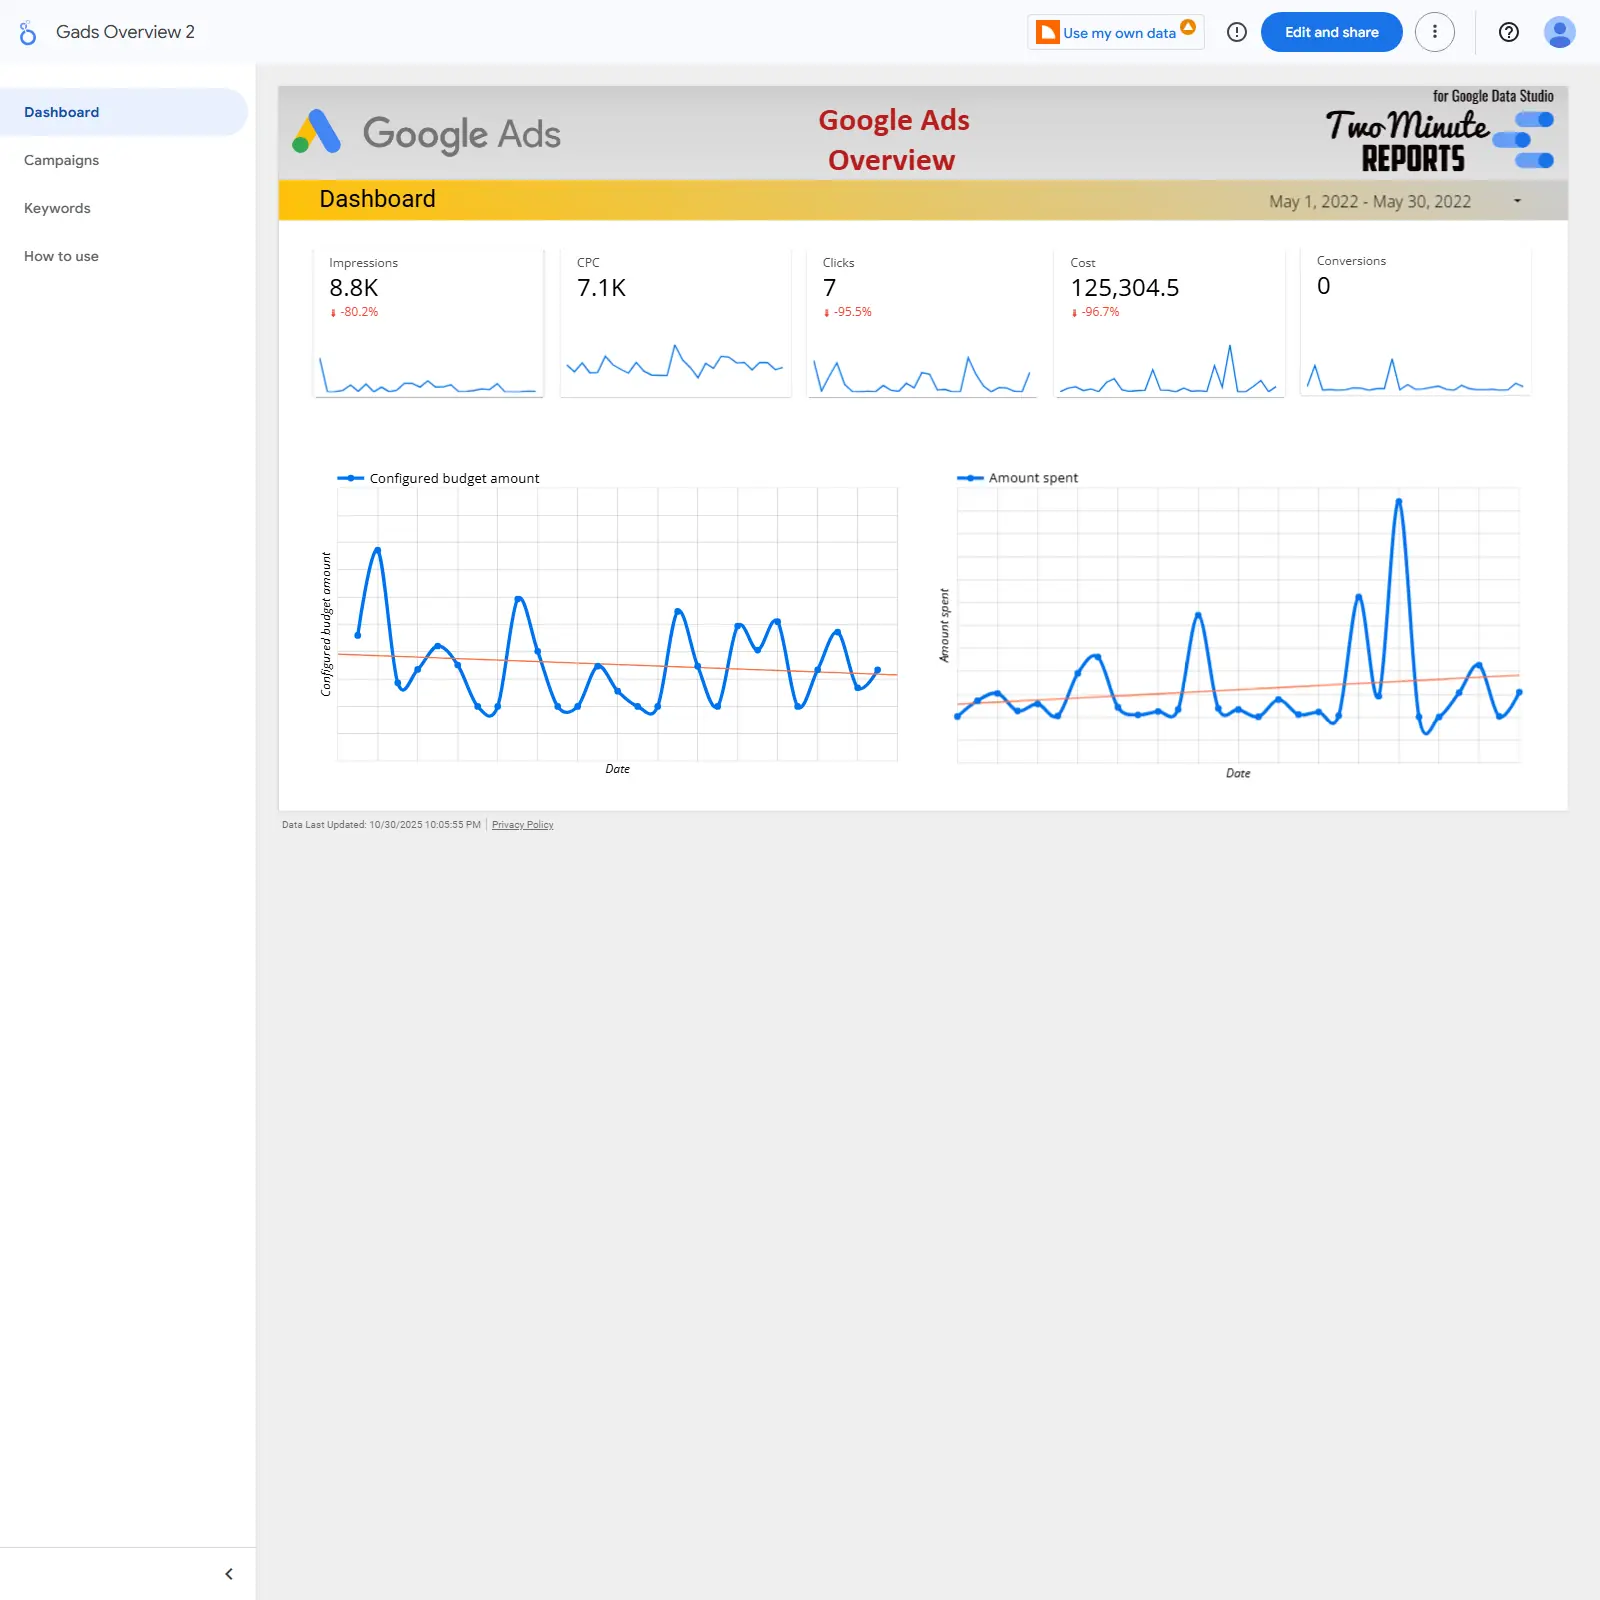
Google Ads overview with campaign and keyword analysis, including budget vs. spend and conversion-focused KPIs.

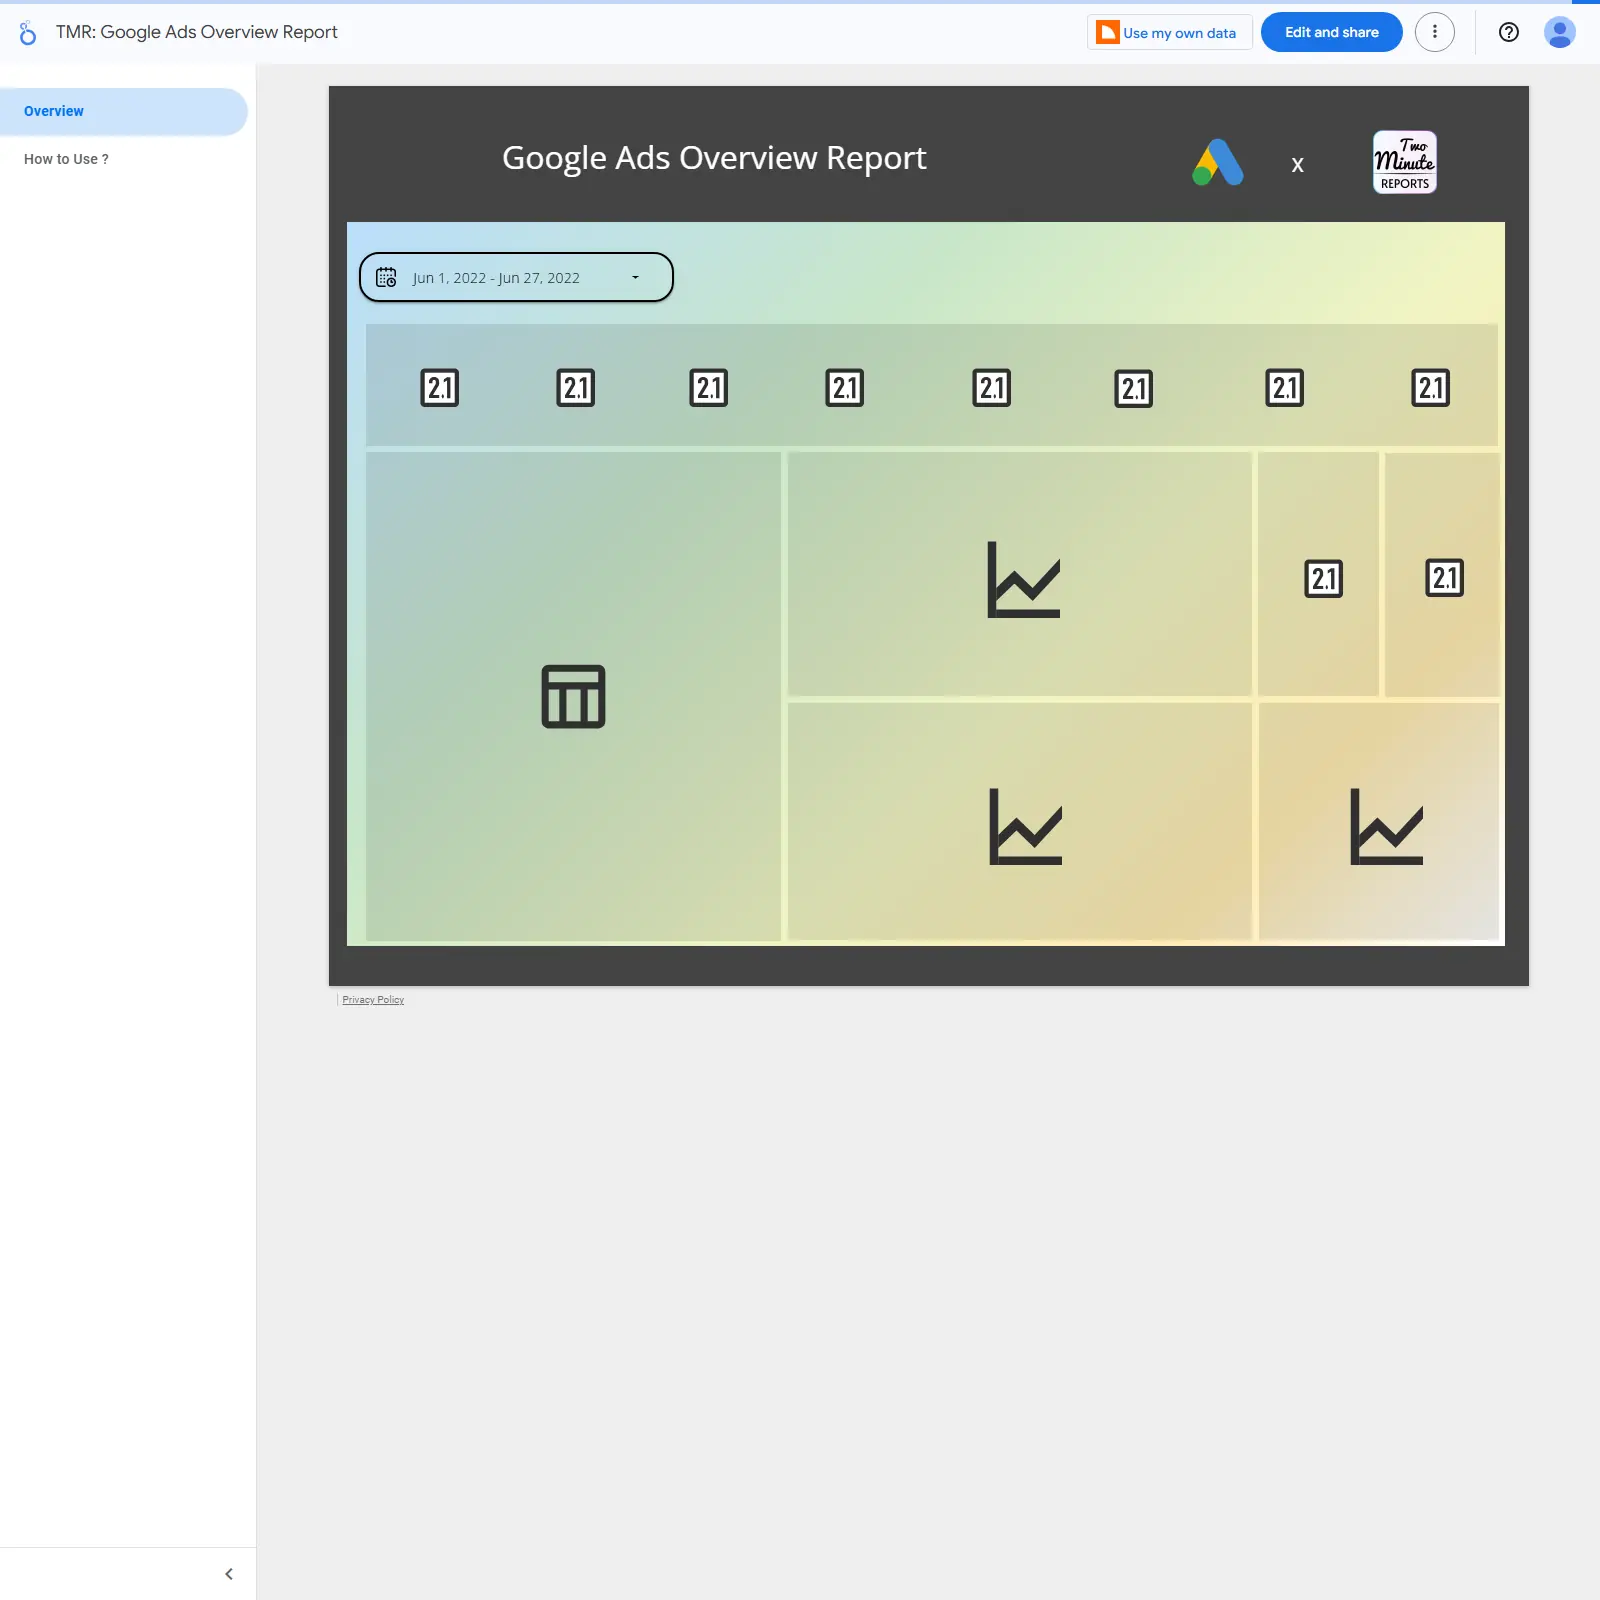
Google Ads performance at a glance with scorecards for impressions, CPC, clicks, cost, and conversions plus trend lines for configured budget and actual spend. Dig into campaigns with a table covering status, channel type, cost, impressions, interactions, interaction rate, budget delivery, conversions, and a budget column chart. Compare click distribution by campaign with an easy pie chart. Evaluate keywords with currency, bidding strategy, impressions, interactions, interaction rate, budget delivery, conversions, cost, and number of associated campaigns to spot waste and growth opportunities.
Free
Facebook Organic Monitoring Report cover image
Facebook Organic Monitoring Report

A Looker Studio template to monitor Facebook reach, engagement, likes, reactions, video views, and audience geography.

Facebook Insights Monitoring Report tracks Facebook Page performance in real time for influencers, agencies, and brand marketers. Monitor reach by source (organic, paid, viral, non‑viral), engagement, and trends in total and new likes with breakdowns of reactions and engaged users. See where new likes come from by country and evaluate video performance with titles, links, descriptions, and total views. Use the insights to spot content that resonates, compare recent periods, and refine posting and promotion strategy.
Free
Facebook Ads Performance KPIs cover image
Facebook Ads Performance KPIs

Looker Studio template to monitor Facebook Ads clicks, engagement, CTR, CPC, frequency, and CPM for fast optimization.

Facebook Ads Performance KPIs template for Looker Studio focuses on click and engagement efficiency. Track link clicks, post engagements, link CTR, CPC, frequency, and CPM to gauge performance and cost control. Spot trends and spikes to understand how creative and placements drive outcomes over time. Use the KPIs to optimize budgets, reduce CPC and CPM, and improve CTR and engagement. Ideal for advertisers who need a clear read on ad effectiveness at a glance.
Free
Tik Tok Ads Performance Overview Report cover image
Tik Tok Ads Performance Overview Report

Single-page TikTok Ads dashboard in Looker Studio to track KPIs, trends, geo/device insights, and conversion efficiency.

Single-page Looker Studio template for tracking TikTok Ads performance across key KPIs like impressions, clicks, spend, CPC, and cost per conversion. Visualizes trends over time with line charts and a campaign performance table for quick comparisons. Highlights conversion efficiency with a CPC vs. cost-per-conversion view to guide bidding and budget shifts. Includes geographic and device breakdowns to spot high-impact markets and platforms. Built to help marketers pinpoint what’s working and scale winning campaigns fast.
Free
Google Ads Overview Report cover image
Google Ads Overview Report

Google Ads overview in Looker Studio with trend lines, KPI scorecards, and cross-account comparisons for impressions, clicks, and CTR.

Track Google Ads performance at a glance with a Looker Studio overview focused on the essentials. See trends for impressions and clicks with clean line charts, get headline KPIs via scorecards, and compare impressions and CTR across accounts in one view. Spot spikes, dips, and underperforming accounts faster to prioritize optimization. Ideal for PPC teams and stakeholders who want a fast read on campaign health.
Free
Google Ads Monitoring Report cover image
Google Ads Monitoring Report

A focused Google Ads dashboard for tracking CTR, CPC, bounce rate, impressions, pageviews, campaigns, and top ads with geo and device insights.

Monitor Google Ads performance at a glance with key KPIs like impressions, CTR, CPC, bounce rate, and average pageviews plotted over time. Identify winning and underperforming campaigns with a concise campaign overview and Top Ads table. Uncover where results come from using country and device insights. Built to handle multiple ad accounts so teams can keep a single view of ad health and trends.
Free
Facebook insight performance overview cover image
Facebook insight performance overview

Quarter-over-quarter Facebook Page analytics covering growth, engagement, and reaction breakdowns with organic vs. paid insights.

Quarter-over-quarter Facebook Page performance comparison with flexible month selection to benchmark progress over time. Tracks growth metrics like fan adds, reach, paid reach, impressions, and paid impressions to highlight organic vs. paid impact. Measures audience engagement with post engagements, engaged users, and overall page performance. Breaks down reactions—like, love, haha, wow, sorry, anger—into positive and negative actions to spot sentiment shifts. Helps pinpoint trends, content winners, and areas needing attention across awareness and engagement.
Free
Facebook Organic Performance Dashboard cover image
Facebook Organic Performance Dashboard

Monitor Facebook page reach, engagement, reactions, and video performance with clear KPIs and trend visuals.

Facebook Insights Performance Dashboard focuses on page performance across reach, impressions, engagement, and reactions. Track trends for total and unique video views, day-by-day likes, and engaged users, with quick KPI callouts for context. Review reaction breakdowns (like, love, haha, wow, sorry, anger) to gauge audience sentiment. Analyze individual video posts with titles, descriptions, and permalinks. Compare current results against the previous period to spot momentum and dips fast.
Free
Microsoft Advertising Overview cover image
Microsoft Advertising Overview

Microsoft/Bing Ads overview with key KPIs, trend charts, and account-to-ad performance tables with quarterly comparisons.

Single-page Looker Studio template for Microsoft Advertising (Bing Ads) that highlights core PPC KPIs like impressions, clicks, amount spent, and CPC. Shows time-series trends for impressions and clicks to spot rises or dips quickly. Breaks down performance by account, campaign, and individual ads with quarterly comparison data. Includes table-level stats such as CTR and conversions to pinpoint what’s working. Ideal for fast monitoring and client-ready overviews of Microsoft Ads performance.
Free
FaceBook Page Insights Report cover image
FaceBook Page Insights Report

A Looker Studio template for Facebook Page analytics covering reach, impressions, video views, followers, reactions, and paid vs. organic breakdowns by page.

Track Facebook Page performance in Looker Studio, focusing on video views, page reach, impressions, followers, and reaction totals. Compare paid vs. organic impressions across pages to understand where growth is coming from. Visualize post clicks and video views by page to spot the content that engages audiences. Use reach and engagement breakdowns to prioritize posting strategies and allocate budget more effectively. Ideal for social media managers and agencies needing quick, shareable insights.
Free