Author: unknown

The best free & paid Looker Studio templates, curated and quality-ranked for data reporting.

Clear All

Showing 1 - 4 of 4

Orders Report cover image
Orders Report

Order performance dashboard with KPIs, geographic and category breakdowns, and year/month trends.

Order analytics focused on tracking demand and fulfillment across customers, regions, and product categories. Key KPIs spotlight total orders, customers, states served, and active segments for quick health checks. Visual breakdowns reveal which regions, cities, segments, and categories drive the most orders. Yearly and monthly trend lines surface growth and seasonality to guide planning. Detail tables list recent orders and state-level quantities to support prioritization and follow‑up.
Free
Order Report cover image
Order Report

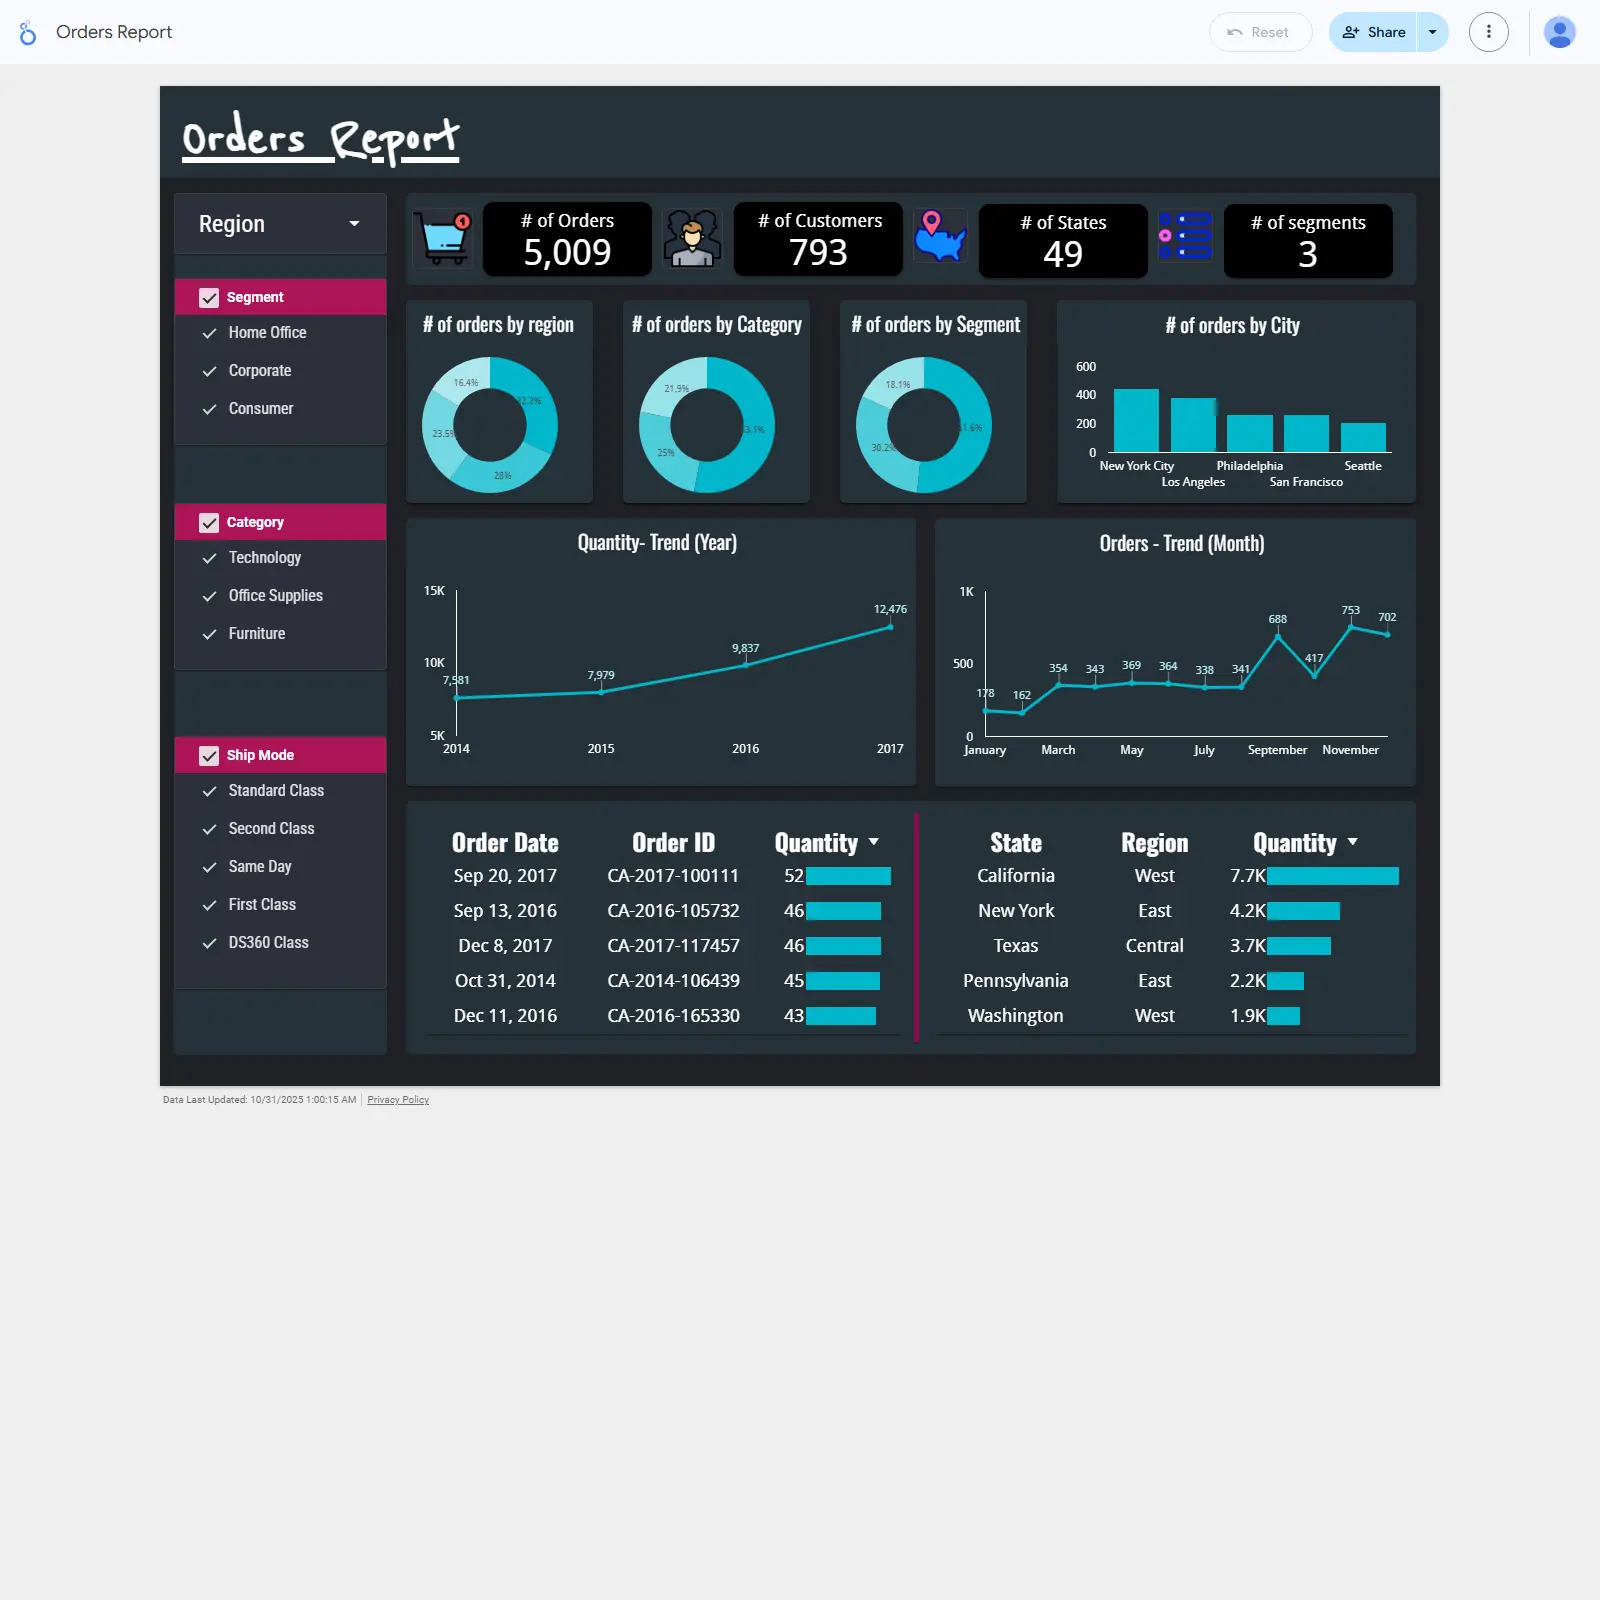
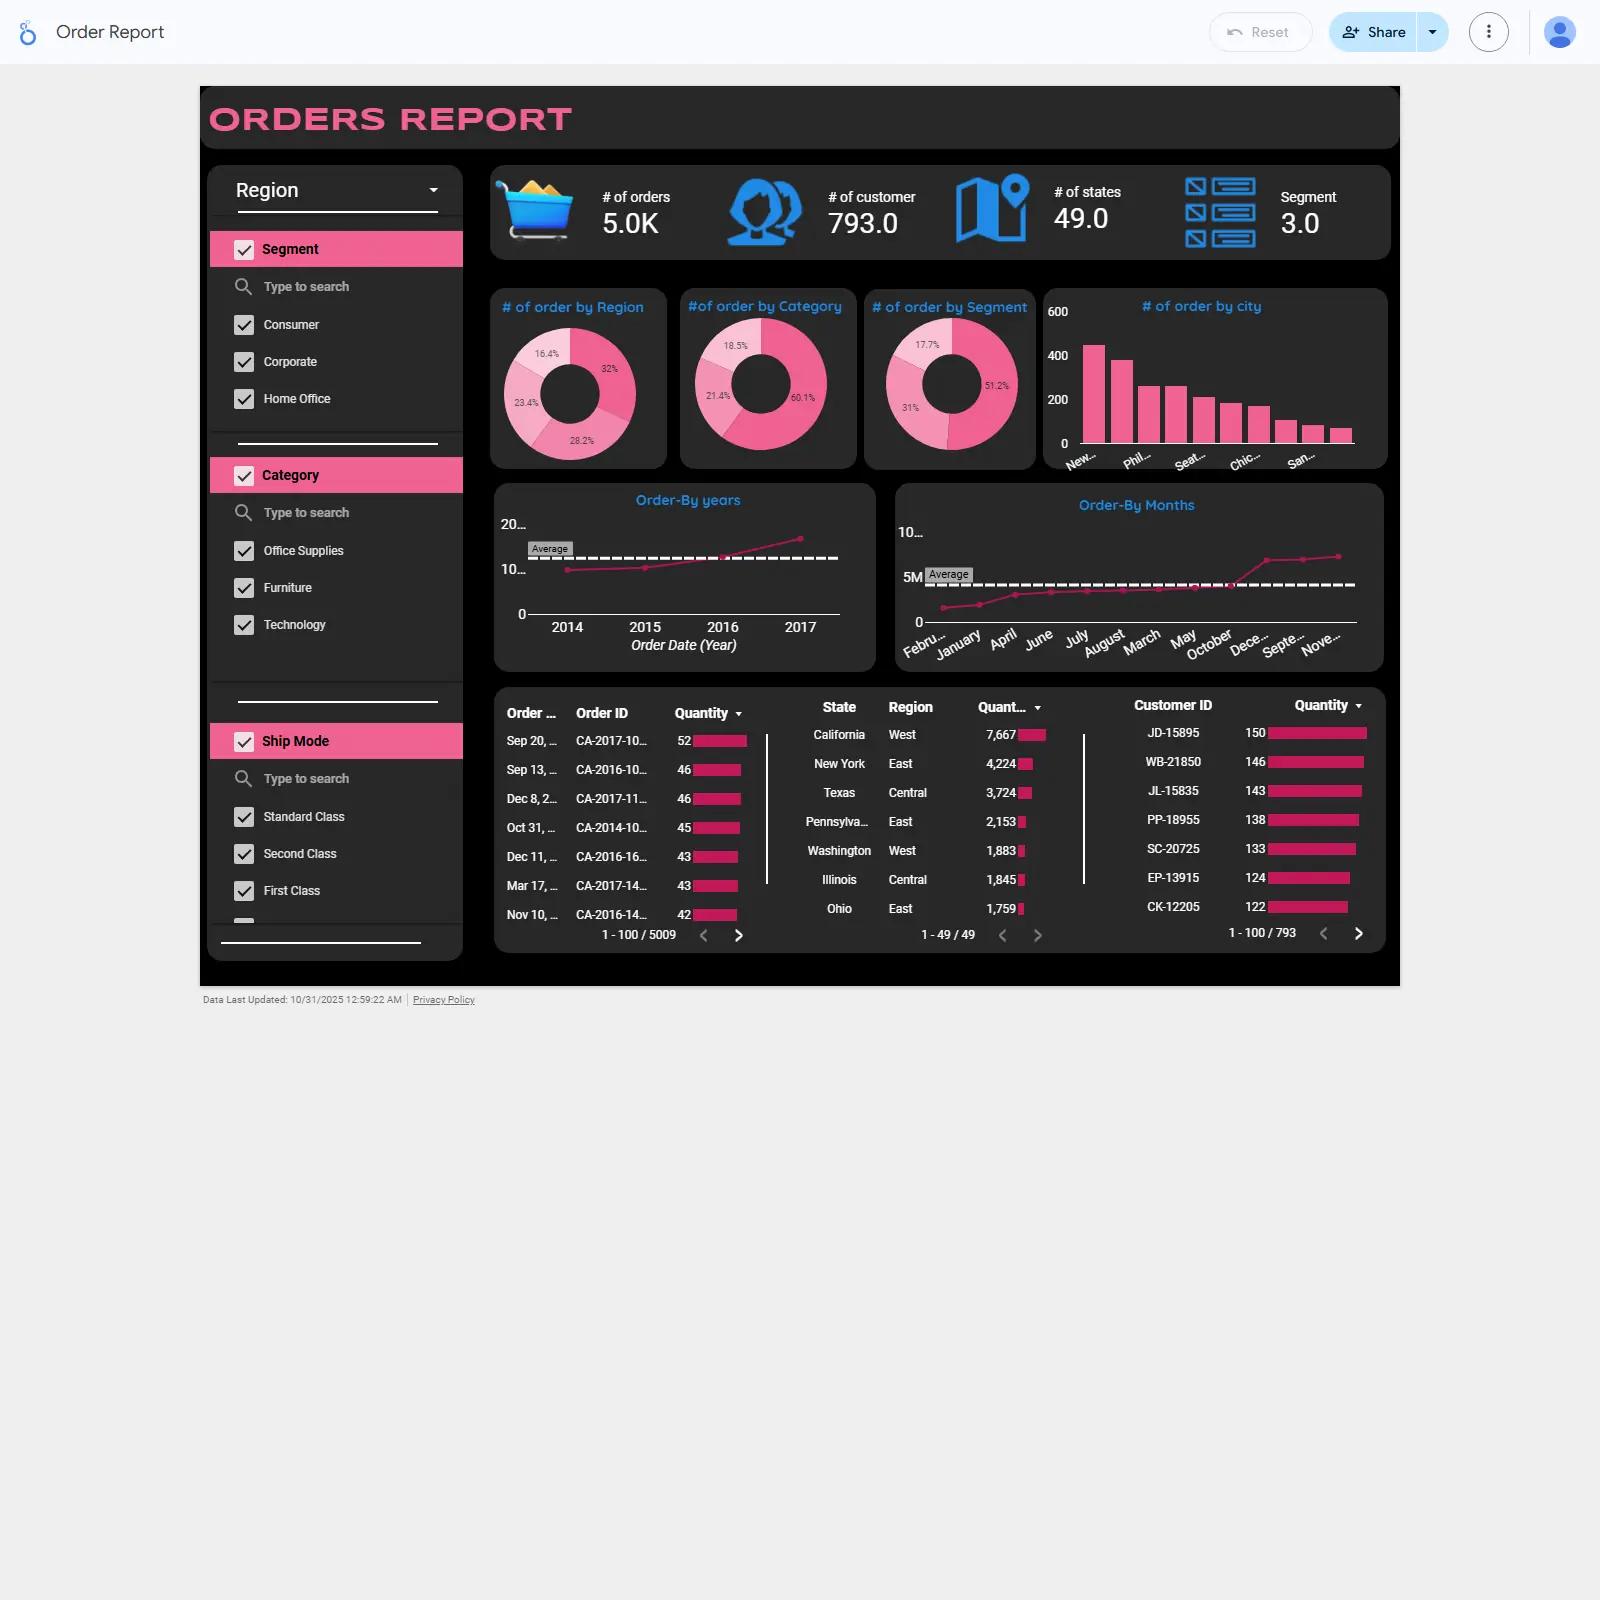
Orders analytics template tracking totals, trends, and top performers across regions, categories, segments, and cities.

Orders Report template focused on sales performance across regions, categories, segments, and cities. Highlights core KPIs such as total orders, number of customers, and geographic coverage, with trends by year and month. Visuals rank top states, customers, and orders by quantity to surface best performers and opportunities. Ideal for spotting seasonal peaks, regional demand shifts, and product category contribution in a clean dark theme.
Free
Customer Retention Analysis cover image
Customer Retention Analysis

Customer retention dashboard with cohort analysis, LTV, repeat purchase timing, and yearly retention highlights.

Customer Retention Analysis focused on tracking how well customers return and stay active from 2022 to 2024. Highlights include a large cohort analysis to compare repeat behavior over time, plus KPIs for current‑year status. Measures average customer lifetime value and the average time to a repeat order to quantify revenue and loyalty. Surfaces yearly peaks in retention to learn what worked and replicate it. Built for teams that need a clear view of churn, loyalty, and growth opportunities.
Free
Sales Dashboard cover image
Sales Dashboard

Sales analytics dashboard covering demographics, category performance, top cities, shipping popularity, and payment mix to pinpoint growth opportunities.

Sales analytics template focused on understanding revenue drivers across customers, categories, and locations. Sections cover core sales, customer demographics, product category analysis, and customer behavior. Key views include shipping method popularity across the year, orders by payment methods, and top cities ranked by sales and profit with category breakdown. Use it to spot high‑performing cities and categories, optimize shipping and payment mix, and target the right customer segments. Ideal for commerce teams needing fast, actionable insights for growth and allocation decisions.
Free