Price: Free Templates

The best free & paid Looker Studio templates, curated and quality-ranked for data reporting.

Clear All

Showing 321 - 360 of 443

Campaign Performance Dashboard - Facebook Ads cover image
Campaign Performance Dashboard - Facebook Ads

Facebook Ads campaign performance with trends, CPC/CPM, CTR, frequency, and campaign-level comparisons to optimize spend and results.

Facebook Ads campaign performance at a glance for clearer budget and ROI decisions. Monitor core KPIs like Impressions, Reach, Clicks, Link Clicks, CTR, CPC, CPM, and Frequency to understand cost and engagement. Trend charts highlight how impressions and clicks move over time so you can catch momentum or drops fast. A campaign comparison table surfaces spend, reach, and efficiency by campaign to spot winners and underperformers. Ideal for optimizing budgets, refining targeting, and reporting results to stakeholders.
Free
Template Meta Ads - Overview V2 cover image
Template Meta Ads - Overview V2

Meta Ads overview focusing on spend, reach, clicks, adds to cart, purchases, CPA, and ROAS across campaigns and ad sets.

Meta (Facebook) Ads performance overview tailored for Looker Studio. Tracks the full funnel with spend, impressions, reach, CPM, link clicks and CPLC, adds to cart and CPATC, purchases, purchase value, CPA, and ROAS. Includes trend charts that compare current results with the prior period to spot shifts in cost and efficiency. Campaign and ad set tables highlight top and underperforming segments for quick budget and creative decisions. Ideal for e‑commerce teams monitoring outcomes from awareness to purchase.
Free
Facebook Ads - Multi ad accounts report cover image
Facebook Ads - Multi ad accounts report

Unified Looker Studio dashboard for multiple Facebook Ads accounts with aggregated metrics and account-level drilldowns.

A unified Facebook Ads reporting template that aggregates performance across multiple ad accounts in Looker Studio. Compare accounts side by side or drill into a single account while tracking essential ad KPIs to evaluate spend efficiency and results. Ideal for freelancers, agencies, and multi-country teams needing a consolidated view of overall performance. Connect via Catchr to stream real-time Facebook Ads data and keep metrics consistently up to date.
Free
Template ActiveCampaign cover image
Template ActiveCampaign

ActiveCampaign campaign overview in Looker Studio for real‑time email KPIs and comparisons.

Track ActiveCampaign campaign performance in Looker Studio with a focused overview of your email KPIs. Pulls metrics and dimensions directly from ActiveCampaign via Catchr for real‑time visibility into sends, opens, clicks, and engagement by campaign. Compare campaigns, spot trends, and surface winners to optimize content and timing. Built for marketers who need quick, shareable insights and clean visuals. Free template that works with Catchr’s ActiveCampaign connector.
Free
GEO AI Mode AI Overviews Dashboard for Search Console cover image
GEO AI Mode AI Overviews Dashboard for Search Console

Monitor clicks, impressions, position, and trends for AI Overviews‑like queries from Google Search Console.

Tracks Google Search Console performance for AI Overviews‑like queries. Surfaces clicks, impressions, and average position with a clean summary and a query table for granular analysis. Highlights daily trends so you can spot changes in visibility and traffic tied to these query types. Useful for SEOs assessing the impact of Google’s AI Overviews on branded and non‑branded keywords.
Free
TikTok Ads Performance cover image
TikTok Ads Performance

Track TikTok Ads KPIs with overview, campaign/ad performance, spend analysis, and demographic insights in Looker Studio.

TikTok Ads Performance focuses on tracking the essential KPIs for your TikTok advertising, with clear views for overview, campaign and ad performance, and demographics. It highlights spend trends over time, spend by advertising objective, and top campaigns to spot what’s working and where to reallocate budget. Built for Looker Studio with Catchr’s no‑code connector, it brings all your TikTok Ads metrics and dimensions into one place with real‑time updates. Ideal for quickly assessing performance and guiding creative, targeting, and budget decisions.
Free
Google Ads Visibility Overview cover image
Google Ads Visibility Overview

Track Google Ads visibility and impression share trends by device, region, date, and campaign.

Google Ads visibility at a glance with impressions, viewable impressions, call impressions, search/content impression share, and absolute top/top impression percentage. Time-performance visuals highlight trends so you can catch dips in impression share early. Breakdowns by date, device, and region map uncover where visibility is strongest or needs attention. Campaign-level comparisons help prioritize budgets and bidding to win more eligible impressions.
Free
Amazon Seller Central Dashboard cover image
Amazon Seller Central Dashboard

All-in-one Looker Studio dashboard for Amazon sellers to track sales, orders, and inventory with detailed damaged-quantity insights.

Amazon Seller Central dashboard for Looker Studio that centralizes sales, orders, and inventory performance for Amazon sellers. Surface quick insights on total sales and order health while tracking latest orders with fields like order status, channel, Prime and replacement indicators. Monitor inventory status alongside a detailed damaged-quantity breakdown by carrier, customer, distributor, and warehouse, mapped to ASIN and product names. Built to highlight operational issues and stock risks so you can react faster. Can be white‑labeled with your brand logo.
Free
Stripe cover image
Stripe

Looker Studio dashboard for Stripe to monitor balance, customers, subscriptions, payments, and invoices in real time.

Stripe analytics for Looker Studio focused on cash flow and subscription performance. Track current balance, new customers, new subscribers, failed/default payments, and invoices at a glance. Connects directly to Stripe for real-time data with access to all metrics and dimensions. Ideal for monitoring revenue health and spotting payment issues quickly. Built by Catchr and ready to share with your team.
Free
Snapchat Ads Overview Report cover image
Snapchat Ads Overview Report

Single-page Snapchat Ads overview with trends, audience breakdowns, and campaign performance for quick optimization.

Single-page Snapchat Ads analytics focused on the essentials: impressions, clicks, video views, swipes, camera saves, spend, and period-over-period change. Daily trend charts highlight how engagement and reach evolve over time. Audience insights break down impressions by country and gender for quick targeting takeaways. A campaign performance section helps pinpoint top performers and areas to cut waste. Ideal for monitoring results and steering budget and creative decisions fast.
Free
Shopify E-Commerce Report cover image
Shopify E-Commerce Report

Single-page Shopify Looker Studio dashboard for sales, orders, AOV, discounts/refunds, top products, and inventory insights.

Single-page Shopify analytics in Looker Studio that brings sales, transactions, and product performance into one view. Track total and net sales, customer order count, average order value, discounts, refunds, and top orders/products alongside inventory insights. Compare revenue and order trends over time and see which items drive the most sales and margin. Use it to spot growth opportunities, control costs, and keep stock levels aligned with demand.
Free
Microsoft Ads Performance Review cover image
Microsoft Ads Performance Review

A focused Microsoft Ads dashboard for account health, campaign performance, and keyword efficiency—updated in real time.

Microsoft Ads Performance Review is a Looker Studio template for PPC teams to audit and monitor Microsoft Advertising performance. Get a full account overview, campaign-level insights with an advanced selector, and detailed keyword analysis to spot winners and wasted spend. Track investment, clicks and results in real time using the Catchr connector, with all Microsoft Ads metrics and dimensions available. Use it to gauge account health, compare campaigns, and refine keyword strategy fast.
Free
Microsoft Ads - Overview cover image
Microsoft Ads - Overview

Microsoft Ads dashboard for Looker Studio tracking core KPIs with campaign, audience, and creative breakdowns.

Microsoft Ads performance template for Looker Studio focused on the KPIs that drive paid search results. Monitor impressions, clicks, spend, CPC/CPA, conversions, and ROAS with an overview plus dedicated pages for views, clicks, and results. Compare performance by campaign, audience, and creatives to spot wasted spend and scale winning assets. Ideal for optimizing budgets, bids, and messaging across Microsoft Ads.
Free
Template Matomo - Visits Behaviours Acquisition cover image
Template Matomo - Visits Behaviours Acquisition

Matomo Looker Studio template to analyze visitors, behavior, and acquisition with key traffic and engagement metrics.

Matomo website analytics template for Looker Studio focused on Visitors, Behaviour, and Acquisition. Track visits, unique and new/returning visitors, bounce rate, actions per visit, trends by day and hour, and geo distribution. Surface high- and low-performing pages and engagement patterns to prioritize fixes and opportunities. Understand which traffic sources drive growth and share insights with your team. Powered by a no‑code Matomo connector for live data updates.
Free
Web Analytics dashboard cover image
Web Analytics dashboard

Web analytics Looker Studio template tracking traffic, key events, channels, and trends with tabs for acquisition, audience, and conversions.

Looker Studio web analytics template focused on monitoring website traffic and engagement. Covers recent daily traffic, key events, and traffic by channels, plus weekly and monthly trend panels for the last 6–12 months. Sidebar sections for Acquisition, Behavior & Audience, and Conversions guide deeper analysis of marketing performance and user behavior. Designed for quick readouts and trend tracking for teams that need actionable visibility into web performance.
Free
Google Ads Template cover image
Google Ads Template

Google Ads performance dashboard covering key KPIs, trends, and breakdowns by campaign, keyword, audience, and country.

Google Ads reporting template focused on marketing performance and spend efficiency. Track core KPIs—cost, impressions, clicks, CTR, CPC, conversions, and CPA—with clear trend lines and headline metrics. Analyze performance by campaign, ad, keyword, audience, and country to pinpoint winners and wasted spend. Built for marketers and agencies managing multiple accounts who need fast insights for budget and optimization decisions.
Free
Google Ads Performance Gap Analysis cover image
Google Ads Performance Gap Analysis

Google Ads gap analysis to track impression share, estimate lost opportunities, and compare performance versus the previous period.

Google Ads Performance Gap Analysis focused on uncovering missed opportunities and where campaigns are falling short. Highlights impression share trends and estimated lost metrics to reveal wasted reach and periods of underperformance. Compares opportunity loss versus the previous period to quickly spot declines and prioritize fixes. Ideal for PPC teams that need to diagnose gaps and redirect budget and bids for higher impact.
Free
Facebook Ads Overview Report cover image
Facebook Ads Overview Report

Facebook Ads overview with campaign, audience, device, and country breakdowns to highlight what drives results and where to optimize spend.

Track Facebook Ads performance across impressions, clicks, actions, conversions, and cost. See top campaigns ranked by spend, clicks, conversions, purchases, cost per conversion, and cost per purchase. Break down results by campaign objective, age, gender, device (with spend, clicks, and link CTR), and country-level conversions. Pinpoint high‑performing audiences and placements to reallocate budget and improve ROI.
Free
Shopify Overview Report cover image
Shopify Overview Report

Shopify overview tracking sales, orders, customer mix, top products, and net sales by country with time-based comparisons.

Shopify performance overview focused on revenue and customer trends across time. Highlights gross sales, orders confirmed, and new vs returning customers with clear trend lines and period comparisons. Ranks top products by sales and quantity with prices to surface best‑sellers. Maps net sales by country to pinpoint regional opportunities.
Free
Searchmetrics Historic Organic Rankings report cover image
Searchmetrics Historic Organic Rankings report

Track Searchmetrics historic organic rankings, visibility, and keyword/page performance in one view.

SEO reporting template for Searchmetrics data that highlights historic organic rankings and visibility trends. Surfaces keyword position distribution, keyword performance, and page-level performance to pinpoint winners, decliners, and opportunities. Helps evaluate the impact of updates over time and connect ranking shifts to traffic outcomes. Ideal for monitoring visibility growth and prioritizing keywords and pages that can move the needle.
Free
Pinterest ads - Accounts and Ad Performance cover image
Pinterest ads - Accounts and Ad Performance

All-in-one Pinterest Ads performance dashboard with account, geo, video, and ad-level insights across spend, CTR/CPM, engagements, and conversions.

Track Pinterest Ads across accounts and ads with key KPIs like spend, impressions, clicks, CTR, CPM, CPC, CPE, and engagements. Compare paid vs. earned results for clicks, saves, engagements, and outbound clicks to pinpoint efficiency gains. Analyze performance by country to see where campaigns are strongest. Measure video impact with starts and views, split by paid and earned. Review ad-level details—names, status, creation date, spend, and conversions—to scale what works and cut what doesn’t.
Free
Google Trends overview dashboard cover image
Google Trends overview dashboard

Google Trends template to analyze search term popularity by country and over time for SEO and marketing insights.

Google Trends Overview focuses on measuring interest for any search term across countries and time periods. Reveal where demand is strongest, how popularity changes, and when seasonal spikes occur. Identify high‑potential markets, validate content topics, and track brand or product momentum. Turn search interest patterns into actions for SEO, campaign timing, and market expansion.
Free
SEO Serp tracking report template cover image
SEO Serp tracking report template

Track keyword rankings, CTR, clicks, impressions, and average position from Google Search Console to find SEO wins and opportunities.

SEO SERP tracking template focused on Google Search Console data to monitor keyword rankings, CTR, clicks, impressions, and average position. Highlights top-performing queries and pages and surfaces opportunities where rankings or CTR are slipping. Compares performance across countries and devices to understand where organic visibility is growing or lagging. Trend views help validate SEO wins, prioritize content updates, and guide roadmap decisions. Ideal for SEO teams and agencies who need clear, client-ready insights from Search Console.
Free
Daily Marketing Efficiency Attribution Disparity - GA4 Google Ads cover image
Daily Marketing Efficiency Attribution Disparity - GA4 Google Ads

GA4 + Google Ads ecommerce dashboard for revenue, cost, and ROI with daily trends and attribution disparity insights.

GA4 and Google Ads ecommerce performance tracker focused on revenue, cost, and ROI. Connects GA4 purchase events with ad spend to surface summary KPIs and daily cost vs. revenue trends. Highlights attribution disparity so teams can understand differences between GA4-reported revenue and ad platform costs. Includes notes on GA4 reporting delays versus instant Google Ads cost updates to set expectations.
Free
Google Analytics Behavior Overview cover image
Google Analytics Behavior Overview

Behavior overview for Google Analytics highlighting top pages, content groups, searches, events, and page load performance.

Google Analytics Behaviors Overview focused on what visitors view, search, and interact with on your site. See the most popular pages, page titles, and content groups to spot what attracts attention. Track on‑site search terms and event activity to learn user intent and engagement. Check performance with average page load time to catch UX issues that slow users down. Ideal for quick insights that guide content, navigation, and optimization decisions.
Free
Facebook Ads vs Google Ads vs LinkedIn Ads cover image
Facebook Ads vs Google Ads vs LinkedIn Ads

Compare Facebook, Google, and LinkedIn Ads performance with spend, impressions, clicks, conversions, and cost-efficiency metrics in one view.

Cross-channel PPC performance comparison for Facebook Ads, Google Ads, and LinkedIn Ads in one Looker Studio dashboard. Track spend, impressions, clicks, conversions, CPM, CPC, and cost per conversion with side-by-side scorecards. Compare cost and impressions across platforms using dedicated tables to identify the most efficient channel. View trends over time and a geo chart of clicks to spot high-performing regions. Built for paid media managers who need fast, actionable budget and channel decisions.
Free
X Organic Twitter Tweet Engagement cover image
X Organic Twitter Tweet Engagement

Measure X (Twitter) organic performance with engagement metrics and top‑tweet insights.

X (Twitter) Organic Tweet Engagements visualizes how your posts perform across key engagement metrics. Track impressions, clicks, engagement rate, likes, reposts/shares, and comments to understand audience response. See the top tweets by engagement rate to quickly spot what content resonates. Use the insights to refine publishing cadence, creative, and messaging for stronger reach and interactions.
Free
Twitter Ads report template cover image
Twitter Ads report template

Twitter Ads performance dashboard for Looker Studio with campaign and audience breakdowns across CTR, spend, conversions, and ROAS.

Twitter Ads performance template for Looker Studio that tracks clicks, impressions, spend, conversions, CTR, CPC, CPM, ROAS, and video engagement metrics. Compare campaigns, ad groups, ads, and audience segments to find what drives conversions and where budget is wasted. Surface trends in CPA and conversion rate to guide optimization. Built for PPC teams to communicate results and scale what works.
Free
Pinterest Ads reporting template cover image
Pinterest Ads reporting template

Pinterest Ads performance tracking with clicks, conversions, cost, weekly trends, and country insights.

Pinterest Ads performance template focused on the core campaign metrics: clicks, conversions, and cost. Visualizations include weekly performance trends and a country-level breakdown of clicks to identify high‑value markets. Helps marketers tie spend to outcomes and spot optimization opportunities quickly. Ideal for tracking efficiency and growth across Pinterest campaigns.
Free
Pinterest Organic reporting template cover image
Pinterest Organic reporting template

Pinterest organic analytics with key metrics and top Pin performance insights.

Pinterest Organic performance template focused on non‑paid Pinterest metrics. Track impressions, saves, clicks, and engagement over time to understand what content resonates. Surface top Pins by impressions to quickly spot high‑reach posts. Use insights to refine posting cadence, creative, and board strategy. Ideal for marketers and social teams managing Pinterest growth.
Free
Microsoft Ads Overview cover image
Microsoft Ads Overview

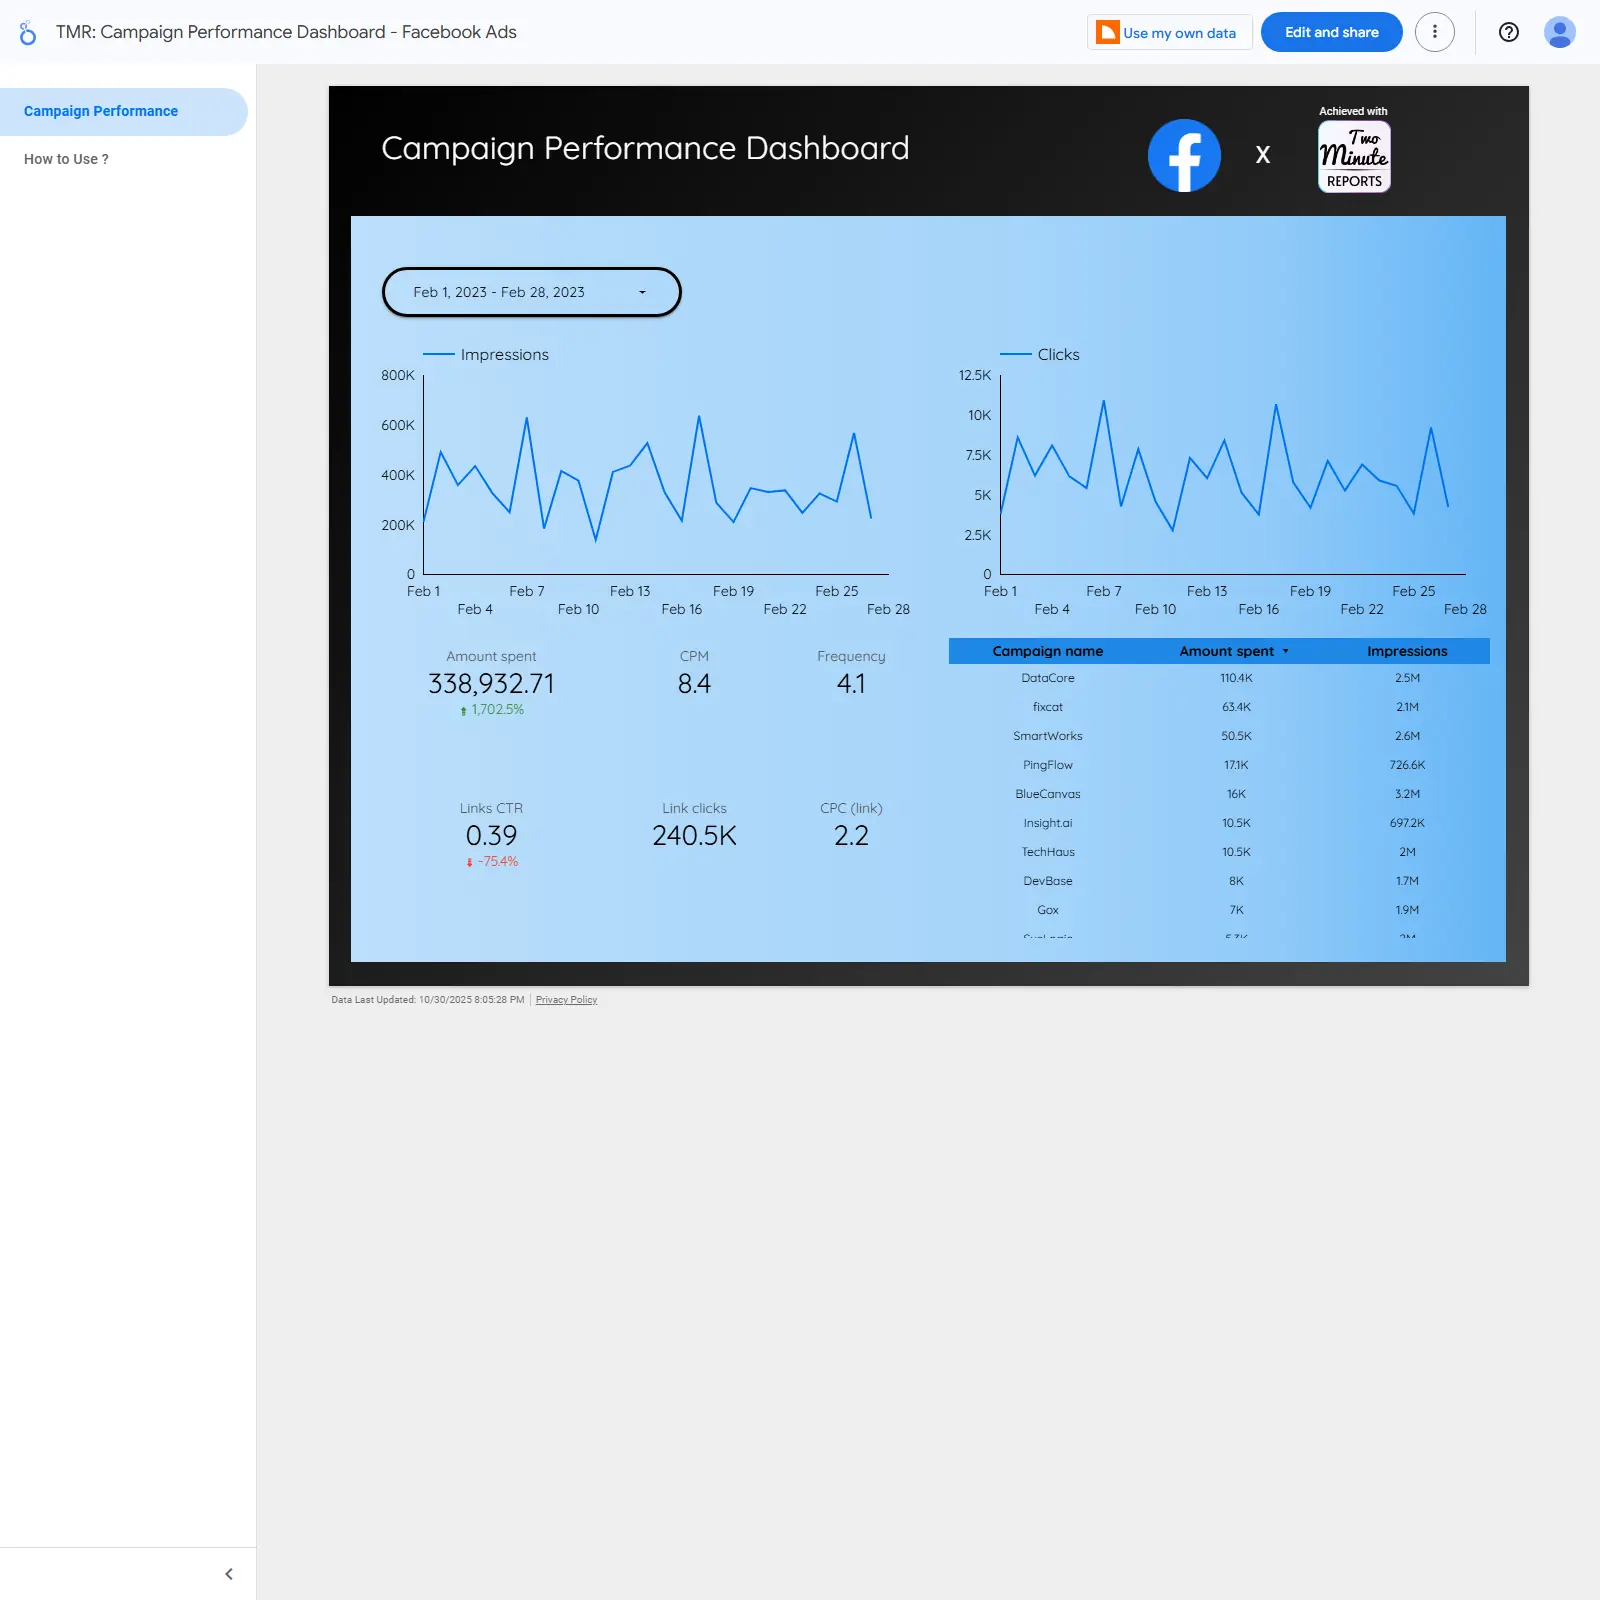
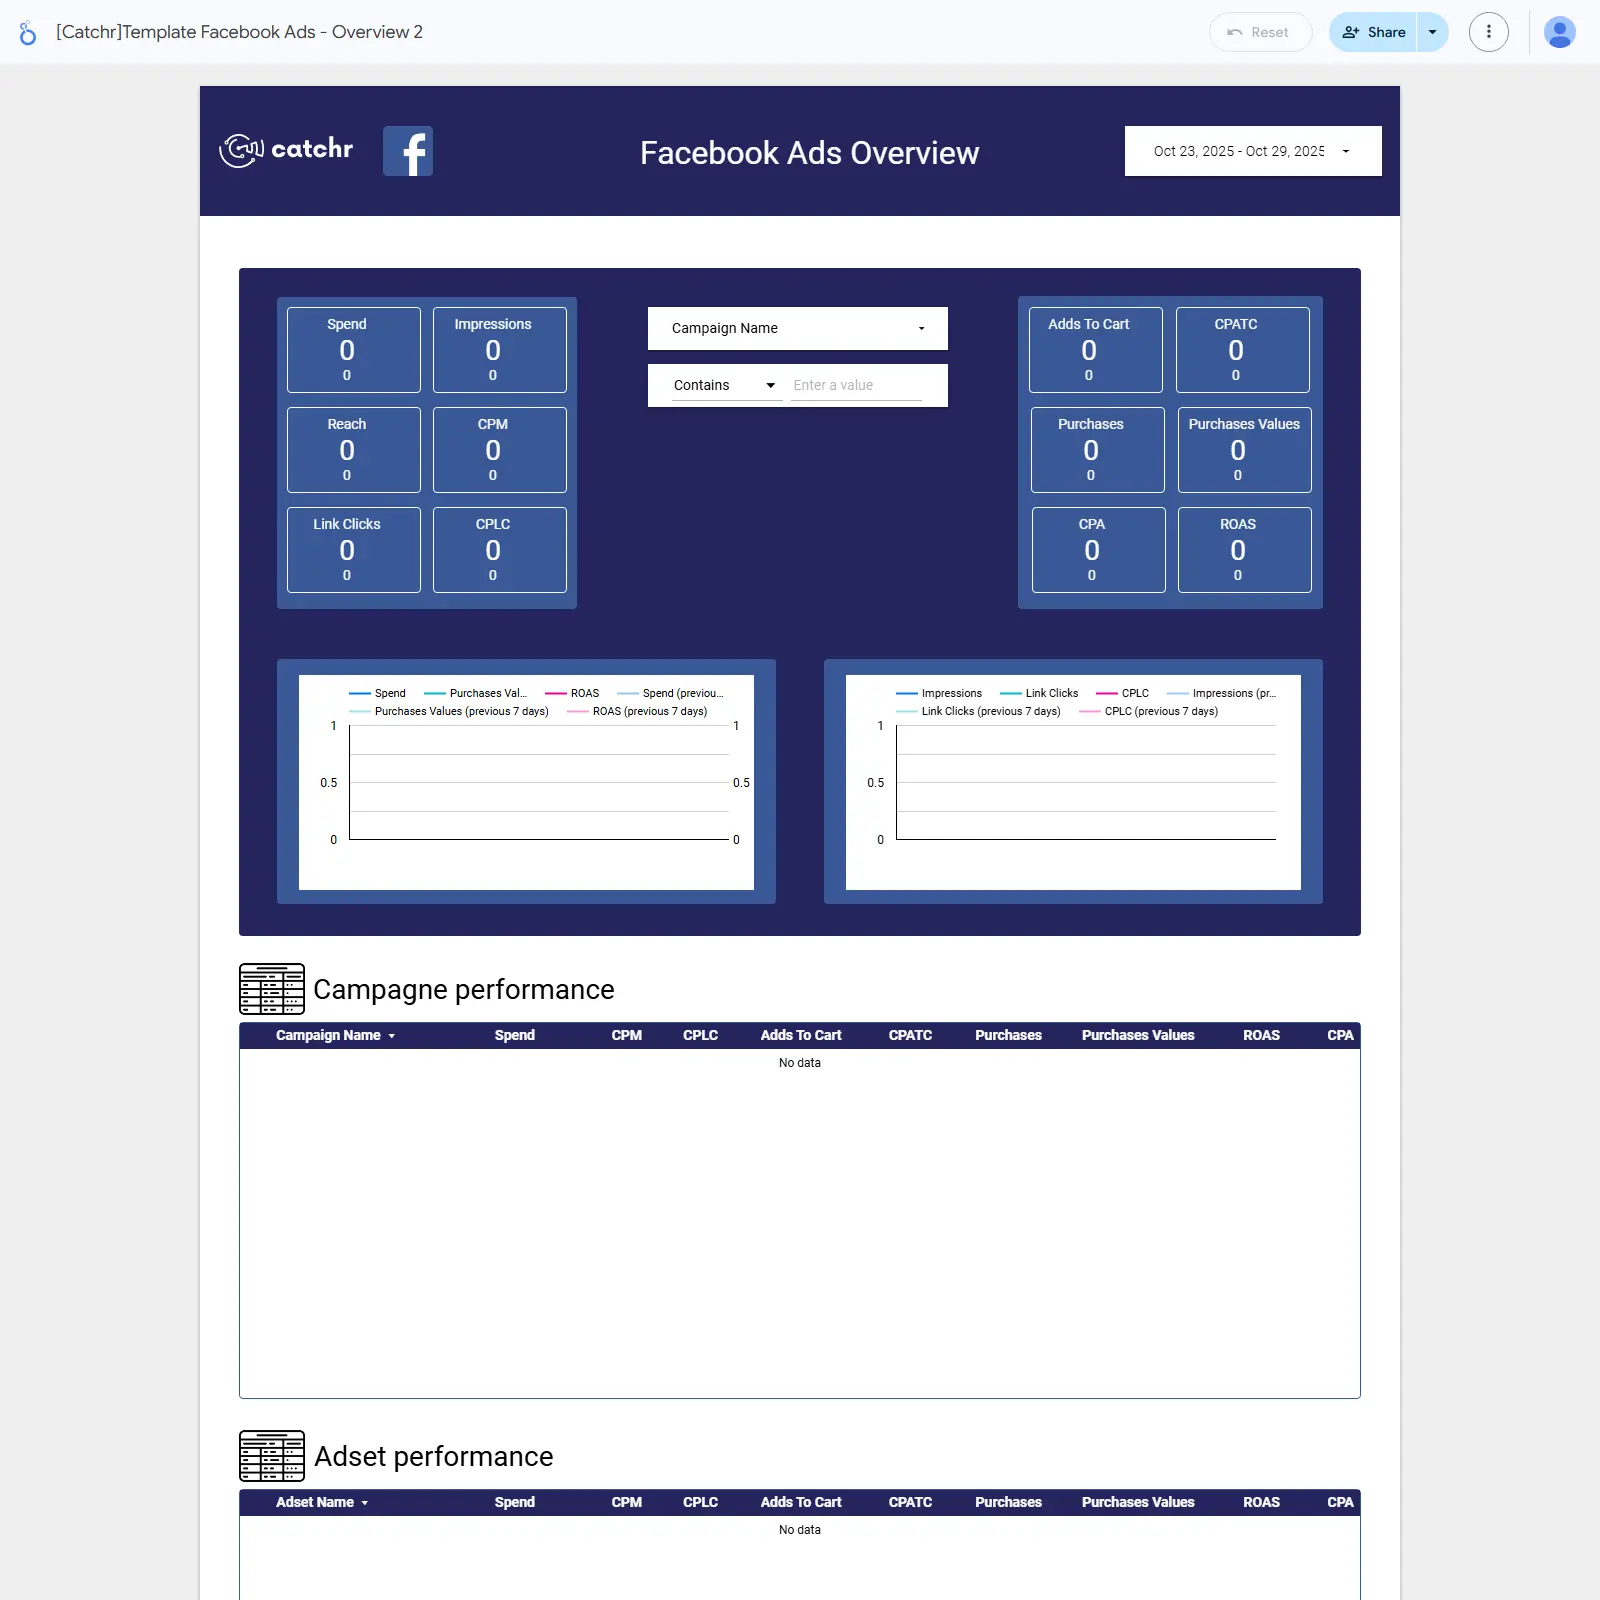
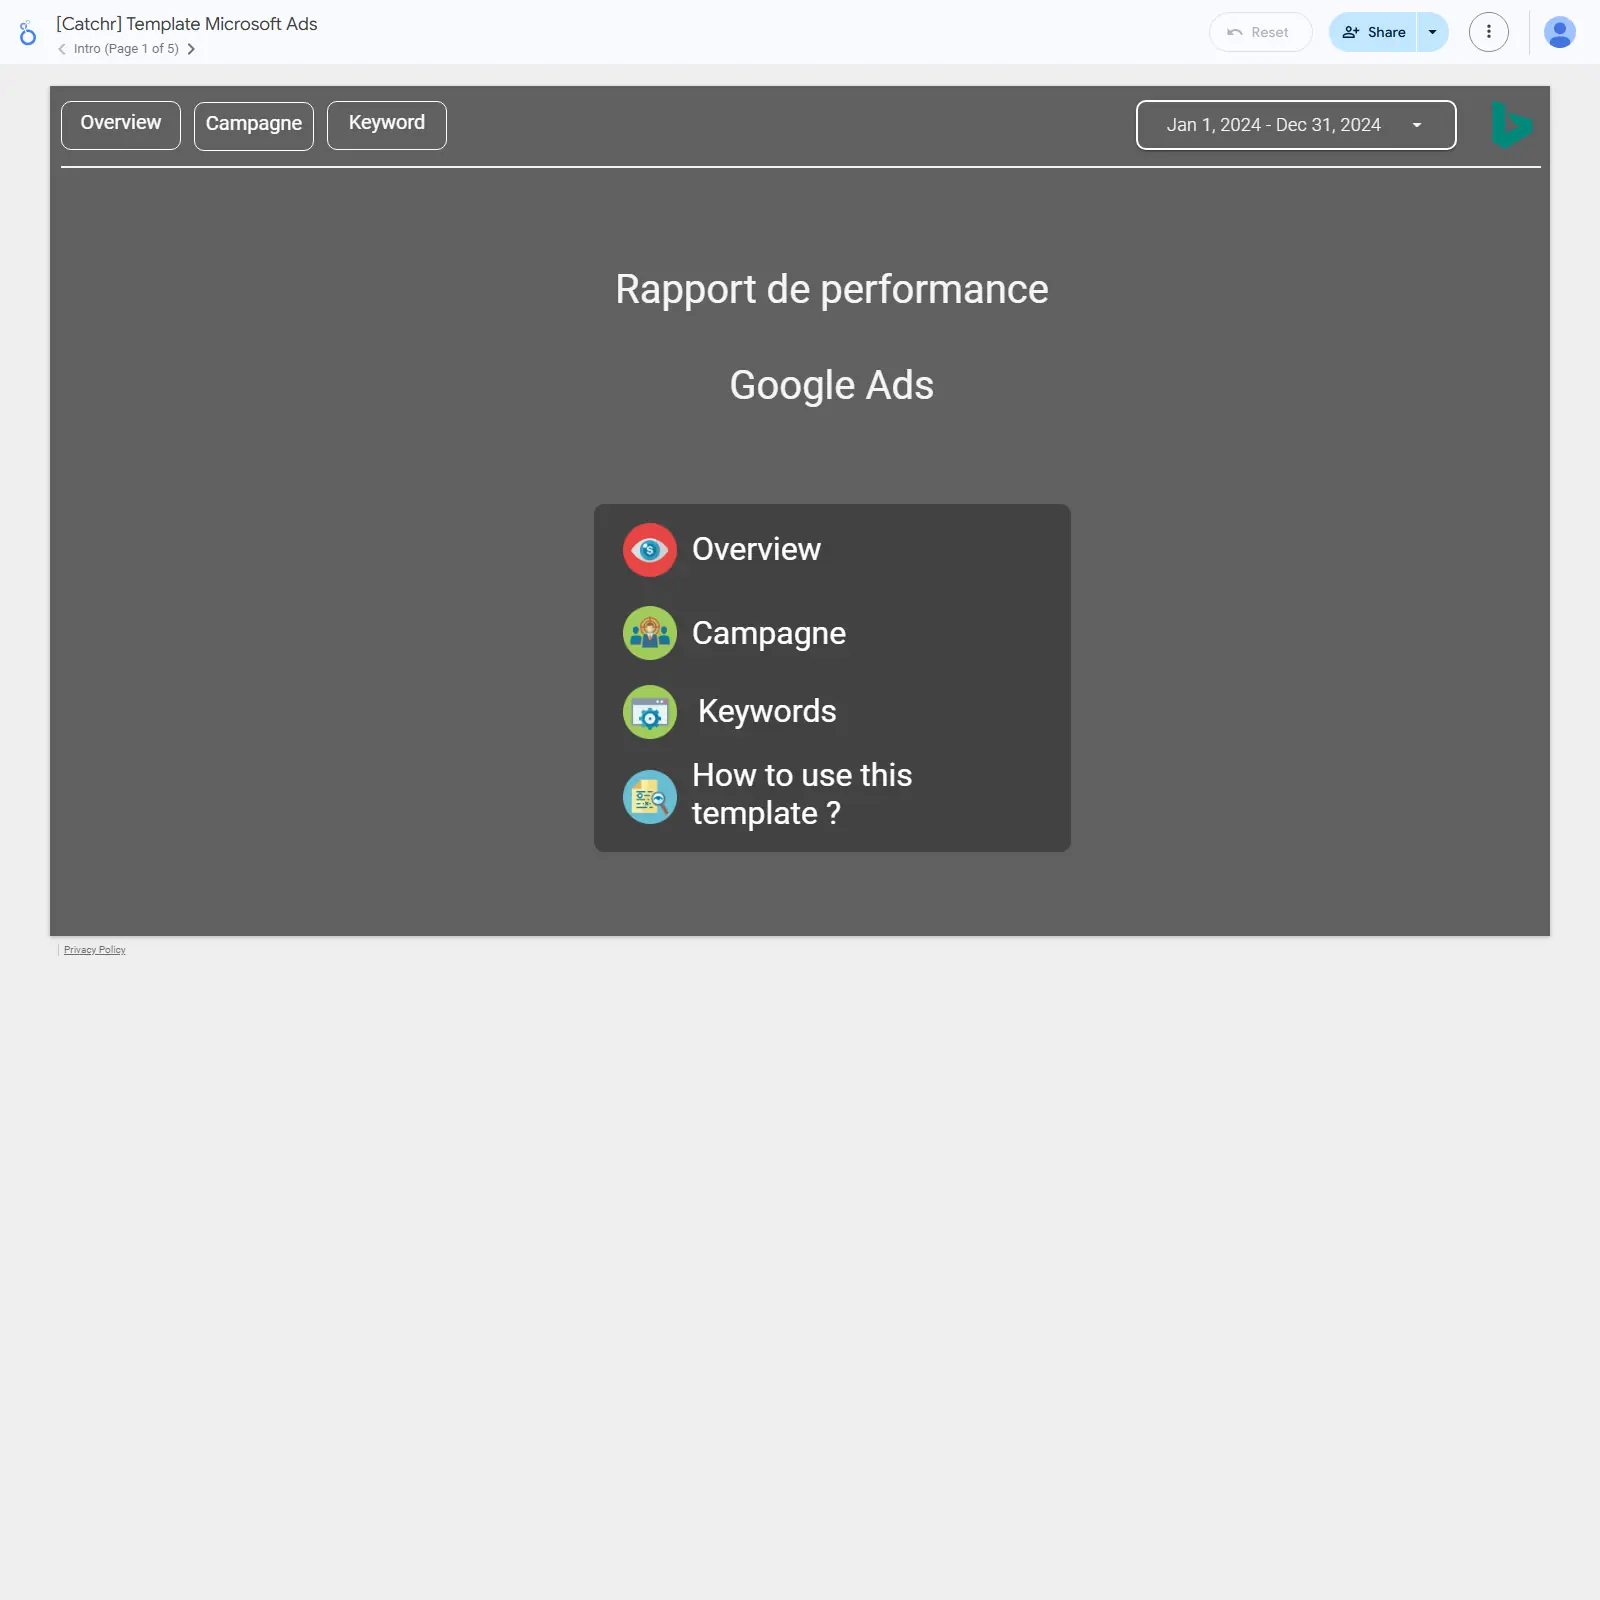
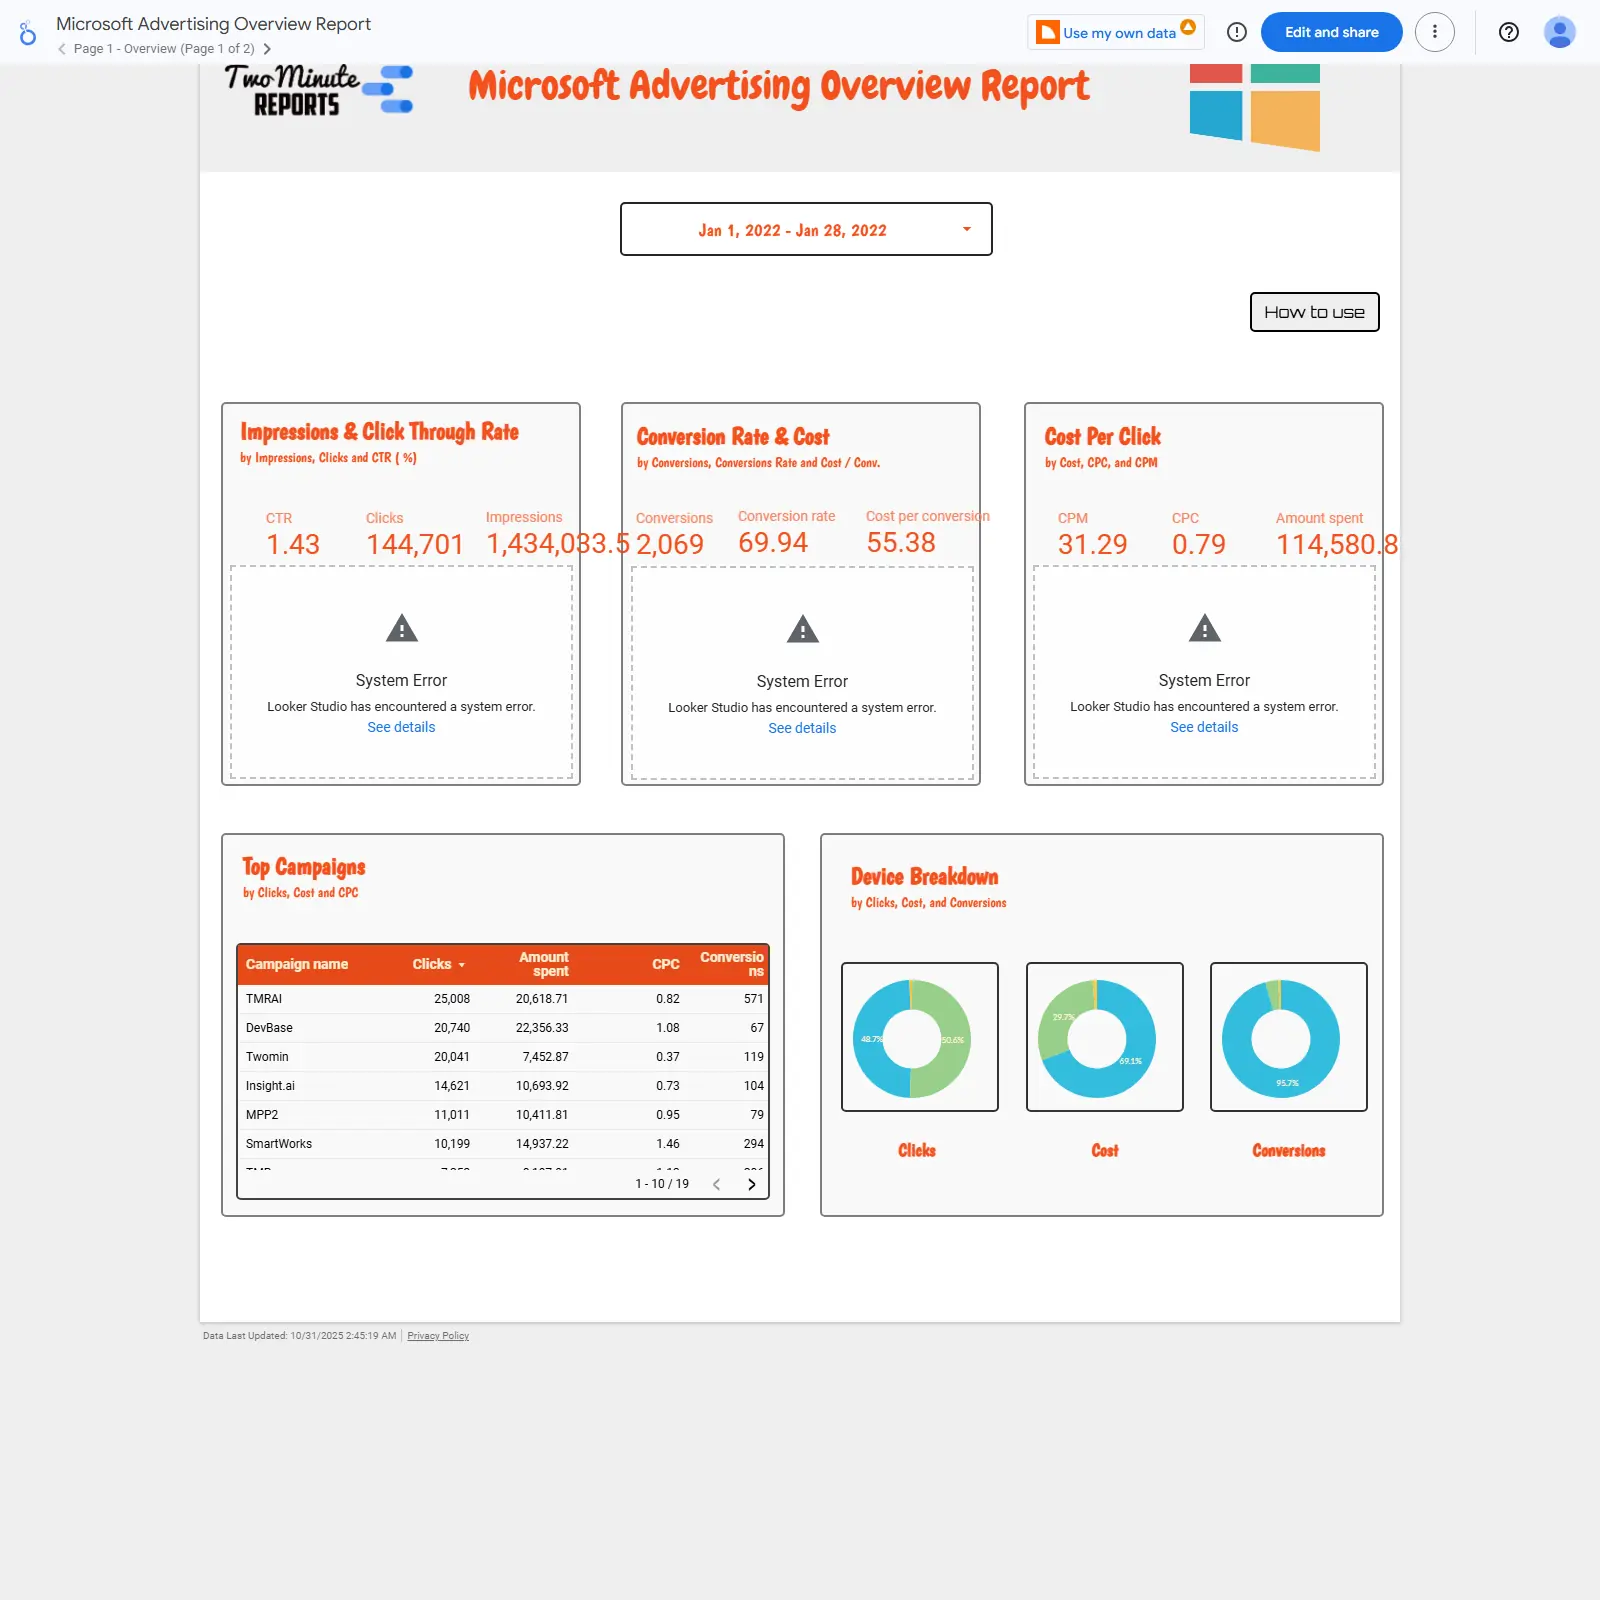
Microsoft/Bing Ads overview in Looker Studio with spend, CTR, CPC, conversions, top campaigns/ads, and device breakdowns.

Microsoft Ads performance overview for Looker Studio covering spend, CPM, CPC, impressions, clicks, CTR, conversions, conversion rate, and cost per conversion. Surfaces top campaigns and top ads ranked by clicks, cost, CPC, and conversions to spot winners and budget drains. Includes device-level breakdowns to compare clicks, cost, and conversions across desktop, mobile, and tablet. Built for PPC managers and marketers who need fast, at‑a‑glance insights to optimize Microsoft/Bing Ads.
Free
Microsoft Ads - Budget Template cover image
Microsoft Ads - Budget Template

One-page Microsoft Ads budget dashboard tracking spend, revenue, ROAS, and performance by time, distribution, campaign, and ad set.

Microsoft Ads budget dashboard for Looker Studio focused on tracking spend, revenue, and ROAS. Visualizes trends over time and by day of the week to spot pacing issues and performance patterns. Highlights distribution mix plus campaign and ad set contributions to cost and revenue. Helps reallocate budget quickly toward higher-ROI areas using clear, executive-ready views.
Free
LinkedIn Ads Performance Review cover image
LinkedIn Ads Performance Review

LinkedIn Ads lead-gen dashboard highlighting spend, clicks, leads, and engagement with campaign-level breakdowns.

Monitor LinkedIn Ads lead generation with a concise overview of spend, clicks, and leads. Assess account health and engagement/video performance to see how prospects interact with your ads. Compare results by campaign and campaign group to pinpoint top performers, wasted spend, and optimization opportunities. Clear KPIs and visuals keep teams aligned on what drives pipeline from LinkedIn.
Free
LinkedIn Ads Lead Generation cover image
LinkedIn Ads Lead Generation

One-page LinkedIn Ads dashboard for leads, CPL, and campaign performance.

One-page view for LinkedIn Ads lead generation focused on the metrics that matter. Measure total leads, cost per lead, and lead form results alongside a clean campaign overview to compare performance and spend efficiency. Quickly spot trends and outliers to reallocate budget and scale what works. Ideal for weekly debriefs and client reporting across LinkedIn campaigns.
Free
All-in-one social media analytics dashboard cover image
All-in-one social media analytics dashboard

Monthly GA4 + social media overview across Facebook, Instagram, LinkedIn, and YouTube with total users and revenue.

Social media performance snapshot tying GA4 organic metrics with key social channels. Track last month’s impact across Facebook, Instagram, LinkedIn, and YouTube while monitoring total users and revenue from GA4. Compare which networks drive traffic and conversions and quickly spot winners to scale. Built for marketers and decision‑makers who need a single view of social outcomes connected to website results.
Free
Instagram Insights Dashboard cover image
Instagram Insights Dashboard

Single-page Instagram Insights dashboard covering profile KPIs, trends, audience demographics, countries, and device breakdowns.

Single-page Instagram Insights dashboard for Looker Studio to monitor account performance at a glance. Tracks core KPIs like impressions, reach, profile views, likes, comments, followers, and engagement. Visualizes reach and impressions by date to spot momentum and content impact. Breaks down audience with followers by age and gender plus country-level distribution. Includes device-category impressions to guide creative and posting optimizations.
Free
Instagram - Post Insight cover image
Instagram - Post Insight

Instagram post analytics focusing on impressions, reach, engagement, media type performance, audience demographics, and follower growth.

Instagram Post Insight surfaces post-level metrics like impressions, reach, and engagement to show what content resonates. Compare media types—images, carousels, and Reels—to see which formats drive the most visibility and interactions. Track audience details by gender and age and monitor follower growth over time. Highlight top-performing posts and spot trends to refine creative and publishing strategy. Built for social teams and marketers who need quick, actionable Instagram insights.
Free
Site Search Queries Performance Dashboard cover image
Site Search Queries Performance Dashboard

GA4-powered dashboard for analyzing on‑site search queries and the pages that drive search usage.

Track on‑site search behavior with GA4 data to reveal what visitors are trying to find and how often. Surface top search terms, trends, and zero‑result risks to expose content gaps and navigation issues. Pinpoint landing pages that lead users to search so you can prioritize fixes and new content. Turn search demand into actions that improve findability and conversions.
Free
Google Ads Overview Dashboard cover image
Google Ads Overview Dashboard

Google Ads overview with campaign and keyword analysis, including budget vs. spend and conversion-focused KPIs.

Google Ads performance at a glance with scorecards for impressions, CPC, clicks, cost, and conversions plus trend lines for configured budget and actual spend. Dig into campaigns with a table covering status, channel type, cost, impressions, interactions, interaction rate, budget delivery, conversions, and a budget column chart. Compare click distribution by campaign with an easy pie chart. Evaluate keywords with currency, bidding strategy, impressions, interactions, interaction rate, budget delivery, conversions, cost, and number of associated campaigns to spot waste and growth opportunities.
Free
Google Ad Manager reporting template cover image
Google Ad Manager reporting template

Monitor Google Ad Manager clicks, revenue, top ads, and country trends to optimize ad yield.

Looker Studio template for Google Ad Manager focusing on clicks, cost, revenue, top ads, and country performance. Identify which creatives and placements drive engagement and monetize best. Compare geographies to uncover growth opportunities and track ad yield over time. Ideal for publishers and ad ops teams that need clear, revenue-focused insights from Ad Manager data.
Free