Author: coupler

The best free & paid Looker Studio templates, curated and quality-ranked for data reporting.

Clear All

Showing 1 - 3 of 3

Customer acquisition dashboard for Pipedrive cover image
Customer acquisition dashboard for Pipedrive

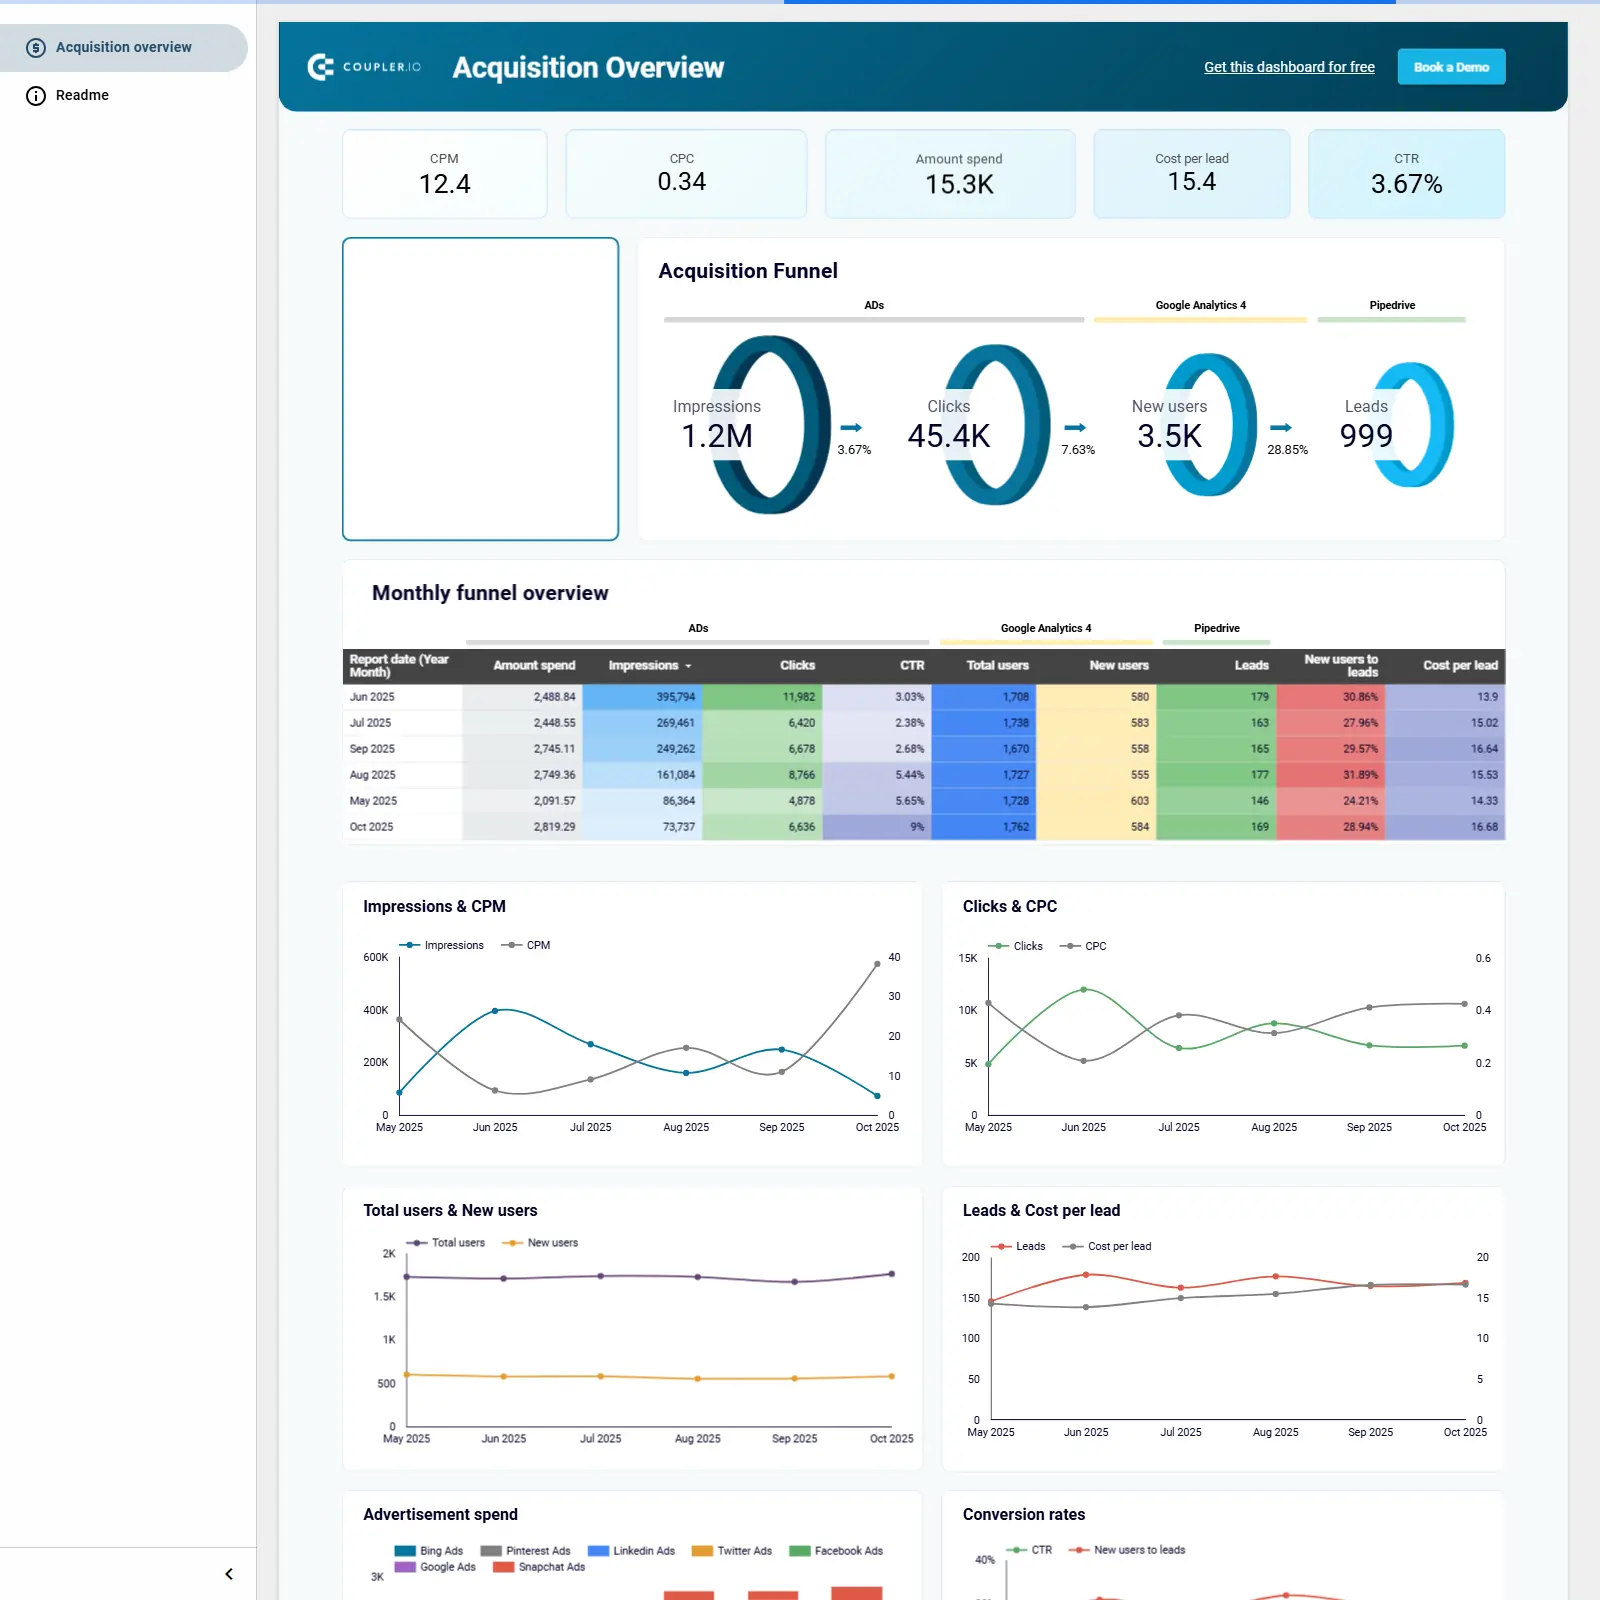
Full-funnel acquisition dashboard connecting ads, GA4, and CRM to track spend, conversions, and cost per lead across channels.

Marketing acquisition dashboard that unifies ad spend and funnel metrics across channels with GA4 and Pipedrive, mapping the journey from impressions to leads. Track CPM, CPC, CTR, amount spent, cost per lead, impressions, clicks, new users, and leads with a monthly funnel view and trend charts. Compare channels like Google Ads, Facebook, LinkedIn, Bing, Pinterest, and Twitter to see which sources drive users and qualified leads. Monitor conversion rates and cost efficiency to guide budget allocation and campaign optimization. Built for growth, performance marketing, and sales teams needing end‑to‑end acquisition visibility.
Free
Sales KPI dashboard for Pipedrive cover image
Sales KPI dashboard for Pipedrive

Comprehensive sales overview for revenue, win rate, losses, and rep performance with deal-level insights.

Sales performance template focused on revenue growth, win rate, and pipeline health. Tracks closed amount, closed deals, average deal size, close rate, median sales cycle, and lost value. Highlights trends in closed vs. lost value, top closed and top lost deals, and loss reasons such as budget constraints or pricing. Compares rep results with best and worst owners by close amount to pinpoint coaching opportunities. Includes dedicated views for sales pipeline and team performance for a complete CRM snapshot.
Free
CRM dashboard for Pipedrive cover image
CRM dashboard for Pipedrive

Pipedrive CRM template for monitoring pipeline health, conversion rates, revenue trends, and rep performance.

Pipedrive CRM template focused on revenue and pipeline performance across teams and deal labels. Tracks essentials like total sales, win rate, close rate, average days to close, pipeline value, open deals, weighted pipeline, and deal age. Includes time‑series for closed and projected value, stacked pipelines by agent and label, and a monthly deal stage breakdown to spot bottlenecks. Highlights top vs. underperforming reps to guide coaching, forecasting, and prioritization.
Free