Author: coupler

The best free & paid Looker Studio templates, curated and quality-ranked for data reporting.

Clear All

Showing 1 - 40 of 68

HubSpot customer acquisition dashboard cover image
HubSpot customer acquisition dashboard

Cross‑channel HubSpot acquisition dashboard tracking funnel performance, CAC, and channel ROI by month and region.

Customer acquisition template focused on HubSpot that blends ad platforms and GA4 data to map the full path from impressions to customers. Tracks cost metrics like CPM, CPC, cost per lead, cost per SQL, and customer acquisition cost, alongside funnel counts for impressions, clicks, new users, leads, SQLs, and customers. Highlights performance by month and country to spot trends, budget waste, and expansion opportunities. Adds lifecycle-stage reporting from HubSpot to gauge lead quality and pipeline progress, enabling smarter channel and campaign decisions.
Free
Customer acquisition dashboard for Pipedrive cover image
Customer acquisition dashboard for Pipedrive

Full-funnel acquisition dashboard connecting ads, GA4, and CRM to track spend, conversions, and cost per lead across channels.

Marketing acquisition dashboard that unifies ad spend and funnel metrics across channels with GA4 and Pipedrive, mapping the journey from impressions to leads. Track CPM, CPC, CTR, amount spent, cost per lead, impressions, clicks, new users, and leads with a monthly funnel view and trend charts. Compare channels like Google Ads, Facebook, LinkedIn, Bing, Pinterest, and Twitter to see which sources drive users and qualified leads. Monitor conversion rates and cost efficiency to guide budget allocation and campaign optimization. Built for growth, performance marketing, and sales teams needing end‑to‑end acquisition visibility.
Free
Sales KPI dashboard for Pipedrive cover image
Sales KPI dashboard for Pipedrive

Comprehensive sales overview for revenue, win rate, losses, and rep performance with deal-level insights.

Sales performance template focused on revenue growth, win rate, and pipeline health. Tracks closed amount, closed deals, average deal size, close rate, median sales cycle, and lost value. Highlights trends in closed vs. lost value, top closed and top lost deals, and loss reasons such as budget constraints or pricing. Compares rep results with best and worst owners by close amount to pinpoint coaching opportunities. Includes dedicated views for sales pipeline and team performance for a complete CRM snapshot.
Free
Google Business Profile dashboard cover image
Google Business Profile dashboard

Google Business Profile analytics template to track ratings, reviews, calls, clicks, keywords, and search/maps impressions for stronger local SEO and customer experience.

Google Business Profile Looker Studio template for monitoring local search performance across locations. Track ratings, reviews, phone calls, website clicks, interactions, and total, search, and Google Maps impressions with clear trend visuals. Uncover top keywords that drive discovery and see how engagement shifts over time. Compare locations by rating to prioritize fixes and amplify what works. Turn customer sentiment and interaction patterns into actions that boost visibility and conversions.
Free
Facebook Ads purchases breakdown dashboard cover image
Facebook Ads purchases breakdown dashboard

Facebook Ads analytics dashboards with funnel, ROAS, and creative insights to optimize spend and growth.

Facebook Ads performance dashboards that consolidate Ads Manager data to track spend, impressions, reach, clicks, CTR, CPC/CPM, purchases, and ROAS. Funnel views map the journey from impression to purchase to spot drop‑offs and true cost per purchase. Creative and audience breakdowns surface winning assets and segments, while a frequency meter helps avoid ad fatigue. Variants for ecommerce, lead‑gen, apps, and brand awareness highlight the KPIs that matter to each goal so you can reallocate budget with confidence.
Free
TikTok Ads dashboard cover image
TikTok Ads dashboard

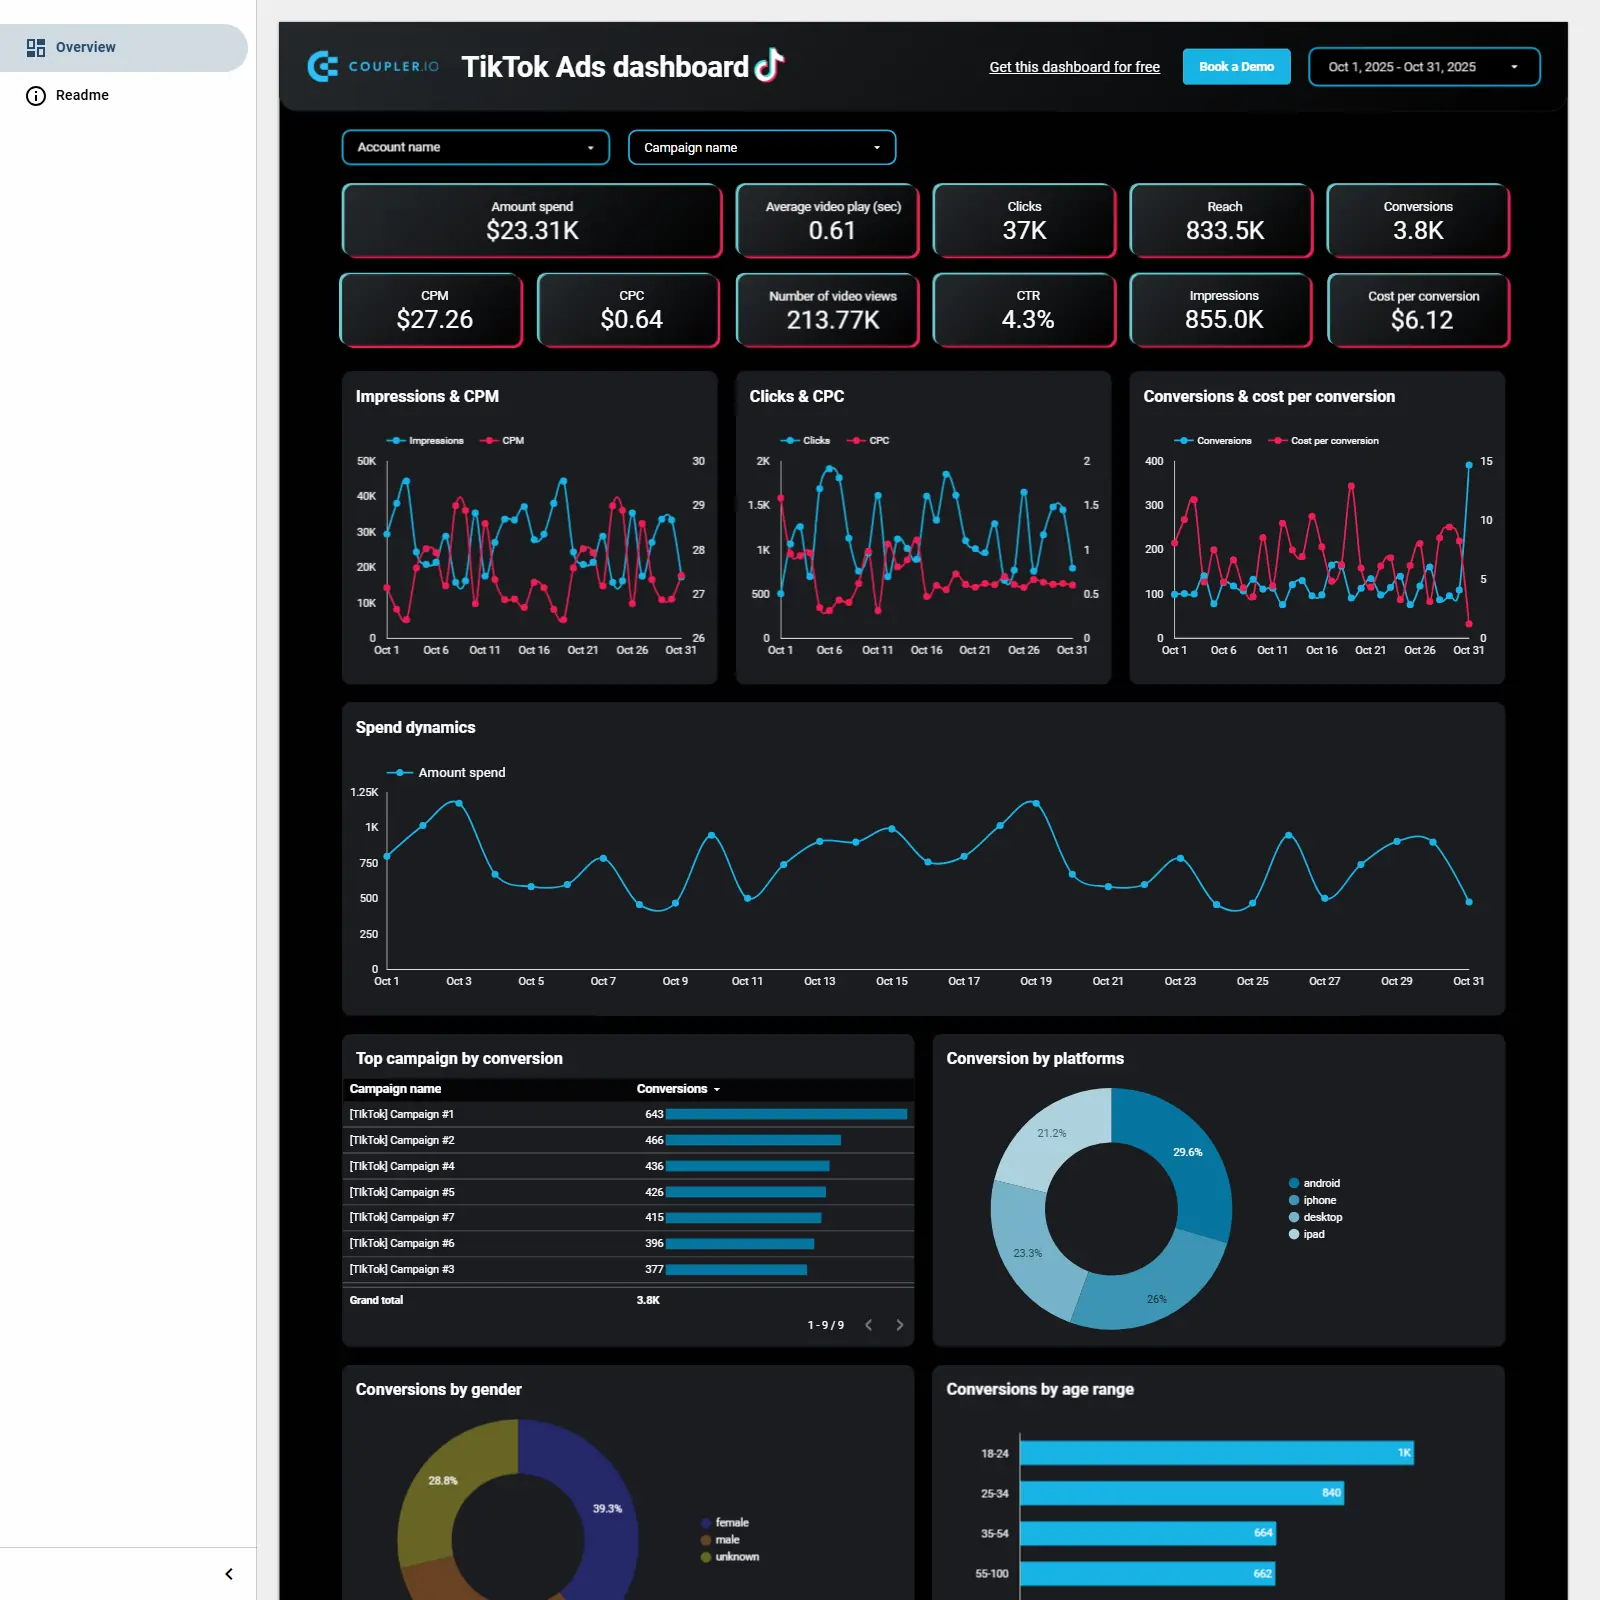
Comprehensive TikTok Ads analytics with spend, efficiency, conversions, and audience breakdowns for campaign optimization.

TikTok Ads performance tracking focused on spend, efficiency, and outcomes across campaigns. Key KPIs include amount spent, CPM, CPC, CTR, clicks, reach, impressions, video views, average video play time, conversions, and cost per conversion. Trend visuals map impressions vs. CPM, clicks vs. CPC, conversions vs. cost per conversion, and daily spend dynamics to spot spikes and inefficiencies. Breakdown views highlight top campaigns by conversions and conversion distribution by platform (Android, iPhone, desktop, iPad), gender, and age range for audience insights. Built for quick optimization of budgets, creatives, and targeting on TikTok.
Free
CRM dashboard for HubSpot cover image
CRM dashboard for HubSpot

HubSpot CRM dashboard to monitor pipeline health, revenue trends, deal stages, sources, and rep performance.

HubSpot CRM sales dashboard template for Looker Studio focused on pipeline performance and revenue. Track closed amount, close rate, average days to close, open deals, pipeline value, projected revenue, and deal age over time. Visualize trends for won deals and revenue, compare pipelines by agents and deal types, and audit stage progression month over month. Analyze deal sources and an agent leaderboard to surface top performers and bottlenecks. Ideal for sales leaders and RevOps teams to improve forecasting and execution.
Free
Google Search Console Technical SEO dashboard cover image
Google Search Console Technical SEO dashboard

Technical SEO dashboard for Looker Studio using Google Search Console to spot indexing, crawl, and status‑code issues fast.

Technical SEO monitoring built on Google Search Console data for Looker Studio. Surfaces URL health, redirects and errors (3xx/4xx), robots.txt status, fetch states, and index coverage with indexing verdicts to pinpoint blockers. Highlights indexed vs. non‑indexed pages and crawl issues so you can prioritize fixes and protect search visibility. Ideal for ongoing site health tracking and fast diagnosis of pages that need attention.
Free
Multi-channel creatives performance dashboard cover image
Multi-channel creatives performance dashboard

Track and compare ad creative performance and costs across Google, Meta, LinkedIn, Bing, and TikTok.

Multi‑channel advertising dashboard focused on evaluating creative performance across Google, Meta, LinkedIn, Bing, and TikTok. Tracks spend, impressions, clicks, CTR, CPC, CPM, and video views with campaign, ad group, and ad‑level detail. Highlights trends over time and compares cost and engagement by source to spot winners and wasted spend. Ideal for optimizing budgets and scaling the best performing creatives across platforms.
Free
X Twitter Ads dashboard cover image
X Twitter Ads dashboard

Automated X (Twitter) Ads dashboard to track spend, CTR, CPC, conversions, and funnel performance with platform/device insights and top campaigns.

X (Twitter) Ads dashboard focused on end‑to‑end campaign performance: spend, CPM, CPC, CTR, conversions, cost per conversion, engagement, and follower growth. Visualizes the funnel from impressions to purchases with trend lines for impressions, clicks, conversions, and spend dynamics. Highlights top campaigns by conversions and surfaces placement and device insights to compare Twitter versus the Publisher Network. Built for automated reporting via Coupler.io data feeds so marketers can spot bottlenecks, reallocate budget, and improve ROI.
Free
TikTok analytics dashboard cover image
TikTok analytics dashboard

TikTok Organic dashboard that maps your engagement funnel, best videos, audience makeup, and growth drivers.

TikTok Organic analytics template for tracking the full content lifecycle—views, likes, comments, shares, watch time, and engagement rates. Visualizes the engagement funnel and timeline trends, with clear links between posting activity, profile views, and follower growth. Ranks best-performing videos to uncover themes, formats, and posting times that drive results. Highlights audience demographics and top countries, plus your most active days to refine scheduling and targeting. Ideal for creators, brands, and agencies optimizing organic TikTok strategy with actionable insights.
Free
Shopify orders dashboard cover image
Shopify orders dashboard

Unified Shopify analytics in Looker Studio covering orders, inventory, marketing attribution, and customer insights.

Shopify dashboard templates by Coupler.io bring orders, inventory, marketing, and customer data into Looker Studio for clear, real-time ecommerce tracking. Monitor orders, total sales, average order value, discounts, tax, returns, customers, and processing time, with breakdowns by traffic source and shipping country. Connect Shopify with GA4 and ad platforms to link spend to conversions and ROI, uncover funnel drop‑offs, and optimize budget allocation. Use SKU‑level insights like days of stock remaining to prevent stockouts and plan procurement with confidence. Ideal for store owners and marketers who need a consolidated view of performance and growth levers.
Free
Shopify marketing funnel dashboard cover image
Shopify marketing funnel dashboard

Cross‑channel marketing funnel template that tracks acquisition from impressions to revenue to surface bottlenecks and scale top‑performing channels.

Cross‑channel marketing funnel template that unifies ads, web analytics, ecommerce, and email data to map the path from first impression to purchase. It tracks spend, clicks, CTR, CPC/CPM, new users/customers, orders, total sales, ROI/ROAS, cost per order, and average order value with clear funnel stages. Weekly breakdowns and trend charts reveal drop‑offs between stages and highlight the campaigns and emails driving qualified leads and revenue. Ideal for optimizing budgets, improving product and checkout flow, and proving impact across Facebook Ads, Google Ads, GA4, Klaviyo/Mailchimp, and Shopify.
Free
Salesforce Win Loss analysis cover image
Salesforce Win Loss analysis

Salesforce win–loss analysis of amounts, deal counts, win rate, and segment performance over time.

Salesforce Win/Loss analysis focused on understanding which opportunities convert and which don’t. Tracks won and lost amount, number of opportunities, average deal size, and win/loss rates with monthly trends. Highlights performance by industry, owner, lead source, and country to expose strong segments and leakage points. Helps spot seasonality, monitor rep effectiveness, and target channels that bring higher‑value wins. Built for quick sales performance reviews and pipeline optimization.
Free
QuickBooks Accounts Payable dashboard cover image
QuickBooks Accounts Payable dashboard

Looker Studio template to monitor AP aging, top creditors, paid vs. unpaid bills, and bank balances from QuickBooks or Xero for better cash planning.

Accounts Payable analytics template for Looker Studio that centralizes bills, vendors, aging buckets, and cash balances—fed from QuickBooks or Xero via Coupler.io. Track unpaid and overdue amounts, including 30+ and 90+ day buckets, and surface top creditors to prioritize payments. Review paid bills by vendor across current month, last month, and year‑to‑date to spot payment patterns. See bank balances and currency breakdowns to match cash on hand with upcoming liabilities, and explore a 12‑month bill history to reduce late fees and improve cash flow.
Free
Accounts Receivable Dashboard for QuickBooks cover image
Accounts Receivable Dashboard for QuickBooks

Looker Studio template to track AR aging, top debtors, and paid vs unpaid trends for sharper collections and cash‑flow planning.

Accounts Receivable dashboard template for Looker Studio that centralizes invoice data from QuickBooks or Xero to monitor unpaid and overdue amounts. It highlights AR aging buckets, top debtors by customer, paid vs unpaid trends over the last 12 months, year‑to‑date paid amounts, and a detailed invoice table with due dates and currencies. Use it to prioritize collections, reduce DSO, and forecast cash flow by spotting seasonal payment patterns and at‑risk accounts. Ideal for finance teams needing a clear, up‑to‑date picture of receivables performance.
Free
LinkedIn Ads Overview cover image
LinkedIn Ads Overview

LinkedIn Ads Looker Studio template tracking cost, reach, engagement, and efficiency to compare campaigns and optimize spend.

Looker Studio template for monitoring LinkedIn Ads performance across campaigns. Covers impressions, clicks, landing page clicks, CTR, reach, frequency, spend, CPM, and CPC with trend visuals and a frequency gauge to prevent overexposure. Surfaces engagement outcomes like reactions, comments, shares, and engagement rate to gauge content resonance. A comparative campaign table highlights cost and efficiency to spot winners and wasted spend. Ideal for optimizing budgets and scaling effective LinkedIn campaigns.
Free
Google Analytics PPC dashboard cover image
Google Analytics PPC dashboard

GA4 PPC dashboard that shows spend, traffic, conversions, revenue, and ROAS across ad channels.

GA4-powered PPC analytics that ties ad performance to revenue in one place. Tracks core KPIs including users, sessions, engagement time, purchase rate, ecommerce purchases, revenue, impressions, clicks, CTR, CPC, spend, and ROAS. Clear trend visuals for traffic, ROAS, revenue vs. purchases, spend, and volume expose momentum and seasonality. Channel comparisons surface where conversions, costs, and returns are strongest. Ideal for optimizing budgets, focusing on profitable sources, and reducing wasted spend.
Free
Quality score analytics dashboard for Google Ads cover image
Quality score analytics dashboard for Google Ads

Google Ads Quality Score analytics to diagnose keywords, track weighted QS, and link impact to CTR, CPC, and spend.

Google Ads quality score analytics focused on keyword-level performance and optimization. Tracks historical quality score alongside CTR, CPC, and search impression share to reveal what drives visibility and cost. Includes impression-, click-, and cost‑weighted quality score metrics with clear guidance on when each matters for health, engagement, and budget efficiency. Highlights keyword distributions and components like landing page experience, ad relevance, and expected CTR to pinpoint where to improve. Built for finding quick wins that raise scores, lift CTR, and lower CPC.
Free
Ads and social media performance dashboard for Meta cover image
Ads and social media performance dashboard for Meta

Unified Facebook and Instagram ads + social analytics with KPIs, trends, geo insights, and post-level performance.

All-in-one Looker Studio template for tracking ads and social media across Facebook and Instagram. Monitor core KPIs—impressions, clicks, spend, CPM, CPC, and CTR—with clear time-series trends. Compare organic reach and paid performance, including spend and CPM/CPC changes. View country-level insights for ad impressions, page likes, and follower growth. Drill into post performance with likes, comments, and shares to find winning content and optimize budgets.
Free
Accounts Receivable Dashboard for Xero cover image
Accounts Receivable Dashboard for Xero

Accounts Receivable dashboard tracking unpaid and overdue invoices, AR aging, top customers, and monthly paid vs unpaid trends with invoice-level detail.

Accounts Receivable template focused on unpaid and overdue invoices, collections performance, and customer exposure. Key metrics include total unpaid balance, overdue amounts (30+ and 90+ days), and top customers by outstanding value. AR aging tables break down balances across current, 1–30, 31–60, 61–90, and 90+ day buckets with an invoice-level list of due dates and amounts. Visuals compare paid vs. unpaid by month and summarize the last 12 months of payments by customer. Ideal for finance teams to prioritize follow‑ups, reduce DSO, and forecast cash flow.
Free
CRM dashboard for Salesforce cover image
CRM dashboard for Salesforce

Salesforce CRM template for tracking pipeline, revenue, win rates, deal stages, lead sources, and owner performance.

Salesforce CRM dashboard template focused on pipeline health, revenue trends, and sales performance. Tracks core KPIs including total sales, pipeline value, win rate, close rate, average days to close, open deals, expected revenue, and deal age. Highlights deal stage progression and revenue by lead source to spot bottlenecks and channel impact. Compares trends such as closed amount vs won opportunities and expected revenue vs opportunities due. Surfaces best and worst-performing owners to guide coaching and resource allocation.
Free
YouTube KPIs dashboard cover image
YouTube KPIs dashboard

Looker Studio template to analyze YouTube performance, traffic sources, and subscriber growth.

YouTube KPIs template for Looker Studio focused on channel and video performance. Tracks core metrics like views, likes, dislikes, comments, shares, estimated minutes watched, average views per day, and average view duration. Highlights trends over time and the last 60 days, with breakouts for top videos, keywords, external referrers, and traffic sources. Adds geographic insights with views by country and a clear subscriber module for gains, losses, and net change. Built to quickly spot winning content and optimize promotion and audience growth.
Free
YouTube Channel Overview Dashboard cover image
YouTube Channel Overview Dashboard

A Looker Studio template for YouTube Analytics that tracks channel growth, audience insights, and video performance with automated refreshes.

Tracks YouTube channel KPIs like views, watch time, average view duration, new subscribers, likes/dislikes, comments, shares, CTR, and card teaser metrics to reveal what drives growth. Visualizes trends over time, highlights top and underperforming videos, and surfaces active publishing days to refine your content strategy. Breaks down audience segments and traffic sources to show who’s watching and where they come from. Refreshes automatically (up to every 15 minutes) via Coupler.io’s connector and supports exporting to Sheets, Excel, or BigQuery. Fully customizable and white‑label friendly for sharing insights with stakeholders.
Free
Google Search Console dashboard cover image
Google Search Console dashboard

Google Search Console SEO dashboard that tracks clicks, impressions, CTR, ranking trends, top pages, and device performance.

Looker Studio SEO dashboard for Google Search Console focused on the core metrics that drive organic growth: clicks, impressions, CTR, and average position with weekly and period trendlines. Surfaces the top 10 pages by clicks or impressions and flags best and worst performers so you know exactly where to double down or fix declines. Breaks down traffic by device to spot mobile vs. desktop gaps that impact visibility. Designed for marketers and SEO teams who want a fast, actionable read on page-level performance and search momentum.
Free
Landing page performance dashboard cover image
Landing page performance dashboard

Landing page analytics template combining Google Search Console and GA4 to compare SEO, engagement, and e‑commerce results across pages.

Landing page performance template for Looker Studio that blends Google Search Console and GA4 to reveal how each page attracts and converts traffic. Track SEO visibility with impressions, clicks, CTR, and average position, then connect it to engagement metrics like new users, sessions, session duration, bounce rate, and key events. Tie efforts to outcomes with e‑commerce purchases and purchase revenue. Compare pages side by side to surface top performers and quick-win opportunities for SEO, UX, and conversion improvements.
Free
PPC multi-channel dashboard cover image
PPC multi-channel dashboard

Cross‑channel PPC dashboard that consolidates ad metrics and spend to compare performance and guide budget decisions.

A multi‑channel PPC dashboard focused on consolidating ads data from Google Ads, Meta, LinkedIn, and other platforms to compare performance side by side. Tracks spend, impressions, clicks, CTR, CPC, conversions, and ROAS with time trends and breakdowns by source and campaign type. Highlights spend and CPC by date and source, impressions vs. clicks over time, and clicks by source to quickly spot winners and waste. Surfaces opportunities by evaluating keyword and creative effectiveness alongside metrics like search impression share and frequency. Guides smarter budget allocation and optimizations that lift ROI across platforms.
Free
Xero Accounts Payable dashboard cover image
Xero Accounts Payable dashboard

Accounts Payable dashboard for QuickBooks and Xero that tracks amounts due, aging, top vendors, paid bills, and bank balances to prioritize payments and manage cash.

Accounts Payable dashboard template for Looker Studio powered by Coupler.io centralizes billing and vendor data from QuickBooks and Xero. Track total amount due, overdue balances (30+ and 90+ days), and AP aging to gauge risk and payment timing. See unpaid bills by vendor, identify top creditors, and dive into detailed bill tables with due dates, currencies, and amounts. Review paid bills by vendor alongside bank balances, opening/closing balances, and cash received/spent to plan payouts. Prioritize payments, prevent delinquencies, and align cash on hand with upcoming obligations.
Free
Shopify store traffic overview dashboard cover image
Shopify store traffic overview dashboard

Shopify + GA4 funnel tracker covering traffic, conversions, customers, orders, and revenue trends.

Ecommerce performance template for Shopify that connects store sales with GA4 traffic to map the full funnel from sessions and views to add‑to‑carts, checkouts, and purchases. Highlights key KPIs like orders, total sales, average order value, and average items per order alongside total and new users. A monthly funnel table and trend charts reveal sales growth, customer acquisition, and conversion bottlenecks. Ideal for spotting what drives revenue and where shoppers drop off.
Free
Salesforce sales team performance dashboard cover image
Salesforce sales team performance dashboard

Salesforce sales performance template tracking win/loss, revenue, rep comparisons, and task efficiency.

Looker Studio template for analyzing Salesforce pipeline outcomes and team productivity. Visualizes won and lost opportunities, won/lost amounts, win rate, and reasons for lost deals by rep, opportunity type, size, and lead source. Highlights totals and trends to benchmark performance and spot revenue swings. Adds task analytics—open/closed tasks and median task age—to monitor throughput and remove bottlenecks. Ideal for sales leaders to prioritize coaching, refine tactics, and forecast more accurately.
Free
Quickbooks financial dashboard cover image
Quickbooks financial dashboard

QuickBooks finance dashboard covering P&L, balance sheet, cash flow, and bank balances with last‑month and MTD insights.

QuickBooks financial dashboard focused on profitability, liquidity, and overall financial health. Tracks profit and loss with last month and month‑to‑date earnings, plus charts for cash end‑of‑period and net cash changes. Summarizes the balance sheet across assets, liabilities, and equity with last‑month and MTD comparisons. Lists bank and cash accounts with totals and breaks balances down by currency. Built for quick visibility into performance and cash runway for finance teams and founders.
Free
Mailchimp email campaign performance dashboard for Shopify store cover image
Mailchimp email campaign performance dashboard for Shopify store

Unified Mailchimp-to-Shopify funnel tracking with product and revenue insights.

Tracks the full marketing-to-revenue funnel by combining Mailchimp engagement with Shopify sales outcomes. Visualizes key steps from sends, opens, and clicks through to orders and revenue over the last 12 months. Surfaces top-selling items and product mix to reveal winners and gaps. Monitors clicks, total sales, orders, and average order value to quantify campaign ROI and product performance.
Free
Mailchimp email marketing analytics dashboard cover image
Mailchimp email marketing analytics dashboard

Email marketing dashboard that connects Klaviyo/Mailchimp with GA4 and Shopify to track the full journey from send to revenue.

Email marketing analytics template that unifies Klaviyo, Mailchimp, GA4, and Shopify data to measure campaign impact end to end. Visualizes the funnel from emails sent and delivered to opens, clicks, purchasers, and revenue. Tracks core metrics like open rate, click rate, unsubscribes, bounces, new subscribers, and spam complaints by campaign and over time. Highlights landing pages, traffic trends, and top campaigns to reveal what drives engagement and sales. Built to tie email performance directly to orders and revenue for clear ROI decisions.
Free
Mailchimp analytics dashboard cover image
Mailchimp analytics dashboard

Mailchimp Looker Studio template tracking campaign funnel, engagement, deliverability, and list health with campaign-level detail.

Mailchimp analytics template for Looker Studio to track email marketing performance end-to-end. Visualizes the campaign funnel from emails sent and delivered to unique opens and clicks, plus unsubscribes, bounces, and spam reports to monitor deliverability and list health. Trend charts highlight open and click rates, subscriber engagement, and emails sent vs. opened over time. A campaign-level table benchmarks KPIs, flags issues, and includes revenue fields to pinpoint high-impact emails. Built for marketers who want fast, actionable insights on audience behavior and growth.
Free
Google Calendar dashboard cover image
Google Calendar dashboard

Google Calendar analytics in Looker Studio to audit meeting load, availability, focus time, and scheduling patterns.

Google Calendar analytics template for Looker Studio that converts your event history into clear, actionable time insights. Track total meeting hours, availability percentage, recurring vs ad‑hoc mix, focus time and out‑of‑office, top meeting organizers, conferencing tools, and trends by day, week, and month. Surface overload and cancelation patterns, pinpoint who drives most meetings, and spot peak vs low workload periods. Identify natural focus windows to rebalance time allocation, increase deep work, and prevent burnout. Automated refresh via Coupler.io keeps insights current for ongoing planning.
Free
Google Analytics dashboard for multiple properties cover image
Google Analytics dashboard for multiple properties

Unified GA4 dashboard for multiple properties with traffic, engagement, channel/source, device, and geo insights.

GA4 Looker Studio template that consolidates analytics from multiple properties into one clear view. Compare sessions, total users, new users, and average engagement time across channels, source/medium, devices, and countries. Track channel mix and source performance alongside a geo breakdown to pinpoint where growth and engagement come from. Ideal for teams managing several sites who need a single, current view of web performance to guide marketing and content decisions.
Free
Meta Ads creatives dashboard cover image
Meta Ads creatives dashboard

Creative-level Meta Ads analytics with KPIs and trends to compare, optimize, and scale ad performance.

Meta Ads creative performance tracking focused on comparing ads across campaigns and ad groups. Highlights the core KPIs marketers need—impressions, clicks, amount spent, CPC, CPM, CTR, and post engagement—to quickly identify winning and underperforming creatives. A detailed table ranks each ad by efficiency, while time‑series charts reveal trends for impressions vs. CPM, clicks vs. CPC, and spend dynamics. Helps pinpoint cost drivers, pacing issues, and optimization opportunities for higher ROI. Built for advertisers seeking clear, creative‑level insights.
Free
Facebook Ads leads breakdown dashboard cover image
Facebook Ads leads breakdown dashboard

Looker Studio template to track Facebook Ads spend, funnel, and campaign/creative performance with metrics like CPL, ROAS, CTR, and lead value.

A Looker Studio template for Facebook Ads that consolidates data from Ads Manager into one view of spend, CPM, CPC, CTR, link clicks, leads, CPL, lead value, and ROAS. It visualizes the full funnel from impressions to conversions and includes a frequency meter to balance reach and avoid audience fatigue. Time-series trends, geographic insights, and a campaign/ad set/creative breakdown make it easy to spot winners and bottlenecks. Designed for marketers and agencies to compare performance across segments and reallocate budget with confidence.
Free
Facebook page insights dashboard cover image
Facebook page insights dashboard

Facebook Page Insights template to track impressions, reach, views, likes by country, and post-level performance.

Facebook Page Insights template focused on page performance across one or multiple accounts. Track total, organic, and paid impressions, page views, likes, unlikes, and net likes with clear day‑by‑day trends. Compare organic reach vs. paid impact, see page views dynamics, and map page likes by country. Review recent posts with impressions, reach, shares, and reaction breakdowns to identify winning content and optimize strategy.
Free
Shopify sales funnel dashboard cover image
Shopify sales funnel dashboard

Unified sales funnel template mapping conversions from ad impression to customer across CRM and marketing channels with channel, geo, and ROI insights.

Sales funnel dashboard template that tracks the full journey from first touch to closed customer by unifying CRM and marketing data. Integrates HubSpot or Pipedrive with Google Analytics, Google Ads, and Facebook Ads to visualize multi‑stage conversions and drop‑offs by channel, country, and item. Highlights channel attribution, geographic performance, and spend vs. conversion efficiency so you can reallocate budget and fix bottlenecks faster. Monitors impressions, clicks, website visitors, CRM leads, MQLs, SQLs, conversion rates, CPL, cost per SQL, bounce rate, and revenue impact. Ideal for marketers, sales teams, and agencies needing a clear view of acquisition performance and ROI.
Free