Author: coupler

The best free & paid Looker Studio templates, curated and quality-ranked for data reporting.

Clear All

Showing 41 - 68 of 68

Salesforce sales dashboard cover image
Salesforce sales dashboard

Salesforce-to-Looker Studio template for tracking pipeline, win/loss, team performance, and revenue drivers with automated Coupler.io sync.

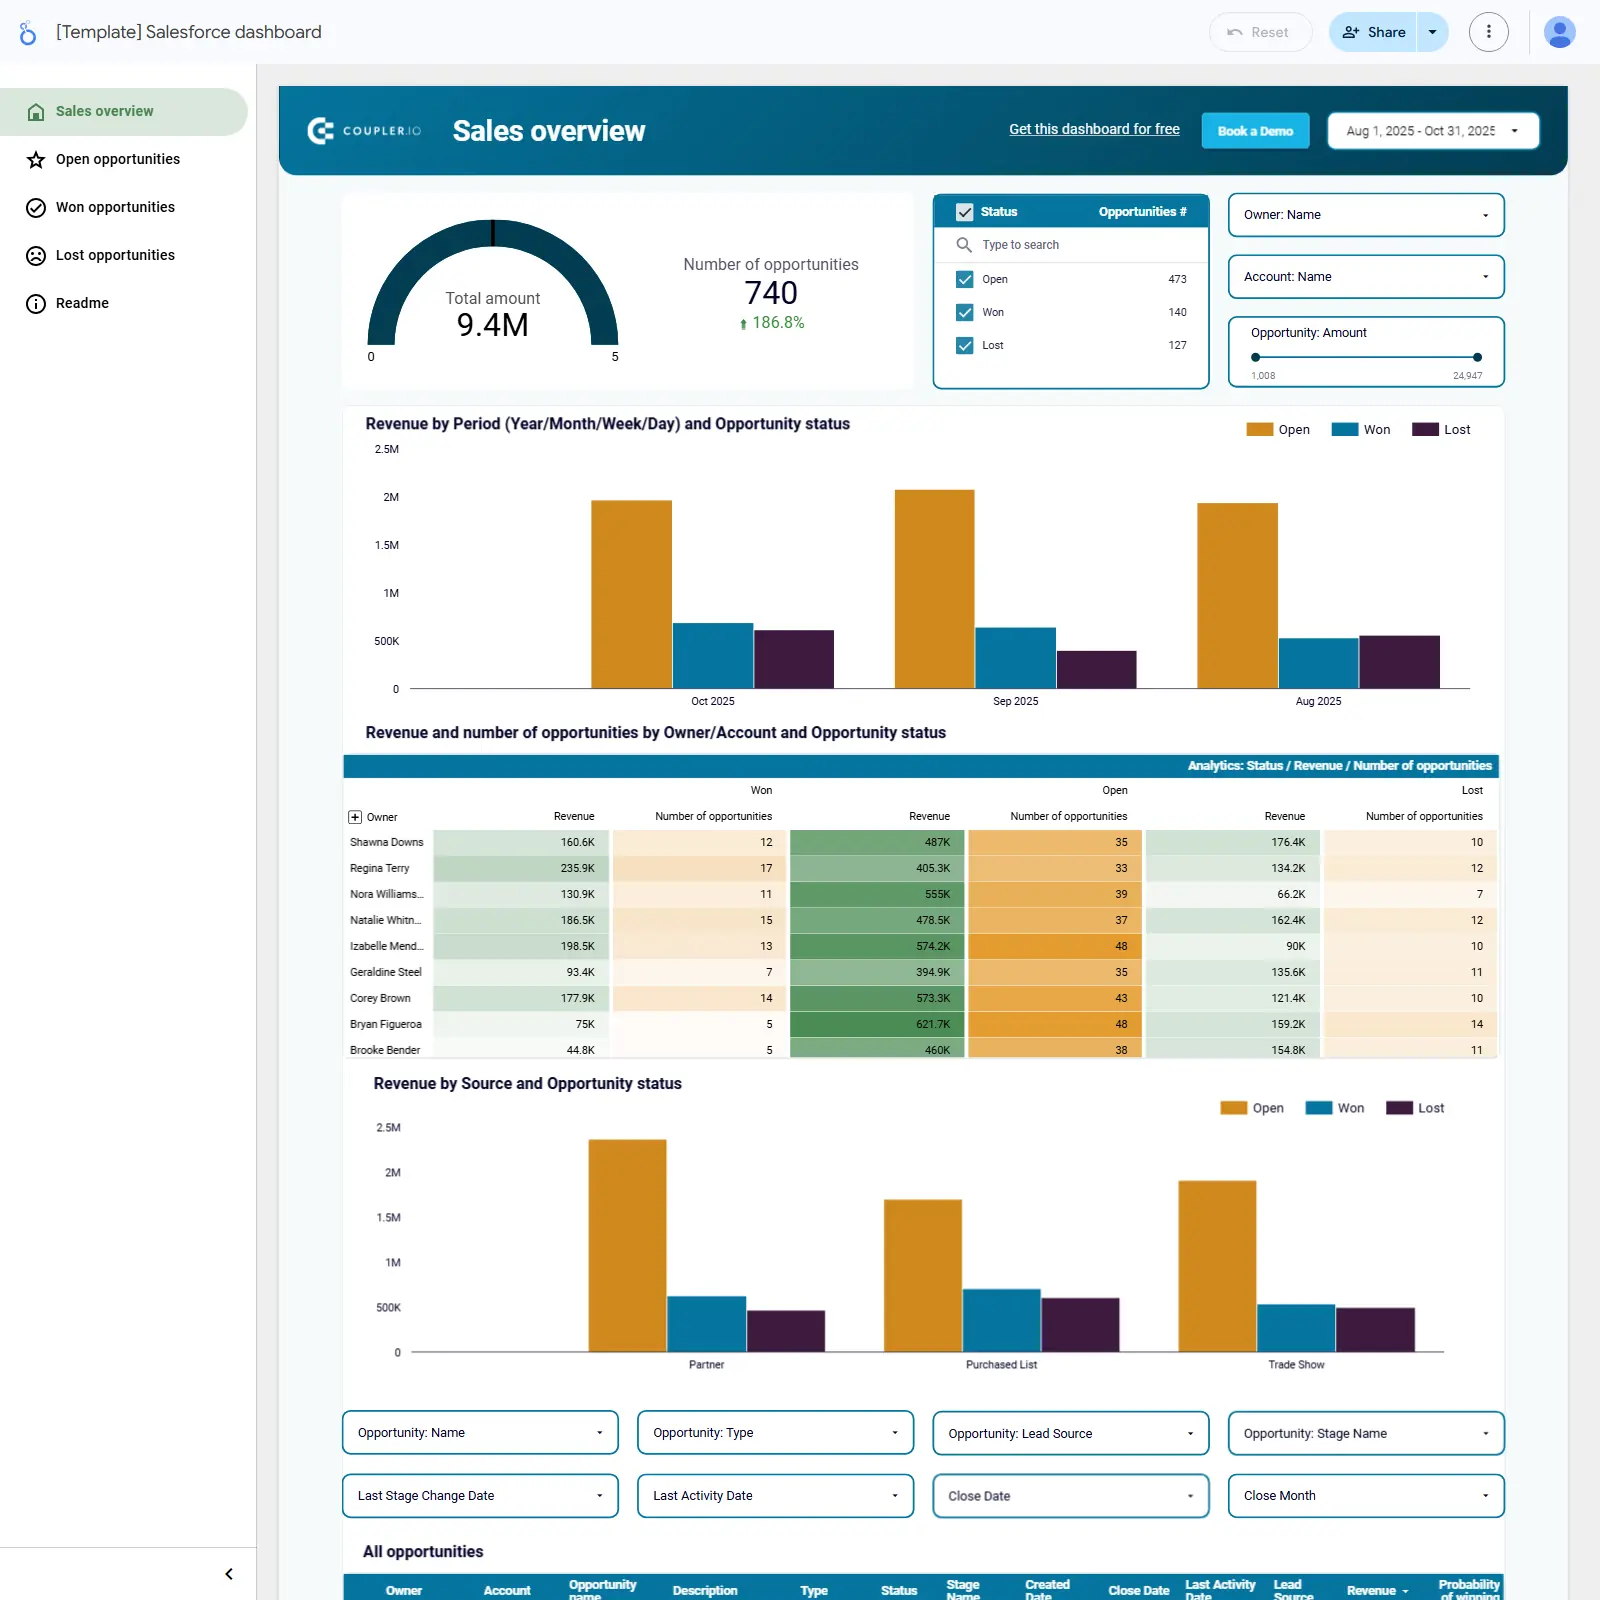
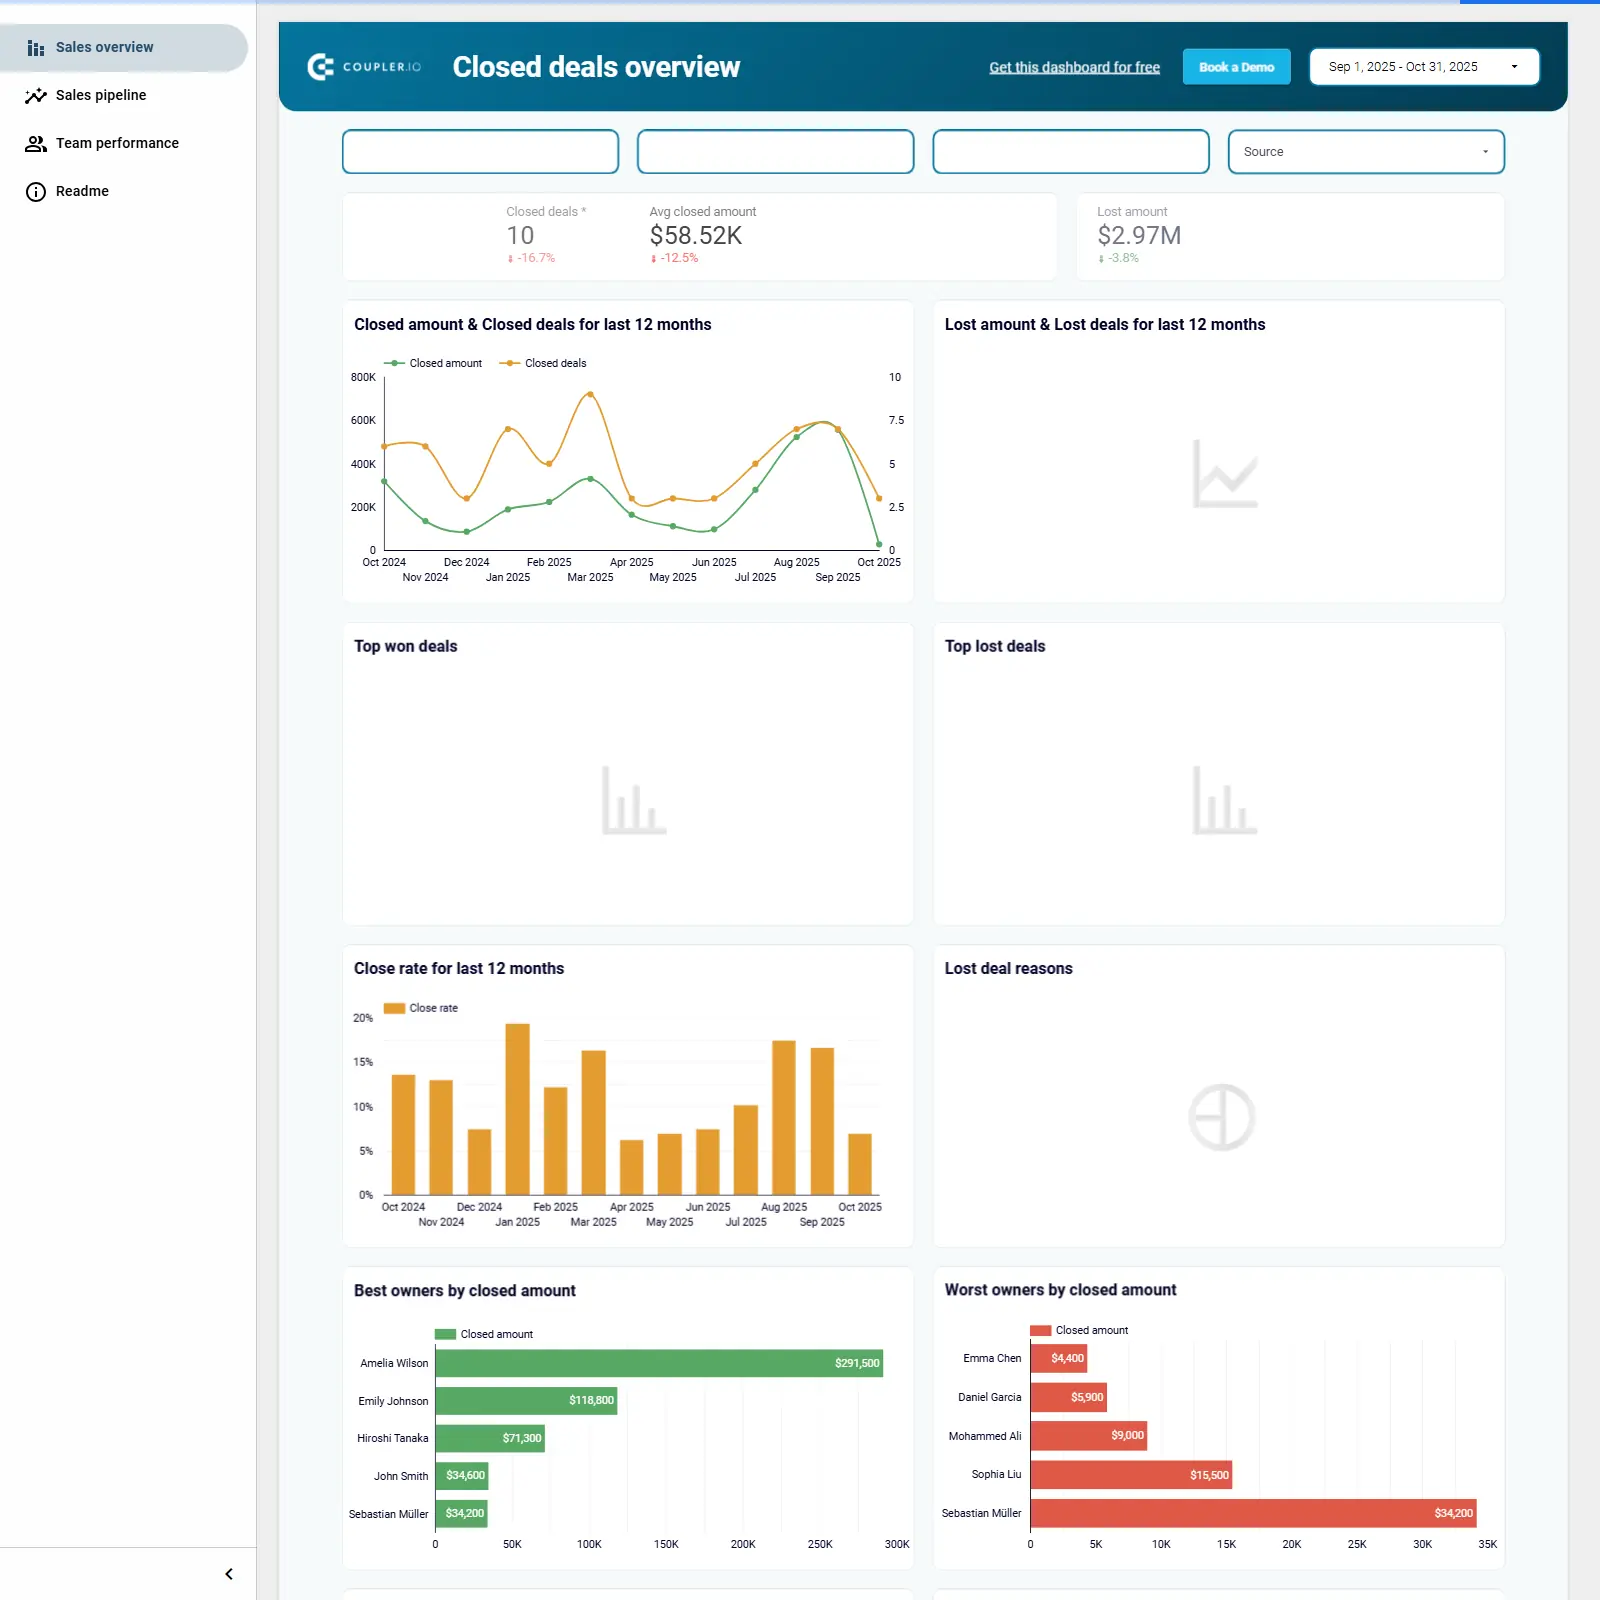
Salesforce sales analytics template for Looker Studio that unifies team performance, pipeline movement, and revenue trends into one view. Prebuilt pages surface Sales overview plus Open, Won, and Lost opportunities with breakdowns by owner, account, source, and deal size. Tracks the essentials: total sales, pipeline value, expected revenue, win/close/lost rates, average days to close, open deal age, and won/lost counts and amounts. Surfaces top performers, stage bottlenecks, and win/loss patterns to improve forecasting and execution. Powered by Coupler.io with automated refresh to keep Salesforce data current in Looker Studio.
Free
Quora Ads dashboard cover image
Quora Ads dashboard

Quora Ads analytics covering spend, reach, click metrics, campaign rankings, leads, CPL, and conversions.

Quora Ads performance template focused on spend efficiency and campaign impact. Track trends for amount spent, impressions, clicks, CTR, CPC, and CPM to spot shifts in reach and cost. Compare campaigns with top lists by spend, CTR, and lowest CPC to find quick optimization wins. Monitor lead generation, cost per lead, and conversions by date to gauge acquisition quality. Use it to reallocate budget toward the Quora campaigns that deliver the best results.
Free
Google Ads creatives dashboard cover image
Google Ads creatives dashboard

Google Ads creative performance analytics with key KPIs, trends, and top creatives for optimization.

Google Ads creatives performance tracking focused on spend efficiency, reach, and engagement across campaigns, ad groups, and ad types. Key metrics include amount spent, impressions, clicks, CPC, CPM, and CTR with a detailed creative-level table for comparisons. Trend visuals highlight impressions vs. CPM, clicks vs. CPC, and spend dynamics over time. Ranking and breakdowns surface top-performing creatives by conversions and impressions by ad type to guide optimization.
Free
Google Ads keywords performance dashboard cover image
Google Ads keywords performance dashboard

Google Ads keyword performance analytics to optimize spend, clicks, and conversions across campaigns.

Google Ads keywords performance focused on measuring cost-efficiency and revenue impact across search terms and ad groups. Covers core KPIs such as cost, impressions, clicks, CTR, CPC, CPM, conversions, conversion value, conversion rate, and cost per conversion, with trend charts and a detailed keyword table to surface winners and waste. Highlights top keywords by clicks and visualizes shifts in impressions, CPC, and CPA over time to guide bid and budget decisions. Excludes Performance Max campaigns.
Free
Facebook Ads performance for mobile apps dashboard cover image
Facebook Ads performance for mobile apps dashboard

Mobile app UA dashboard tracking spend, ROAS, CPM/CPC/CPI, and funnel from impressions to purchases with weekly trends.

Looker Studio template for tracking mobile app user acquisition across paid campaigns, from impression to purchase. Highlights spend vs. purchase value with ROAS, plus CPM, CPC, CPI, average install value, and average purchase value. A funnel summarizes conversion at each stage (impressions, link clicks, installs, purchases) while weekly trend charts reveal changes in costs and volume. Ideal for spotting bottlenecks, optimizing budgets and creatives, and quantifying revenue impact of marketing efforts.
Free
Apple Search Ads dashboard cover image
Apple Search Ads dashboard

Apple Search Ads dashboard template to analyze campaigns, keywords, and device performance and optimize installs and spend.

Apple Search Ads analytics template for Looker Studio that brings all campaign data into one view to guide smarter app growth decisions. Track spend, impressions, clicks, installs, CTR, CPC, CPA, conversion rate, and new downloads with device split for iPhone vs. iPad. Compare campaigns and keywords, identify top converters, and analyze actual search terms to refine targeting. Review daily and month‑over‑month trends to spot seasonality, budget efficiency, and performance shifts. Turn insights into actions by reallocating spend, adjusting bids, and improving creatives to drive more quality installs.
Free
LinkedIn company page performance dashboard cover image
LinkedIn company page performance dashboard

LinkedIn Company Pages analytics for tracking engagement, audience sources, and post performance.

LinkedIn Company Pages analytics focused on content and audience performance. Track impressions, engagements, engagement rate, clicks, likes, and reposts with clear trend lines. See where traffic comes from with page views split by device and a country map. Surface top and underperforming posts with a detailed table showing impressions, likes, reposts, comments, and engagement rate. Built for marketers and social teams to spot growth drivers and refine posting strategy.
Free
Revenue dashboard for Xero cover image
Revenue dashboard for Xero

Xero revenue analytics covering invoices, 12‑month P&L, top customers, and top products to guide cash flow and sales decisions.

Revenue dashboard for Xero focused on revenue, cash flow, and sales performance. Monitor invoices with totals for paid, due, overdue, and open amounts alongside monthly trends. Review a 12‑month Profit & Loss table showing revenue, direct costs, and operating expenses. Identify top customers and products by revenue, plus average revenue per customer, number of products sold, and average price. See invoice details by customer and status to spot blockers and opportunities.
Free
Snapchat Ads dashboard cover image
Snapchat Ads dashboard

Snapchat Ads analytics with KPIs, trends, and campaign comparisons to optimize spend and conversions.

Snapchat Ads performance dashboard focused on spend, reach, impressions, views, swipe ups, purchases, and cost efficiency metrics like eCPM, eCPV, and eCPSU. Visualizes daily trends and spend dynamics to catch rising costs or underperforming periods. Highlights top campaigns by swipe ups and provides a detailed campaign table for fast comparisons of status, costs, rates, and outcomes. Helps optimize budgets and creative strategy to drive more conversions at lower costs.
Free
QuickBooks Revenue dashboard cover image
QuickBooks Revenue dashboard

Revenue dashboard for Looker Studio that analyzes QuickBooks/Xero income, P&L, customers, products, and invoices.

Revenue analytics template for Looker Studio focused on tracking income and profitability from QuickBooks or Xero data. Monitors paid, overdue, and open invoices alongside month‑to‑date and year‑to‑date Profit & Loss. Surfaces customer metrics such as total customers, revenue by customer, and average revenue per customer to target retention and collections. Reveals product performance with top products, quantities, and average prices to guide pricing and assortment. Includes a detailed invoice table for audit trails and cash‑flow follow‑up.
Free
CRM dashboard for Pipedrive cover image
CRM dashboard for Pipedrive

Pipedrive CRM template for monitoring pipeline health, conversion rates, revenue trends, and rep performance.

Pipedrive CRM template focused on revenue and pipeline performance across teams and deal labels. Tracks essentials like total sales, win rate, close rate, average days to close, pipeline value, open deals, weighted pipeline, and deal age. Includes time‑series for closed and projected value, stacked pipelines by agent and label, and a monthly deal stage breakdown to spot bottlenecks. Highlights top vs. underperforming reps to guide coaching, forecasting, and prioritization.
Free
LinkedIn page and ads analytics cover image
LinkedIn page and ads analytics

A LinkedIn page and ads analytics template covering key KPIs, campaign performance, and geo insights.

LinkedIn page and ads analytics for tracking campaign performance and organic reach in one place. Monitor impressions, clicks, cost, CPM, CPC, CTR, organic page views, and spend over time to spot trends and optimize budgets. Review a campaign overview table with landing page clicks and frequency to identify top performers and underachievers. Compare countries with geo maps for ad impressions and page views to refine targeting. Ideal for marketers who need quick answers on efficiency, growth, and where to scale on LinkedIn.
Free
Instagram business dashboard cover image
Instagram business dashboard

Instagram analytics for Looker Studio to compare profiles, monitor reach and engagement, analyze audience, and optimize content performance.

Instagram Business Dashboard for Looker Studio unifies analytics across multiple Instagram profiles to benchmark reach, impressions, and engagement. Track likes, comments, shares, saves, website clicks, “Get directions,” and Reels plays to see what content drives outcomes. Explore follower demographics and day‑of‑week patterns, plus follower reach rate, to refine targeting and posting schedules. Assess performance by media type and individual posts to optimize creative and improve results. Auto‑updated charts keep metrics current for fast, confident reporting.
Free
All-in-one marketing analytics dashboard cover image
All-in-one marketing analytics dashboard

Unified marketing overview for traffic, paid ads, and organic search in one place.

All‑in‑one marketing overview template that unifies website analytics, paid media, and organic search in a single view. Track top traffic sources, compare paid channels, and monitor ads performance alongside Google search insights. Connect data from Google Analytics and major ad networks to see clicks, cost, conversions, and trends together. Identify winning channels and reallocate budget with confidence.
Free
Branded organic search vs paid campaign performance dashboard for Google cover image
Branded organic search vs paid campaign performance dashboard for Google

Compare paid vs organic search to track clicks, impressions, CTR, spend, and share of clicks by keyword.

Paid vs organic search performance in one place to see how keywords drive visibility and traffic. Track impressions, clicks, CTR, spend, and share of clicks over time and by search term. Compare organic vs paid CTR and impressions to uncover cannibalization or lift. Highlight high‑impact keywords to shift budget, improve creatives, and align SEO with PPC.
Free
Google Ads and Meta Ads campaign performance dashboard cover image
Google Ads and Meta Ads campaign performance dashboard

Cross‑channel Google Ads vs Meta Ads dashboard for fast spend, reach, and efficiency comparisons by day and campaign.

Side‑by‑side view of Google Ads and Meta Ads performance that consolidates spend, impressions, clicks, CTR, CPC/CPM, and trend lines over time. Highlights daily spend dynamics and key totals for each network to spot spikes, dips, and efficiency shifts quickly. Campaign-level tables for both platforms surface winners and underperformers so you can reallocate budget with confidence. Designed for quick cross‑channel comparisons and monthly performance reviews without digging through multiple ad accounts.
Free
Facebook Ads ecommerce performance dashboard cover image
Facebook Ads ecommerce performance dashboard

Facebook Ads ecommerce analytics with ROAS, funnel performance, and campaign-level insights for profitable scaling.

Facebook Ads ecommerce dashboard focused on ROAS and revenue impact across campaigns and ad sets. Tracks the full acquisition funnel from impressions and link clicks to adds to cart, checkouts, and purchases, with key cost metrics like CPM, CPC, CPA, and cost per purchase. Visualizes spend vs. purchases value over time and highlights average purchase value for quick ROI reads. Includes trend charts for clicks and purchases plus a detailed campaign performance table to pinpoint top- and under-performing ads. Built for ecommerce teams to optimize budgets, reduce funnel drop‑offs, and grow profitable conversions.
Free
LinkedIn Ads creatives dashboard cover image
LinkedIn Ads creatives dashboard

LinkedIn Ads creatives analysis with ad-level metrics, trend charts, and spend efficiency insights.

LinkedIn Ads creatives performance tracking focused on comparing ad-level results across campaigns. Monitor impressions, clicks, CTR, CPC, CPM, spend, conversions, and engagement to spot winning creatives and underperformers. Trend charts for impressions vs. CPM, clicks vs. CPC, and spend dynamics reveal pacing and efficiency over time. Ideal for marketers and agencies optimizing LinkedIn ad messaging, visuals, and budgets.
Free
Sales KPI dashboard for HubSpot cover image
Sales KPI dashboard for HubSpot

Sales deals performance dashboard for tracking closed revenue, close rate, rep leaderboards, and loss reasons with 12‑month trends.

Sales performance template focused on closed deals and revenue impact. Track closed revenue, average deal size, lost amount, and 12‑month trends for closed and lost deals. Monitor close rate, top won and lost deals, and loss reasons to improve win rates. Compare best and worst owners by closed amount to pinpoint coaching and recognition opportunities. Filter by date and source to see which channels drive results and where deals stall.
Free
Website traffic from YouTube - performance analysis dashboard cover image
Website traffic from YouTube - performance analysis dashboard

Analyze GA4 YouTube-driven website traffic, conversions, and revenue with landing page and monthly trend insights.

YouTube Traffic Performance focuses on how visits from YouTube impact your website using GA4 data. Track users, sessions, new users, bounce rate, key events, and engagement alongside e‑commerce purchases and purchase revenue. Compare traffic, purchases, and revenue over time to see the effect of your video content. Identify high-performing landing pages and monthly trends to optimize content, pages, and campaigns for growth.
Free
Time tracking dashboard for Harvest cover image
Time tracking dashboard for Harvest

Harvest time‑tracking and billing overview with hours, billable amounts, active users, and client/project insights.

Harvest time tracking and billing analytics to monitor team utilization and revenue. Highlights total hours, billable hours, billable amount, and active users with clear month‑over‑month changes. Breaks down time and billings by client, project, user, and task to pinpoint top contributors and bottlenecks. Includes charts for hours and billable amount by client and project plus a calendar view for daily patterns. Ideal for agencies and services teams looking to align workload with billings.
Free
Calendly event dashboard cover image
Calendly event dashboard

Team-wide Calendly analytics for event volume, duration, status, and peak time slots by user and team.

Calendly analytics focused on team performance and scheduling efficiency. Tracks total users, event volume, and event duration with views by user, team, and week. Highlights active vs. canceled status and calendar type, plus most popular time slots to spot peak demand. Includes heatmaps and bar charts for events and duration by user to balance workloads and identify top performers. Ideal for understanding meeting load and optimizing availability across teams.
Free
Facebook Ads Brand Awareness Template cover image
Facebook Ads Brand Awareness Template

Track Facebook/Instagram brand awareness with impressions, clicks, spend, branded metrics, and branded search lift in Looker Studio.

A Looker Studio template for tracking Facebook and Instagram brand awareness in one place. Monitor core KPIs—ad impressions, clicks, spend, branded impressions, and branded clicks—with weekly trends. Link ad activity to outcomes by comparing spend with branded engagement to judge ROI on awareness campaigns. Adds branded search context from Google Search Console to show how ads influence search interest. Built for marketers and agencies who need a clear view of brand reach and lift across Meta ads.
Free
Time tracking dashboard for Clockify cover image
Time tracking dashboard for Clockify

Clockify time and revenue analytics with KPIs and breakdowns by client, project, group, user, and task.

Tracks Clockify time data to spotlight posted hours, active users, billable hours, and billable amount with month‑over‑month change. Breaks performance down by client, project, group, user, and task to reveal who drives time and revenue. Visualizes hours and billings with clear breakdowns and comparisons to surface top clients and projects. Helps estimate workload, monitor utilization, and validate invoicing with a single view.
Free
Google Ads Dashboard cover image
Google Ads Dashboard

Google Ads KPI dashboard for spend, clicks, CPC, conversions, and campaign performance.

Google Ads performance template focused on key PPC metrics: spend, impressions, clicks, CPC, conversions, and conversion rate. Visuals compare impressions vs clicks and clicks vs CPC to quickly gauge engagement and efficiency. Trend and breakdown charts show spend by date and by campaign type, plus conversions by campaign type. Includes top campaigns by conversions and an all‑conversions breakdown to identify winners and wasted spend. Built to support budget allocation and optimization decisions across campaigns.
Free
Web Analytics dashboard cover image
Web Analytics dashboard

Web analytics Looker Studio template tracking traffic, key events, channels, and trends with tabs for acquisition, audience, and conversions.

Looker Studio web analytics template focused on monitoring website traffic and engagement. Covers recent daily traffic, key events, and traffic by channels, plus weekly and monthly trend panels for the last 6–12 months. Sidebar sections for Acquisition, Behavior & Audience, and Conversions guide deeper analysis of marketing performance and user behavior. Designed for quick readouts and trend tracking for teams that need actionable visibility into web performance.
Free
All-in-one social media analytics dashboard cover image
All-in-one social media analytics dashboard

Monthly GA4 + social media overview across Facebook, Instagram, LinkedIn, and YouTube with total users and revenue.

Social media performance snapshot tying GA4 organic metrics with key social channels. Track last month’s impact across Facebook, Instagram, LinkedIn, and YouTube while monitoring total users and revenue from GA4. Compare which networks drive traffic and conversions and quickly spot winners to scale. Built for marketers and decision‑makers who need a single view of social outcomes connected to website results.
Free
Facebook Ads Dashboard cover image
Facebook Ads Dashboard

Facebook Ads performance tracker for impressions, clicks, costs, spend trends, and campaign results.

Facebook Ads Overview template focused on paid social performance. Tracks impressions, clicks, CPM, CPC, spend dynamics, and campaign performance across time. Surfaces a frequency benchmark to flag when audiences are overexposed. Includes an overview and monthly dynamics to spot trends and budget shifts. Helps identify winning campaigns and areas to optimize for cost and reach.
Free