Category: Marketing

The best free & paid Looker Studio templates, curated and quality-ranked for data reporting.

Clear All

Showing 121 - 160 of 367

Mailchimp report template cover image
Mailchimp report template

Mailchimp Looker Studio dashboard covering campaigns, e‑commerce, list health, bounces, A/B tests, and industry benchmarks.

Mailchimp analytics template for Looker Studio focused on email campaign performance and revenue. Brings together campaigns, core email KPIs, e‑commerce results, list growth, bounces, and A/B testing insights. Compares your metrics against industry benchmarks to highlight strengths and gaps. Helps diagnose deliverability issues and refine content and cadence based on test outcomes and engagement.
Free
Mailchimp Looker Studio Template cover image
Mailchimp Looker Studio Template

One‑page Mailchimp analytics for audience growth and campaign performance with funnels and industry benchmarks.

Mailchimp Looker Studio Template tracks email audience growth and campaign performance in a clean, one-page view. See monthly subscriber gains and losses, soft/hard bounces, and a breakdown by device, email client, and country to understand who you’re reaching. Evaluate campaigns with delivery, open, click, and unsubscribe rates, plus an email funnel and industry benchmarks to spot strengths and gaps. Built on Google Sheets, it pulls Mailchimp data without a paid connector and highlights top‑performing campaigns fast.
€69
LinkedIn Pages report template for Looker Studio cover image
LinkedIn Pages report template for Looker Studio

LinkedIn Pages analytics for followers, visitors, and post engagement with detailed audience and device breakdowns.

LinkedIn Pages performance template focused on tracking follower growth, page views, and engagement across posts. Compare paid vs. organic follower gains and monitor visitor traffic by device, country, industry, function, seniority, and company size. Surface top posts, impressions, clicks, likes, comments, shares, and engagement rates by content type. Spot trends over time to refine content strategy, improve reach, and strengthen brand visibility.
Free
LinkedIn Analytics Report Template cover image
LinkedIn Analytics Report Template

LinkedIn company page analytics in Looker Studio covering followers, engagement, visitors, content performance, and conversions.

LinkedIn Analytics Report Template for Looker Studio tracking company page performance across followers, engagement, visitors, and content. Uncover audience demographics like industry, seniority, and location, and monitor follower growth and engagement trends. Identify top posts with likes, comments, shares, CTR, impressions, reach, page views, and traffic sources. Break down visitor behavior and visualize conversions to see how followers turn into leads and customers. Ideal for marketers, analysts, and social teams who want clear insights to refine content and drive results.
£139
Organic LinkedIn Report 3 pages top menu Metricool cover image
Organic LinkedIn Report 3 pages top menu Metricool

Three-page LinkedIn organic analytics template that tracks followers, engagement, impressions, and post performance with day-of-week and 12‑month trends via Metricool.

Three-page Looker Studio template for analyzing organic LinkedIn company profile performance using Metricool data. The Summary page benchmarks key metrics month-over-month and year-over-year, tracks 12‑month follower evolution, new followers per day, and last month’s engagement, interactions, and impressions, plus top content. The Growth page highlights follower trends, new followers vs. posting activity, monthly follower gains, and the days of the week that drive the most growth and impressions. The Posts page drills into post-level performance—impressions, engagement, comments, clicks, likes, video views and watch time—with a table of all posts and the top 5 by reach and engagement. Ideal for social media managers and agencies who need quick, client-ready insights on what’s working and when to post.
$53.30
LinkedIn page and ads analytics cover image
LinkedIn page and ads analytics

A LinkedIn page and ads analytics template covering key KPIs, campaign performance, and geo insights.

LinkedIn page and ads analytics for tracking campaign performance and organic reach in one place. Monitor impressions, clicks, cost, CPM, CPC, CTR, organic page views, and spend over time to spot trends and optimize budgets. Review a campaign overview table with landing page clicks and frequency to identify top performers and underachievers. Compare countries with geo maps for ad impressions and page views to refine targeting. Ideal for marketers who need quick answers on efficiency, growth, and where to scale on LinkedIn.
Free
Klaviyo - Email SMS Campaign Report cover image
Klaviyo - Email SMS Campaign Report

Klaviyo Email & SMS analytics in Looker Studio covering performance, deliverability, audience insights, and channel impact.

Klaviyo Email & SMS Campaign template for Looker Studio tracks core email KPIs—open rate, click rate, conversions, revenue per campaign, and deliverability signals like bounces, unsubscribes, and spam complaints. Visual insights include time-series trends, heatmaps, maps by country and city, and campaign-level tables to spot winners and underperformers fast. Audience analysis highlights peak engagement times, geography, and device preferences to refine targeting. Subscriber growth and segment performance reveal which cohorts drive conversions, while side‑by‑side email vs SMS views clarify each channel’s contribution.
Free
Social Media competitors report template cover image
Social Media competitors report template

Benchmark competitors across major social platforms and uncover winning content, audience trends, and campaign impact.

A competitive social media template for Looker Studio that benchmarks your brand against rivals across Instagram, Facebook, LinkedIn, TikTok, Pinterest, and Google Business Profile. Track engagement rates, follower growth, reach, ad spend, and content performance to pinpoint what competitors do best. Segment results by time, platform, demographics, location, device, and post type to uncover strategic opportunities. Blend multiple sources to create a single view of the market and highlight top-performing campaigns and posts. White‑label visuals, custom metrics, historical data, filters, and scheduled email alerts make it client‑ready and actionable.
Free
Instagram business dashboard cover image
Instagram business dashboard

Instagram analytics for Looker Studio to compare profiles, monitor reach and engagement, analyze audience, and optimize content performance.

Instagram Business Dashboard for Looker Studio unifies analytics across multiple Instagram profiles to benchmark reach, impressions, and engagement. Track likes, comments, shares, saves, website clicks, “Get directions,” and Reels plays to see what content drives outcomes. Explore follower demographics and day‑of‑week patterns, plus follower reach rate, to refine targeting and posting schedules. Assess performance by media type and individual posts to optimize creative and improve results. Auto‑updated charts keep metrics current for fast, confident reporting.
Free
All-in-one marketing analytics dashboard cover image
All-in-one marketing analytics dashboard

Unified marketing overview for traffic, paid ads, and organic search in one place.

All‑in‑one marketing overview template that unifies website analytics, paid media, and organic search in a single view. Track top traffic sources, compare paid channels, and monitor ads performance alongside Google search insights. Connect data from Google Analytics and major ad networks to see clicks, cost, conversions, and trends together. Identify winning channels and reallocate budget with confidence.
Free
Google Analytics 4 GA4 Essential cover image
Google Analytics 4 GA4 Essential

GA4 Looker Studio template for analyzing traffic sources and e‑commerce results, including engaged sessions, transactions, revenue, and ARPU.

Built on Google Analytics 4 data in Looker Studio, the GA4 Essential template centers on acquisition and e‑commerce performance. A heat‑mapped source/medium table surfaces total and new users, sessions, engaged sessions, engagement rate, transactions, total revenue, and ARPU. Filters for country, device category, and date enable quick comparison of segments and channels. Additional sections cover overview, e‑commerce charts, page/screen views, and events & tech details for a complete read on site performance. Ideal for pinpointing the channels that drive engaged sessions and revenue.
Free
GA4 Looker Studio Template cover image
GA4 Looker Studio Template

All‑in‑one GA4 template to track visitors, engagement, content results, and conversions by channel, device, and country.

GA4 Looker Studio template focused on measuring website and app performance across Overview, Content, Engagement, and Conversions. Tracks core KPIs like total visitors, percent new visitors, sessions, engaged sessions, and engagement rate with period-over-period change indicators. Visuals highlight channel/source performance, time‑series trends, top traffic sources, country heatmap, and device mix to reveal where users come from and how they behave. Helps identify winning content, pinpoint drop‑offs, and connect acquisition and engagement to conversion outcomes. Ideal for marketers, analysts, and decision‑makers who need fast, actionable GA4 insights.
Free
Newsletter - UTM Tagging cover image
Newsletter - UTM Tagging

GA4 UTM auditing template that flags untagged URLs and malformed UTMs to protect attribution accuracy.

UTM Tagging Auditor for Google Analytics 4 that audits campaign tagging quality and protects attribution accuracy. Highlights untagged campaign URLs and sessions where auto‑tagging is enabled but utm_source, utm_medium, or utm_campaign are missing, with counts by page location. Surfaces anomalies like unusually long UTM values and separates issues with clear red/green indicators for fast triage. Helps marketers prioritize fixes so channel and campaign performance reporting stays trustworthy.
Free
GA4 Audit Dashboard by KP Playbook cover image
GA4 Audit Dashboard by KP Playbook

GA4 audit template focused on UTM hygiene, channel grouping accuracy, and end‑to‑end data quality across acquisition, pages, events, and eCommerce.

GA4 Audit Dashboard to diagnose Google Analytics 4 data quality and tagging issues. Highlights UTM hygiene such as uppercase/lowercase mismatches in sources and mediums, excessive or messy medium lists, and missing separation of paid vs. organic social. Surfaces “Unassigned” sessions and other channel grouping problems so you can fix tracking at the source. Includes sections for Acquisition, Pages, Events/Key Events, Overall Data Quality, and eCommerce to validate end‑to‑end GA4 setup. Built for quick, actionable insights that improve accuracy and reporting reliability.
Free
GA4 Classic Mode - Upmize Analytics cover image
GA4 Classic Mode - Upmize Analytics

GA4 “Classic Mode” template that mirrors UA to track traffic, engagement, and ecommerce performance at a glance.

GA4 template modeled after Universal Analytics “Classic Mode” for fast, familiar performance tracking. Monitor users, new users, sessions per user, pageviews, pages per session, average session duration, bounce rate, revenue, and ecommerce conversion rate with time-series trends and a new vs. returning visitor split. Organized navigation across Overview, Audience, Acquisition, Behavior, Conversions, and Advanced sections. Ideal for teams migrating from UA who want actionable GA4 insights without relearning their workflow.
Free
Branded organic search vs paid campaign performance dashboard for Google cover image
Branded organic search vs paid campaign performance dashboard for Google

Compare paid vs organic search to track clicks, impressions, CTR, spend, and share of clicks by keyword.

Paid vs organic search performance in one place to see how keywords drive visibility and traffic. Track impressions, clicks, CTR, spend, and share of clicks over time and by search term. Compare organic vs paid CTR and impressions to uncover cannibalization or lift. Highlight high‑impact keywords to shift budget, improve creatives, and align SEO with PPC.
Free
Cross-platform report template for Looker Studio cover image
Cross-platform report template for Looker Studio

Unified ad performance dashboard comparing spend, clicks, CTR, conversions, and ROI across Facebook, Google, LinkedIn, and other channels.

Cross-platform Looker Studio template for unifying marketing performance from Facebook Ads, Google Ads, LinkedIn Ads, and more. Brings together cost, impressions, clicks, CTR, conversions, conversion rate, and efficiency metrics like CPA/ROAS to compare channels side by side. Pinpoints which platforms drive the best results and how cost per conversion and ROI stack up to guide budget shifts. Trend views surface seasonality and performance changes by channel and account for faster decisions. Built to highlight total impact and reveal opportunities to reallocate spend to top performers.
Free
Google Ads vs Facebook Ads comparison template cover image
Google Ads vs Facebook Ads comparison template

Side‑by‑side comparison of Google Ads vs Facebook Ads across CTR, CPC, CPA, cost, impressions, clicks, and conversions.

Compare Google Ads and Facebook Ads head‑to‑head to find the stronger acquisition channel. Track CTR, CPC, cost per conversion, total cost, impressions, clicks, and conversions side‑by‑side for quick benchmarking. Highlight audience and performance differences with demographics insights to guide budget shifts. Clean comparison cards make it easy to spot trends and winners fast. Built by Supermetrics for marketers running paid media on both platforms.
Free
Google Ads Audience report template cover image
Google Ads Audience report template

Google Ads audience analytics in Looker Studio with segment-level insights on reach, CTR, conversions, CPA, and ROAS.

Monitor Google Ads audience performance across reach, conversions, CTR, CPC/CPM, cost per conversion, and ROAS. Segment results by demographics, devices, locations, time of day, campaign, ad group, keyword, and audience to spot high‑value segments. Identify which audiences and geographies drive the most impressions and conversions and how costs vary by segment. Built for PPC teams to compare results and shift budget toward profitable audiences.
Free
Google Ads YouTube Performance cover image
Google Ads YouTube Performance

Google Ads YouTube for Action performance dashboard covering KPIs, ad groups, creatives, engagement, and day‑of‑week insights.

Track Google Ads YouTube for Action performance with a clear overview of key KPIs like impressions, views, clicks, cost, and conversions. Drill into Ad Groups and Creatives to compare results and spot best‑performing assets. Review engagement metrics and view-rate trends, plus day‑of‑week patterns for clicks, views, and conversions. Surface top campaigns to guide budget shifts and creative optimizations.
Free
Google Ads Search Opportunity Lost Budget Bid cover image
Google Ads Search Opportunity Lost Budget Bid

Google Ads template to find and size lost impression share and revenue from budget/bid limits, with device and campaign‑level detail.

Pinpoint lost search impression share in Google Ads caused by budget and bid limits. Compare budget loss versus the previous period and break it down by device to see where demand is being missed. Estimate online revenue lost by device to size the impact. Drill into campaign‑level budget loss to decide where to increase spend or adjust bids.
Free
Google Ads Search Auction Insights cover image
Google Ads Search Auction Insights

Competitive benchmarking for Google Ads using Search Auction Insights across campaigns, ad groups, keywords, and devices.

Benchmark Google Ads Search performance against competitors using Auction Insights across campaigns, ad groups, keywords, and devices. Track impression share, absolute top of page rate, top of page rate, position above rate, and outranking share with period‑over‑period comparisons. Reveal trends by advertiser to see who’s gaining visibility and where you’re losing ground. Identify priority campaigns and keywords to defend share and capture opportunities. Built for PPC teams focused on competitive search strategy.
Free
Google Ads Discovery Performance Insights cover image
Google Ads Discovery Performance Insights

Google Ads Discovery campaign performance insights with trend, comparison, and asset-level analysis.

Performance insights for Google Ads Discovery campaigns, focused on clicks, cost, conversions, and cost per conversion with clear comparison to the previous period. Includes views for account, campaign, and ad group performance plus audience type analysis to spot what’s working. Highlights daily trends to track momentum and seasonality. Covers ad format coverage and asset-level results to evaluate creatives and labels. Built to guide budget shifts, bidding tweaks, and creative optimization for Discovery ads.
Free
Google Ads Single Page Report Template cover image
Google Ads Single Page Report Template

Single-page Google Ads overview with visibility, conversion, and cost metrics to optimize spend and ROI.

Single-page Google Ads performance template focused on fast, actionable insight. Tracks core KPIs across the funnel—impressions and absolute top %, clicks and CTR, conversions and conversion rate, plus cost, CPC, CPA, and ROAS—along with top campaigns. Spot wasted spend, highlight winners, and justify budget with clear ROI metrics. Ideal for marketers and PPC teams who want quick decisions without digging through multiple reports.
€69
Google Ads Overview Report Template cover image
Google Ads Overview Report Template

Google Ads overview template for Looker Studio that surfaces visibility, acquisition, conversion, and cost KPIs to improve ROI.

Optimize Google Ads spend with a Looker Studio template focused on visibility, acquisition, conversion, and cost performance. Track impressions, top impression rate, impression share, CPC, CPA, ROAS, and budget trends to quickly spot wins and waste. Evaluate campaigns, keywords, audiences, devices, locations, and auction insights to find the drivers of ROI. Compare periods to guide bidding, budgeting, and creative decisions with confidence.
€99
Google Ads Funnel Template cover image
Google Ads Funnel Template

End-to-end Google Ads funnel tracking with reach, engagement, clicks, conversions, revenue, and ROAS in one view.

Map the full Google Ads funnel from awareness to conversion to see where campaigns win or leak. Track costs, impressions, and CPM for reach; engagements and engagement rate for interest; clicks, CTR, and CPC for consideration; and conversions, conversion value, and ROAS for outcomes. Compare success rates across stages and quantify drop‑offs. Monitor weekly trends for awareness, engagement, clicks, and results to guide budget shifts and creative tests.
Free
Facebook Organic report template cover image
Facebook Organic report template

Looker Studio template for Facebook Insights covering reach, engagement, audience demographics, content performance, and paid impact.

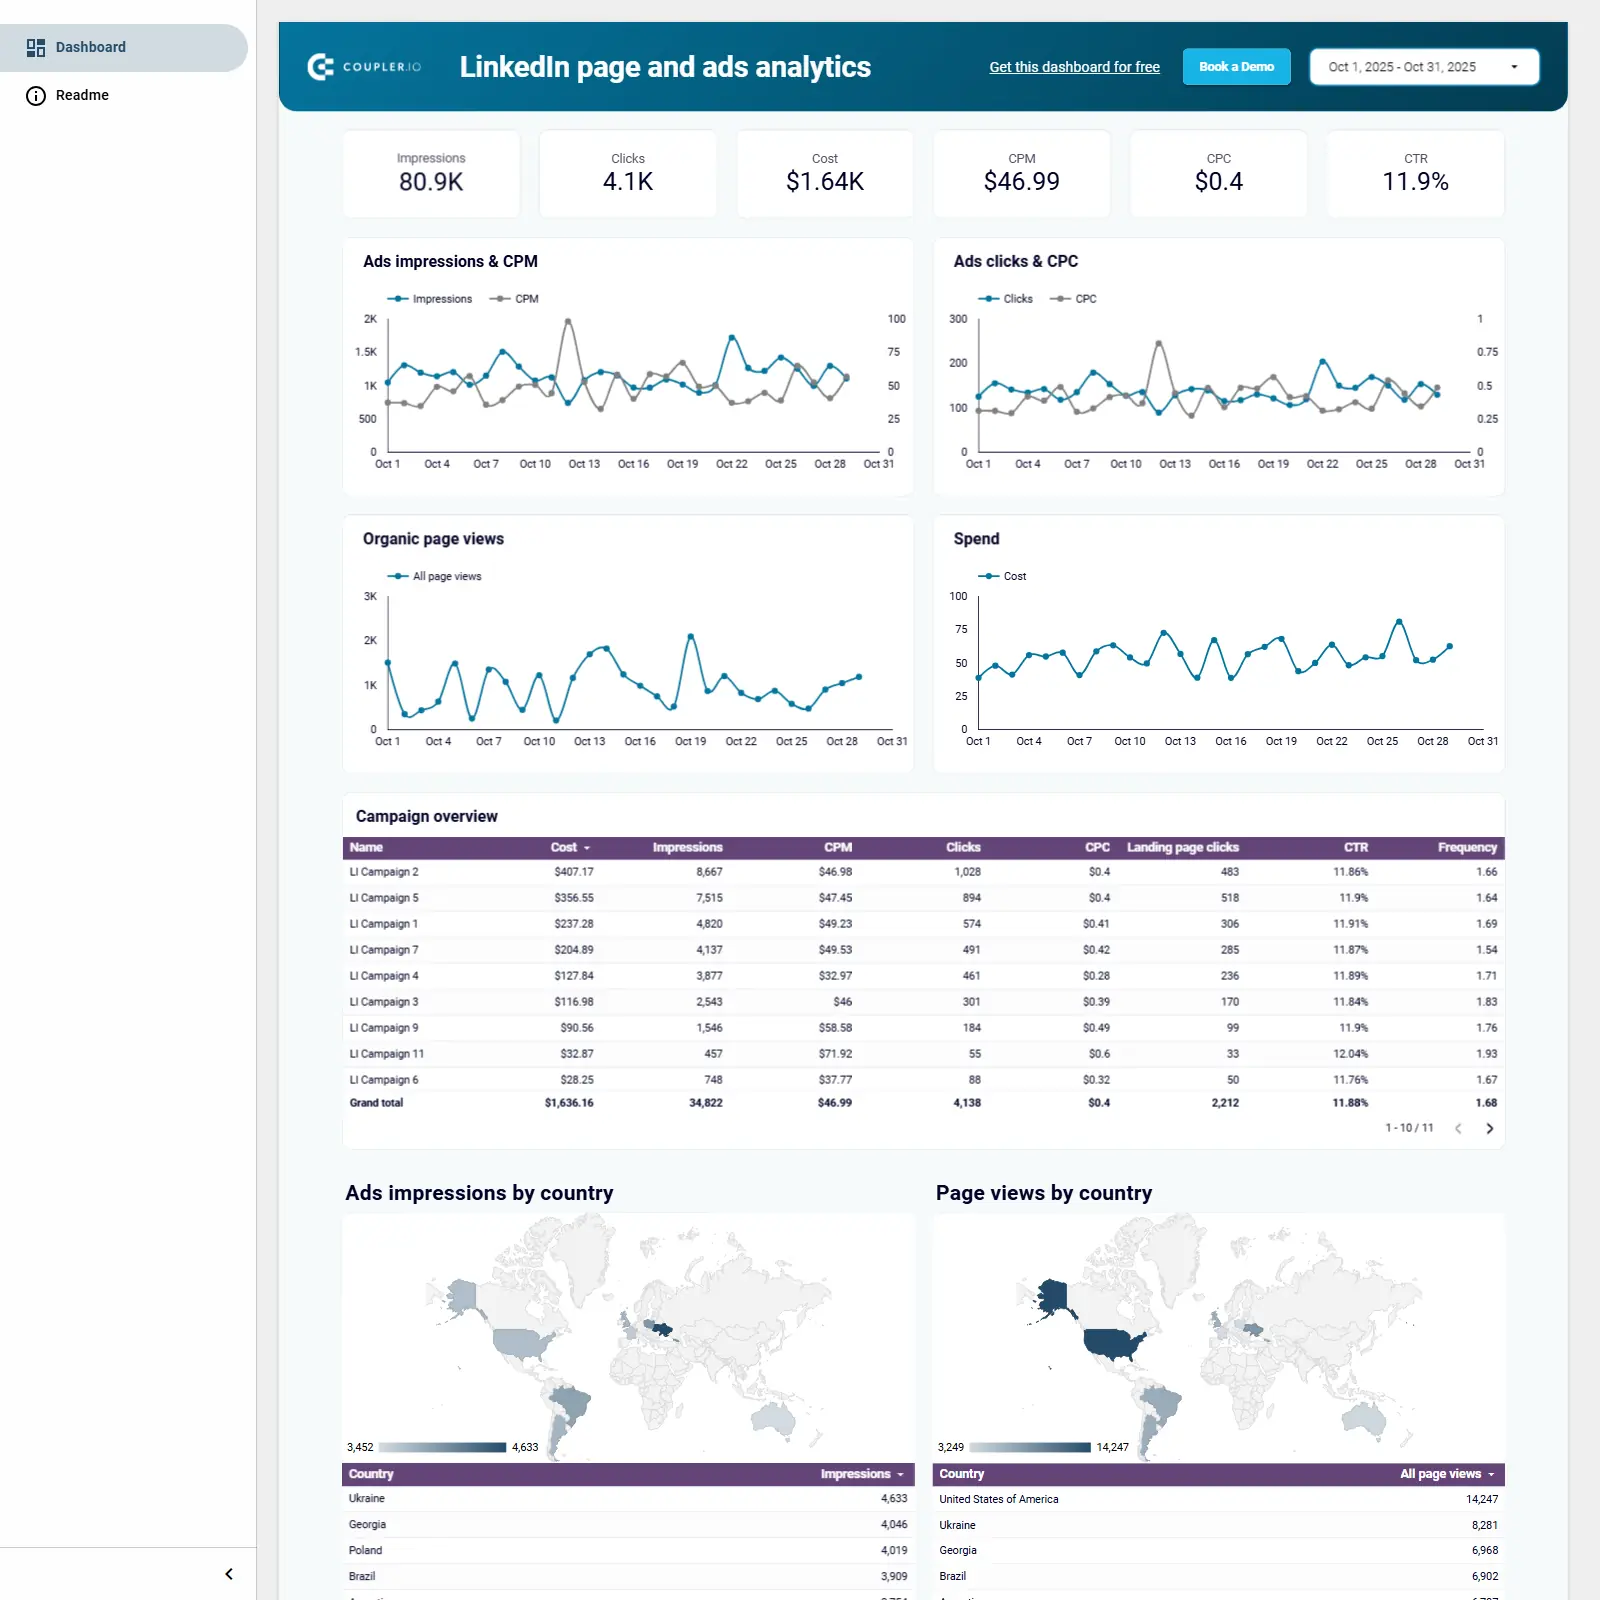
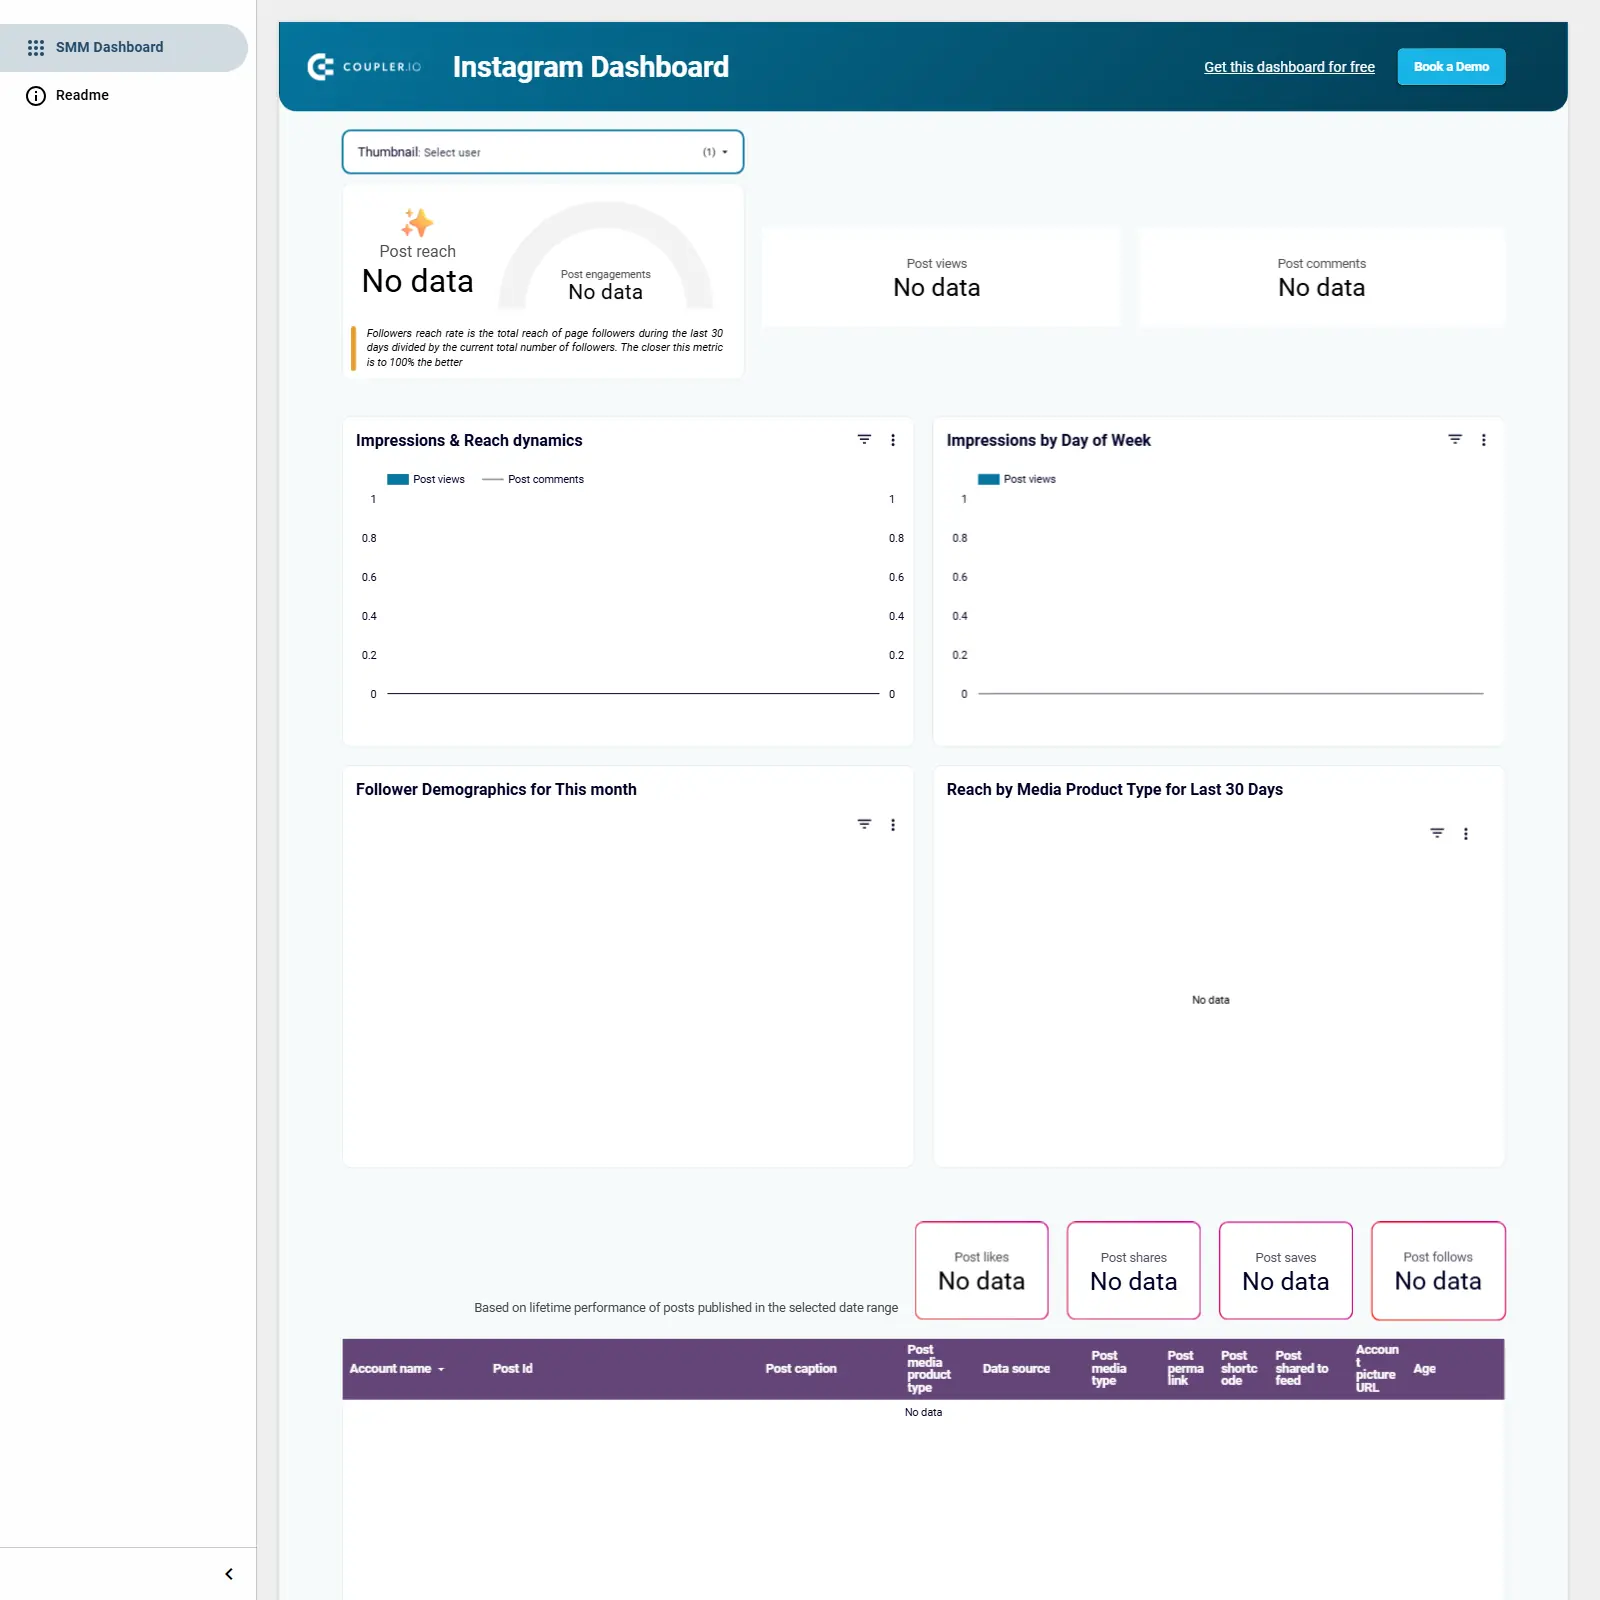
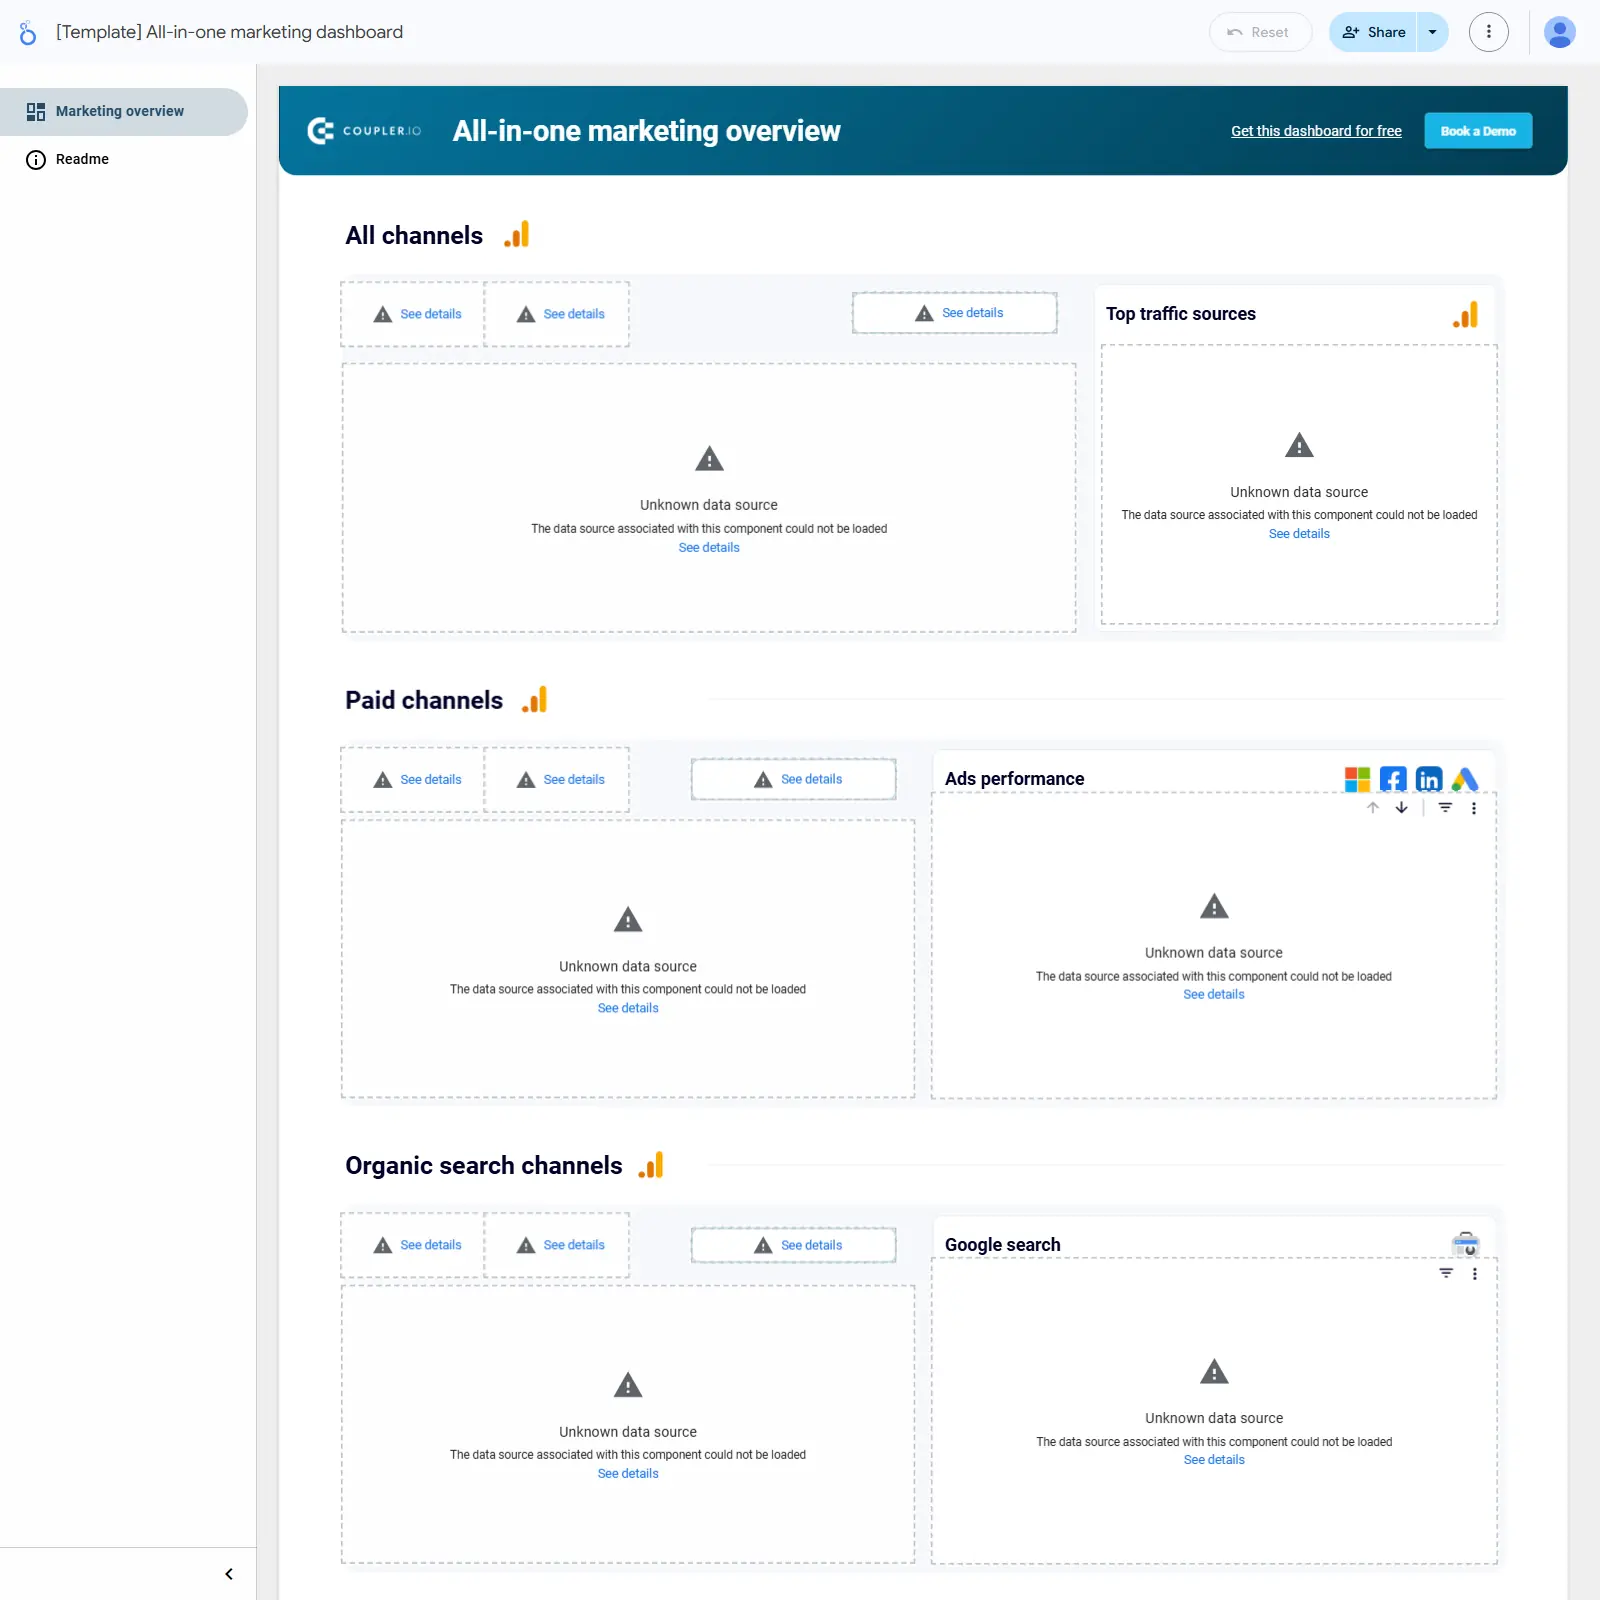
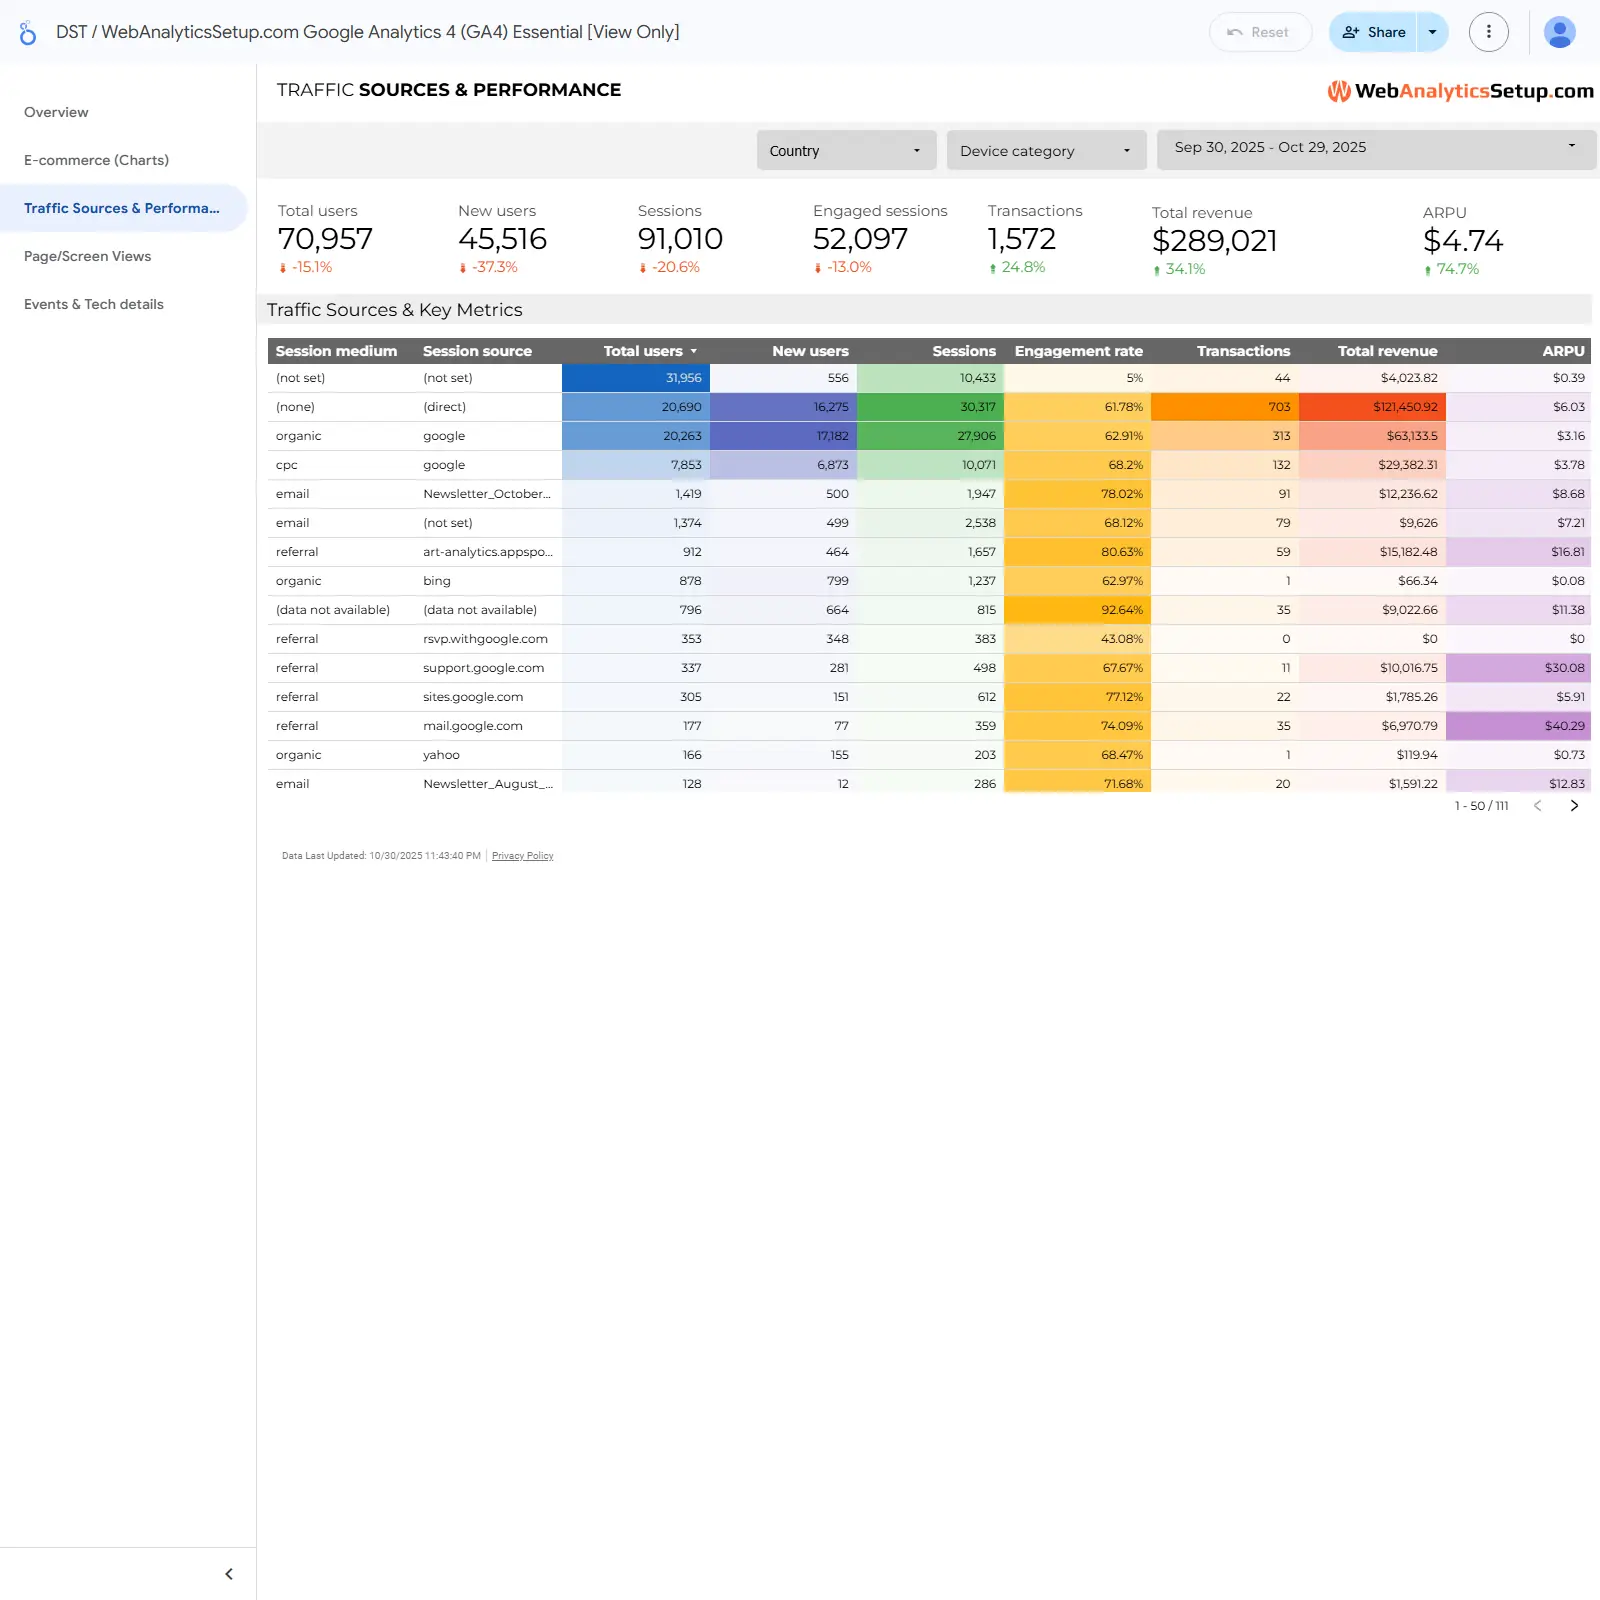
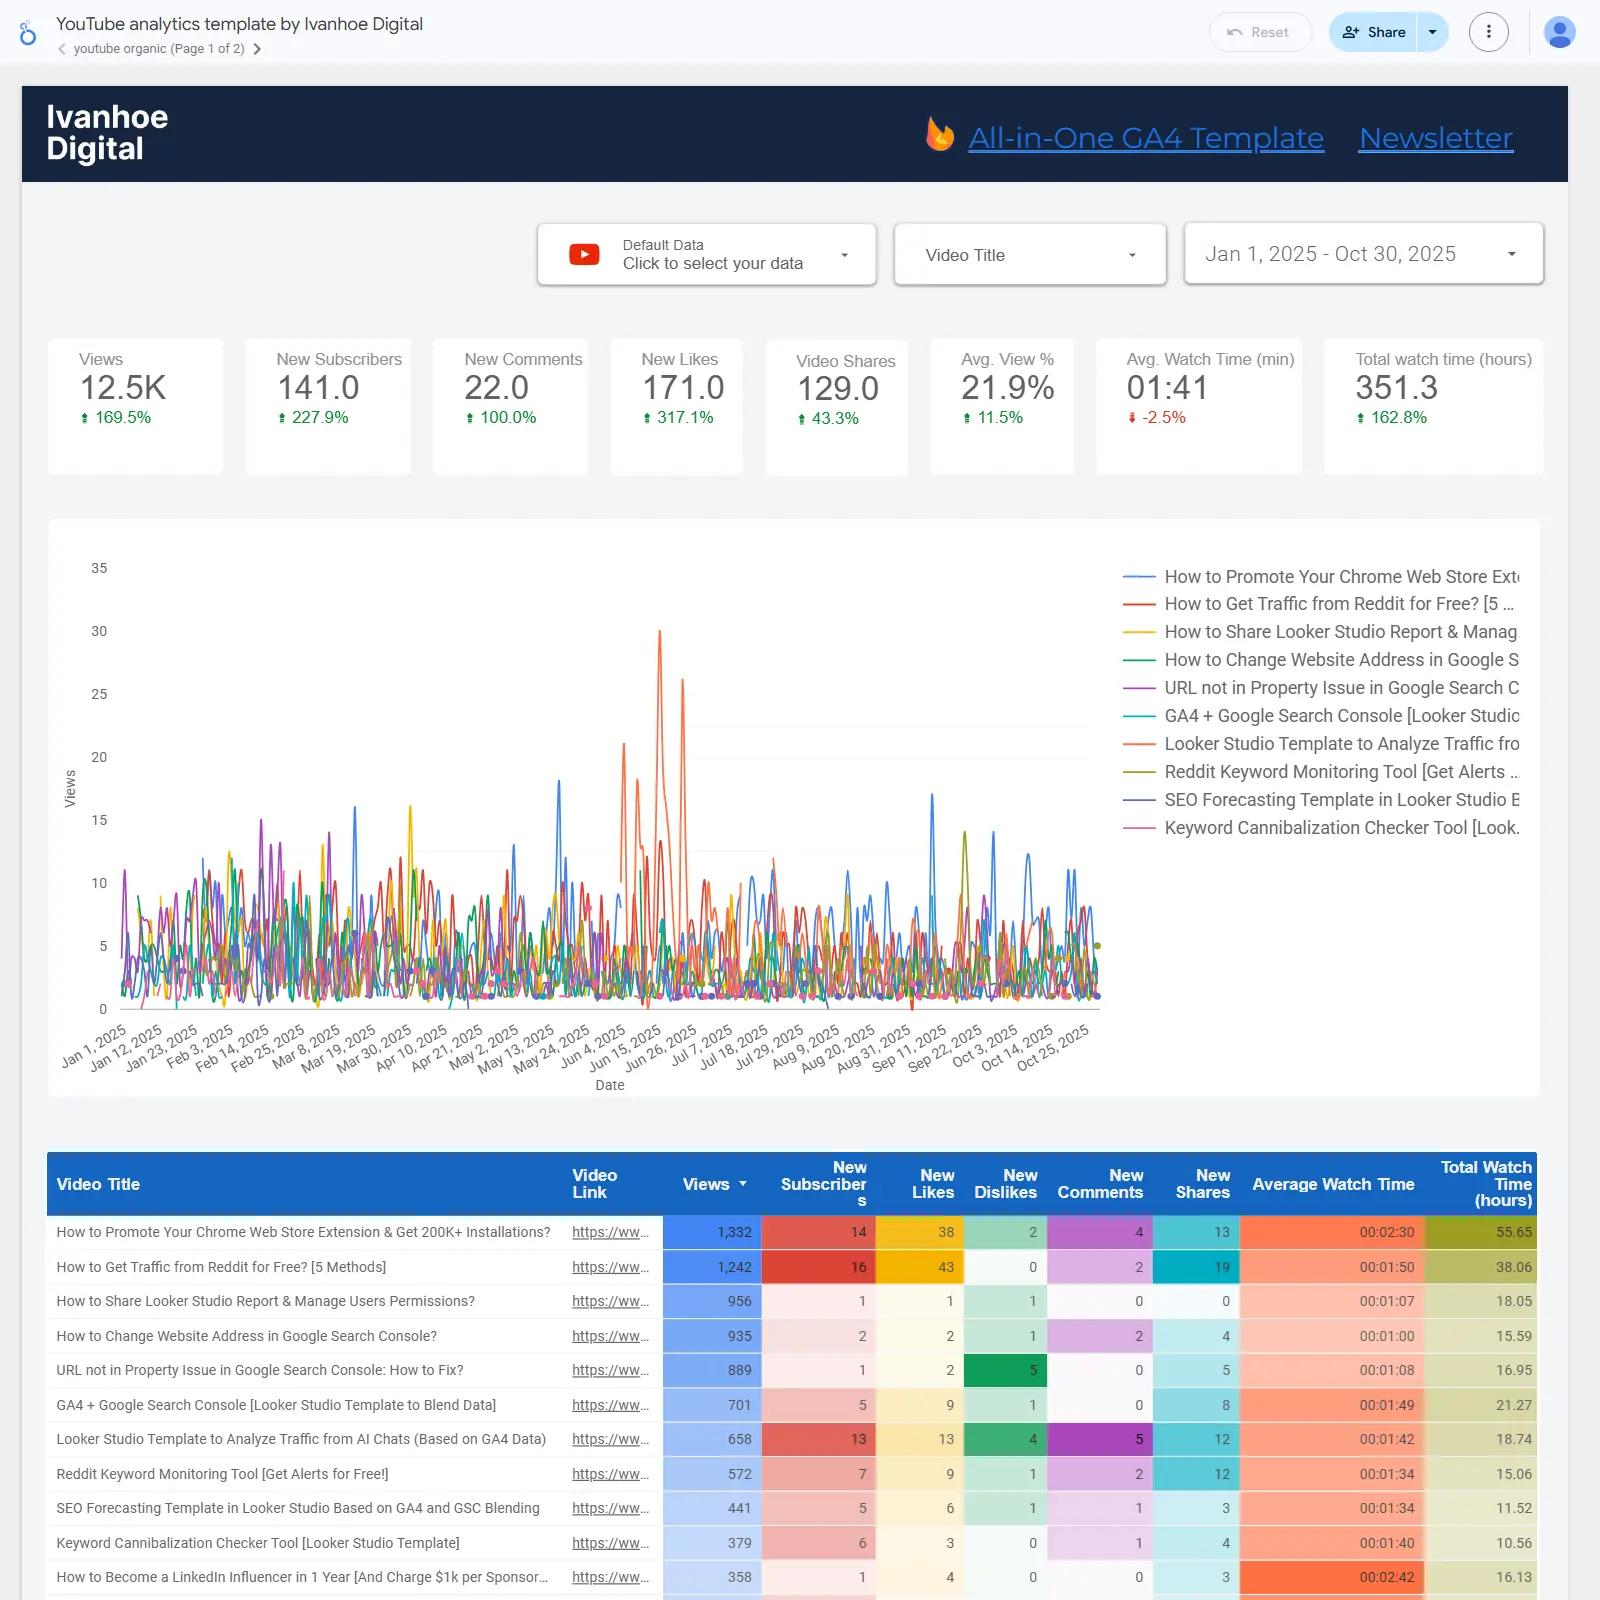
Analyze Facebook Page performance in Looker Studio with unified views for Overview, Audience, Content Performance, Page Reactions, Video Performance, and Messenger Insights. Track page likes, impressions, reach, engagement, clicks, shares, CTR, and conversions to prove ROI and spot wins. Break down results by age, gender, and location to identify target segments and find the best posting times across days and hours. Compare photos, videos, and links to uncover top formats and measure the impact of paid promotions. White‑label design, custom metrics, historical data, scheduled email alerts, filters, goals, and data blending support agency and in‑house reporting.
Free
Facebook Organic competitors report template cover image
Facebook Organic competitors report template

Benchmark Facebook performance against competitors in Looker Studio with engagement, followers, reach, and content insights.

Facebook Insights Competitors template for Looker Studio to benchmark your Facebook page against rival pages using public data. Track engagement rate, follower growth, post reach, reactions, comments, and post frequency across competitors and time periods. Identify which competitors lead in growth or engagement and spot content strategies that outperform yours. Ideal for social media teams and agencies seeking actionable competitor intelligence inside Looker Studio. Built by Porter with the Facebook Organic Competitor connector for reliable, long‑term insights.
Free
Paid media Creative performance report template cover image
Paid media Creative performance report template

Monitor paid media creative performance and video funnels across campaigns to quickly find and scale winning ads.

A paid media creatives analysis template for Looker Studio focused on measuring ad performance across channels. Track impressions, clicks, spend, CTR, CPC, conversions, conversion rate, reach, frequency, video views, watch time, and engagements by campaign, platform, audience, device, and location. Includes a video funnel from 3‑second views through 25%, 50%, 75%, 95%, and 100% plays plus creative-level tables to pinpoint winning and underperforming assets. Works with Facebook, LinkedIn, TikTok, and Twitter Ads connectors or Google Sheets. Built for PPC teams to optimize creative mix, targeting, and budget allocation.
Free
Google Ads and Meta Ads campaign performance dashboard cover image
Google Ads and Meta Ads campaign performance dashboard

Cross‑channel Google Ads vs Meta Ads dashboard for fast spend, reach, and efficiency comparisons by day and campaign.

Side‑by‑side view of Google Ads and Meta Ads performance that consolidates spend, impressions, clicks, CTR, CPC/CPM, and trend lines over time. Highlights daily spend dynamics and key totals for each network to spot spikes, dips, and efficiency shifts quickly. Campaign-level tables for both platforms surface winners and underperformers so you can reallocate budget with confidence. Designed for quick cross‑channel comparisons and monthly performance reviews without digging through multiple ad accounts.
Free
Free Facebook Ads Budget Dashboard Template for Looker Studio cover image
Free Facebook Ads Budget Dashboard Template for Looker Studio

Real-time Facebook Ads budget and revenue tracking to optimize spend by campaign.

Real-time Facebook Ads budget monitoring focused on controlling spend with PPC metrics and revenue outcomes. Highlights credit spend, ad set budget remaining, campaign revenue share, and revenue trends to reveal where money is going. Measures variance to budget and links spend to conversions and sales for sharper planning. Guides budget reallocation toward high‑performing campaigns while reducing wasted spend.
Free
Facebook Ads Lead generation report by cover image
Facebook Ads Lead generation report by

Facebook Ads lead gen insights across leads, CPL, spend, top ads, placements, demographics, and regions for smarter targeting and budget decisions.

Built for Facebook lead generation using the standard Lead conversion. Track total leads, cost per lead, and spend with time trends. Identify top ads by leads and CPL to see what deserves more budget. Compare performance by platform and placement, audience demographics, and region on map views. Use the insights to refine targeting and scale the channels delivering the lowest CPL.
Free
Facebook Ads overall Performance cover image
Facebook Ads overall Performance

Track Facebook Ads spend, reach, clicks, conversions, and CPA with side‑by‑side campaign and ad comparisons to optimize budgets fast.

All-in-one Facebook Ads reporting focused on the metrics that drive ROI. Monitor spend, impressions, reach, frequency, clicks, CTR, CPC, conversions, and cost per conversion with clear trend and comparison visuals. Compare campaign and ad performance side by side to spot winners, wasted spend, and creative fatigue. Surface website conversion trends and costs to guide bid and budget adjustments. Ideal for quickly identifying optimization opportunities across accounts, campaigns, and ads.
Free
Facebook Ads report template cover image
Facebook Ads report template

Looker Studio template for Facebook Ads that surfaces conversions, engagement, spend efficiency, and audience insights to optimize PPC.

Facebook Ads performance template for Looker Studio focused on CPC, CTR, conversion rate, ROAS, spend, and returns. Prebuilt views for Conversion, Engagement, Visibility, Creative performance, Audience, and conversions vs. amount spent spotlight winners and underperformers. Demographic insights across age, gender, and location reveal the audiences and placements that drive results. White‑label design, custom metrics, data blending, historical data, and scheduled email alerts support client‑ready reporting and deeper analysis. Built by Porter’s marketing team and used by 40k+ marketers to optimize campaigns.
Free
ActiveCampaign report template cover image
ActiveCampaign report template

ActiveCampaign email, automation, and deals analytics in one Looker Studio dashboard for fast B2B performance insights.

ActiveCampaign performance tracking for B2B teams, combining email, automation, and deals data in Looker Studio. Monitor core metrics like opens, click-through rate, bounces, unsubscribes, sends, and deliveries alongside account totals for contacts, lists, tags, campaigns, and deals. Assess campaign effectiveness with subscriber clicks and replies, and review automation progress and completed elements to spot friction. Segment results by audience, region, or campaign type to uncover trends and double down on what converts. Use it to quickly answer which campaigns perform best and where churn or drop-offs happen.
Free
Global Search Console for SEO cover image
Global Search Console for SEO

Google Search Console rank and CTR analysis by query with daily trends and opportunity bubbles.

Google Search Console keyword rank monitoring by query, focused on performance trends and opportunities. Track daily average position for the top queries and compare changes versus the previous period. Analyze CTR against average position for the top 100 queries, with bubble size representing impressions to highlight high‑impact terms. Segment results by date range, device category, country, or drill into a specific query. Ideal for spotting ranking shifts and prioritizing SEO actions.
Free
Keyword Cannibalization Checker cover image
Keyword Cannibalization Checker

Find and fix keyword cannibalization with GSC data to prioritize consolidation and internal linking opportunities.

Pinpoint keyword cannibalization using Google Search Console data to see which keywords trigger multiple competing pages. A ranked table pairs each query with the landing pages that appear for it, alongside impressions, clicks, CTR, and average position to prioritize fixes. Surface quick internal linking wins by identifying pages already considered relevant for the same query. Make informed decisions to consolidate or retarget content—or create new pages—so the right URL ranks and captures more traffic. Ideal for SEO and ecommerce teams aiming to protect and grow organic visibility.
$19
YouTube analytics cover image
YouTube analytics

YouTube analytics template that blends channel metrics and Google Ads data to find winning videos and engagement trends.

Tracks YouTube performance across organic and paid traffic with scorecards for views, subscribers, comments, likes, shares, watch time, and view rate. Visualizes daily trends per video and compares results to previous periods to spot spikes and drops quickly. Highlights top videos with a heat-mapped table and direct links, plus a pivot that breaks out per‑video view counts by date. Combines YouTube Studio data with Google Ads to reveal how campaigns drive video outcomes and ROI. Supports multiple channels—ideal for creators and agencies managing several accounts.
Free
LinkedIn Ads creatives dashboard cover image
LinkedIn Ads creatives dashboard

LinkedIn Ads creatives analysis with ad-level metrics, trend charts, and spend efficiency insights.

LinkedIn Ads creatives performance tracking focused on comparing ad-level results across campaigns. Monitor impressions, clicks, CTR, CPC, CPM, spend, conversions, and engagement to spot winning creatives and underperformers. Trend charts for impressions vs. CPM, clicks vs. CPC, and spend dynamics reveal pacing and efficiency over time. Ideal for marketers and agencies optimizing LinkedIn ad messaging, visuals, and budgets.
Free
Multi-channel Marketing performance report template cover image
Multi-channel Marketing performance report template

Unified Looker Studio dashboard to compare multi‑channel marketing performance across ads, social, SEO, and web analytics.

Multi‑channel marketing performance template that unifies paid, organic, and social results in one Looker Studio view. Track core metrics—impressions, clicks, spend, CTR, CPC, conversions, CAC, engagement, video views, sessions, page views, and keyword rank—across channels and campaigns. Compare efficiency and ROI across Google Ads, Facebook Ads, LinkedIn, TikTok, Twitter, GA4, and Search Console to see what actually drives growth. Built for marketers and agencies to monitor performance and reallocate budget with confidence. White‑label ready with custom metrics and data blending for a single source of truth.
Free