Category: Sales

The best free & paid Looker Studio templates, curated and quality-ranked for data reporting.

Clear All

Showing 1 - 40 of 56

GA4 Full Funnel 44 E-Commerce Metrics cover image
GA4 Full Funnel 44 E-Commerce Metrics

GA4 e-commerce funnel map with 44 metrics and guided insights to find drop‑offs and boost conversions.

GA4 e-commerce funnel template that maps 44 metrics from traffic to revenue using a metrics-tree approach. Includes two metrics maps (full 44 and a 10‑metric focus) and 47 pages designed to pinpoint drop‑offs and the levers that move sales. Each metric comes with trends, breakdowns by audience, device, geography, and channel, connected metrics, plain‑language explanations, and 260+ brainstorming ideas. Ideal for diagnosing changes in add‑to‑cart, checkout, purchases, and revenue, then prioritizing tactics to lift CVR and AOV. Requires GA4 with e‑commerce events enabled.
$0|$199|$299
Woocommerce Google Analytics 4 with Funnel cover image
Woocommerce Google Analytics 4 with Funnel

Unified WooCommerce + GA4 ecommerce dashboard with 17 pages covering sales, acquisition, product performance, audience, and conversion funnels.

17-page Looker Studio template that unifies WooCommerce sales and GA4 behavior for a single, end-to-end view of ecommerce performance. Monitor net and gross sales, orders, AOV, customers, conversion rate, sessions, and recurring users with MoM/YoY comparisons and seasonal trends. Analyze products, brands, and countries to spot best-sellers, yield, and growth opportunities across channels and devices. Acquisition, audience, and recurrence pages reveal which sources and buyer types drive revenue and retention. A complete ecommerce funnel—plus separate mobile and desktop funnels—pinpoints drop‑offs and guides conversion improvements, with a quick setup tutorial using free WooCommerce and GA4 connectors.
$104.62
Google Analytics 4 Google Ads Full Report cover image
Google Analytics 4 Google Ads Full Report

Complete GA4 + Google Ads template for end‑to‑end website, conversion, campaign, and keyword analysis with MoM/YoY insights.

13-page Looker Studio template that blends Google Analytics 4 and Google Ads data to monitor website and campaign performance end-to-end. Track sessions, users, events, conversion rate and value with MoM and YoY comparisons across audience, acquisition, pages, and conversions. Break down traffic by channel, device, country, and landing page, highlight top pages and events, and analyze where conversions happen and the steps users take. Drill into Google Ads campaigns and keywords with clicks, impressions, CTR, CPC, conversions, cost, cost/conversion, and auction insights. Built to guide daily, weekly, and monthly decision-making across paid and organic growth.
$93.19
All in One GA4 Google Ads GSC Report focused on ecommerce cover image
All in One GA4 Google Ads GSC Report focused on ecommerce

All-in-one ecommerce performance template unifying GA4, Google Ads, and GSC with MoM/YoY insights.

Integrated ecommerce analytics across GA4, Google Ads, and Google Search Console, covering audience, acquisition, pages, sales, funnels, and recurrence. Month-over-month and year-over-year comparisons spotlight trends in revenue, users, campaigns, keywords, and search queries. Advanced GSC visualizations and calculated fields reveal high-impact pages, countries, and queries that drive conversions. Ideal for online stores needing a single source of truth to optimize marketing and merchandising decisions using free native connectors.
$104.85
Sales KPI dashboard for Pipedrive cover image
Sales KPI dashboard for Pipedrive

Comprehensive sales overview for revenue, win rate, losses, and rep performance with deal-level insights.

Sales performance template focused on revenue growth, win rate, and pipeline health. Tracks closed amount, closed deals, average deal size, close rate, median sales cycle, and lost value. Highlights trends in closed vs. lost value, top closed and top lost deals, and loss reasons such as budget constraints or pricing. Compares rep results with best and worst owners by close amount to pinpoint coaching opportunities. Includes dedicated views for sales pipeline and team performance for a complete CRM snapshot.
Free
Looker Studio Ecommerce Funnel Template cover image
Looker Studio Ecommerce Funnel Template

GA4 ecommerce funnel template to analyze drop‑offs and optimize conversions across devices, channels, countries, and products.

GA4 ecommerce funnel template for Looker Studio that maps the full buying journey from product view to add‑to‑cart, checkout, and purchase. Spot drop‑offs and conversion bottlenecks by device, channel, country, and product attributes, with trends visualized over time. Surface UX issues and high‑impact opportunities to raise add‑to‑cart and checkout completion rates. Built for GA4 Enhanced Ecommerce to give clear, actionable funnel insights for online stores.
€99
Free GA4 Looker Studio Funnel Template cover image
Free GA4 Looker Studio Funnel Template

Analyze your GA4 ecommerce funnel end‑to‑end and spot drop‑offs by channel, device, country, and product.

A GA4 Ecommerce Funnel template built for Looker Studio to analyze the full shopping journey—from product views and add‑to‑cart through checkout and transactions. Pinpoint where users drop off at each step and compare conversion rates over time. Break results down by channel, device, country, and product to uncover UX issues and high‑performing segments. Ideal for conversion rate optimization, merchandising, and marketing performance insights.
€99
Complete GA4 Ecommerce Dashboard Funnel cover image
Complete GA4 Ecommerce Dashboard Funnel

GA4 ecommerce dashboard with MoM/YoY views, advanced funnels, and deep product, channel, audience, and recurrence analysis.

Comprehensive GA4 ecommerce dashboard for tracking revenue, transactions, conversion rate, and buyer behavior across products, channels, devices, and countries. Includes MoM and YoY views, detailed product and channel performance, and monthly evolution of users, items viewed, and purchases. Offers both Looker Studio native funnels and FunnelGraph funnels, plus separate mobile and desktop funnel views. Audience insights by age, gender, user type, and geography highlight growth opportunities. A recurrence section analyzes performance by customer type across last month, the current year, and the last quarter.
$116.51
Google Analytics Ecommerce Annual Report cover image
Google Analytics Ecommerce Annual Report

GA4 ecommerce annual report with year‑over‑year insights across channels, pages, audience, and products.

GA4 ecommerce annual report template that builds a year‑in‑review with clear year‑over‑year comparisons. Covers Overview, Audience, Acquisition, Pages, and Ecommerce to track sessions, users, transactions, revenue, conversion rate, and monthly trends. Surfaces channel and campaign performance, top pages and landing pages, plus audience demographics, geography, device mix, and new vs. returning behavior. Adds product‑level insights such as items purchased, product revenue, and conversion rate to spot winners and growth opportunities.
$81.52
Full Google Analytics 4 Dashboard with Ecommerce cover image
Full Google Analytics 4 Dashboard with Ecommerce

A complete GA4 ecommerce template for MoM and YoY analysis of audience, acquisition, behavior, and revenue drivers.

Analyze full website and ecommerce performance from GA4 in a 10‑page Looker Studio template. Compare month‑over‑month and year‑over‑year users, sessions, channel/device traffic, top pages, sales, conversion rate, and revenue. Explore audience insights like new vs. returning visitors, gender, and countries, plus channel and landing‑page effectiveness. Investigate behavior and events to pinpoint which pages and actions drive results. Monitor ecommerce by product, category, and brand with daily revenue/transactions and sales splits by channel, device, and user type.
$87.36
Shopify orders dashboard cover image
Shopify orders dashboard

Unified Shopify analytics in Looker Studio covering orders, inventory, marketing attribution, and customer insights.

Shopify dashboard templates by Coupler.io bring orders, inventory, marketing, and customer data into Looker Studio for clear, real-time ecommerce tracking. Monitor orders, total sales, average order value, discounts, tax, returns, customers, and processing time, with breakdowns by traffic source and shipping country. Connect Shopify with GA4 and ad platforms to link spend to conversions and ROI, uncover funnel drop‑offs, and optimize budget allocation. Use SKU‑level insights like days of stock remaining to prevent stockouts and plan procurement with confidence. Ideal for store owners and marketers who need a consolidated view of performance and growth levers.
Free
Shopify marketing funnel dashboard cover image
Shopify marketing funnel dashboard

Cross‑channel marketing funnel template that tracks acquisition from impressions to revenue to surface bottlenecks and scale top‑performing channels.

Cross‑channel marketing funnel template that unifies ads, web analytics, ecommerce, and email data to map the path from first impression to purchase. It tracks spend, clicks, CTR, CPC/CPM, new users/customers, orders, total sales, ROI/ROAS, cost per order, and average order value with clear funnel stages. Weekly breakdowns and trend charts reveal drop‑offs between stages and highlight the campaigns and emails driving qualified leads and revenue. Ideal for optimizing budgets, improving product and checkout flow, and proving impact across Facebook Ads, Google Ads, GA4, Klaviyo/Mailchimp, and Shopify.
Free
GA4 Google Ads Report focused on conversions cover image
GA4 Google Ads Report focused on conversions

Unified GA4 + Google Ads conversion reporting with MoM/YoY analysis for audience, acquisition, pages, campaigns, and keywords.

Conversion-focused Looker Studio template that unifies Google Analytics 4 and Google Ads to reveal how marketing efforts drive conversions. Compare performance MoM and YoY across audience, acquisition, top pages, campaigns, and keywords to spot trends and winners fast. Visualize events and conversions over the last 12 months and see which channels and campaigns contribute most to results. Ideal for performance marketers and decision-makers who need clear insights to optimize spend and growth.
$102.52
E-commerce report template cover image
E-commerce report template

Looker Studio template for Shopify, GA4, Facebook Ads, and Google Ads that tracks sales, conversions, and marketing performance by product, customer, and channel.

E‑commerce performance template by Porter for Looker Studio that brings together Shopify, GA4, Facebook Ads, and Google Ads to monitor the full revenue picture. Tracks gross sales, costs, and net sales alongside conversion rate, average order value, and bounce rate. Breaks results down by time, product, customer, and source to pinpoint profitable items and high‑value segments. Includes focused views for retention, funnels, KPIs, and SEO to assess marketing effectiveness across the journey. Helps teams spot behavior patterns and act quickly to increase ROI and growth.
Free
Woocommerce Looker Studio Template cover image
Woocommerce Looker Studio Template

Actionable WooCommerce analytics covering sales, products, customers, geographies, payment methods, and time trends to grow revenue.

WooCommerce performance tracking focused on sales, orders, refunds, and average order value, with clear trends across the last 12 months. Pinpoint top products and categories, see which countries, states, and cities drive revenue, and compare payment methods like cards vs PayPal. Evaluate the impact of coupons and discounts and identify peak buying days and hours to optimize campaigns and inventory. Explore customer behavior and top customers to raise repeat purchases and AOV. Connect via WooCommerce REST API for instant reporting and brand it with your own colors and logo.
€149
Woocommerce Template Complete 5 pages cover image
Woocommerce Template Complete 5 pages

5-page WooCommerce analytics template for Looker Studio with 12‑month trends, MoM/YoY KPIs, and deep dives into orders, products, and countries.

5-page Looker Studio template for WooCommerce that tracks sales, orders, products, customers, and average order value with MoM and YoY comparisons. Visualize 12‑month trends with baseline averages, seasonal year-over-year patterns, and yield by month to understand growth and seasonality. Dig into orders with daily breakdowns, status-level tables, and the busiest days of the week to optimize operations. Compare product performance month-over-month and year-over-year, highlight best sellers, and monitor contribution over the last 12 months. Evaluate markets with country-level trends, top 5 countries by net sales, and the top product per country using a free WooCommerce connector and included tutorial.
$90.85
Shopify store traffic overview dashboard cover image
Shopify store traffic overview dashboard

Shopify + GA4 funnel tracker covering traffic, conversions, customers, orders, and revenue trends.

Ecommerce performance template for Shopify that connects store sales with GA4 traffic to map the full funnel from sessions and views to add‑to‑carts, checkouts, and purchases. Highlights key KPIs like orders, total sales, average order value, and average items per order alongside total and new users. A monthly funnel table and trend charts reveal sales growth, customer acquisition, and conversion bottlenecks. Ideal for spotting what drives revenue and where shoppers drop off.
Free
Shopify report template cover image
Shopify report template

Shopify analytics template for Looker Studio to track sales, customers, products, and marketing performance in one place.

Track end-to-end Shopify performance in Looker Studio with KPIs like orders, net and gross sales, returns, and average order value. Understand customer behavior with metrics for new vs repeat buyers, lifetime value, conversion rate, cart abandonment, and refunds. Evaluate marketing efficiency using traffic source, ad spend, ROAS, and customer acquisition cost. Compare product performance and inventory to highlight best sellers and revenue drivers. Use these insights to optimize campaigns, merchandising, and profitability.
Free
Salesforce sales team performance dashboard cover image
Salesforce sales team performance dashboard

Salesforce sales performance template tracking win/loss, revenue, rep comparisons, and task efficiency.

Looker Studio template for analyzing Salesforce pipeline outcomes and team productivity. Visualizes won and lost opportunities, won/lost amounts, win rate, and reasons for lost deals by rep, opportunity type, size, and lead source. Highlights totals and trends to benchmark performance and spot revenue swings. Adds task analytics—open/closed tasks and median task age—to monitor throughput and remove bottlenecks. Ideal for sales leaders to prioritize coaching, refine tactics, and forecast more accurately.
Free
GA4 Google Ads Dashboard cover image
GA4 Google Ads Dashboard

Unified GA4 + Google Ads dashboard for user behavior, revenue, and campaign performance with audience, keyword, and channel insights.

Unified Looker Studio template combining GA4 and Google Ads to analyze user behavior, conversions, revenue, and ad performance in one place. Covers audience, channel, device, and city-level insights plus keyword analysis, CPA/ROI trends, timelines, top pages, and drop-offs. Smart Interpretations flag notable trends and opportunities so you can optimize budgets and on-site experience faster. Ideal for marketers and analysts focused on growth and attribution clarity.
$214
GA4 Google Ads report focused on ecommerce cover image
GA4 Google Ads report focused on ecommerce

GA4 + Google Ads ecommerce reporting with MoM/YoY insights across sales, audience, acquisition, funnels, campaigns, and keywords.

Ecommerce performance tracking that unifies GA4 and Google Ads to reveal what drives users, sales, and revenue. Covers audience and acquisition trends, top pages, ecommerce performance, and conversion funnels with month‑over‑month and year‑over‑year comparisons. Dedicated Ads views spotlight campaign and keyword results to quickly spot winners and wasted spend. Highlights channel distribution and 12‑month sales patterns for faster decision‑making. Built around free GA4 and Google Ads connectors for a smooth setup.
$102.28
lespl Dashboard Mobile Ecommerce cover image
lespl Dashboard Mobile Ecommerce

Mobile GA4 ecommerce dashboard for revenue, buyers, funnel, and acquisition insights to find growth opportunities.

Mobile ecommerce performance dashboard focused on GA4 metrics to track sales and growth. Highlights revenue, buyers, sessions, and revenue per purchase, plus weekday transaction patterns. Visualizes trends for sessions, initiated purchases, and transactions alongside channel contribution and revenue by acquisition source. Includes a clear ecommerce funnel from add‑to‑cart through purchase and add‑to‑cart volume by weekday. Helps quickly spot top channels and checkout bottlenecks to optimize spend and conversion.
Free
Purchase Funnel Analyzer - Google Analytics 4 cover image
Purchase Funnel Analyzer - Google Analytics 4

GA4 eCommerce funnel dashboard for conversion rates, revenue, and channel performance.

GA4 eCommerce purchase-funnel analytics focused on conversion health and revenue impact. Track gross purchase revenue, ecommerce purchases, total users, first‑time purchasers, and AOV in one view. Compare Cart, Checkout, and Purchase conversion rates over time and diagnose drop‑offs. Break performance down by session source/medium with item views, add‑to‑cart, checkouts, purchases, revenue, and revenue share, with period‑over‑period and year‑over‑year trends.
Free
GA4 Ecommerce Revenue Template cover image
GA4 Ecommerce Revenue Template

GA4 ecommerce dashboard for revenue, conversion, and customer insights by channel, device, and country.

GA4 Ecommerce Revenue Template focused on online store performance across revenue and customer metrics. Tracks users, conversion rate, transactions, customers, total revenue, average order value, revenue per customer, and revenue per user. Reveals trends over time and breaks results down by channel, device category, country, and customer type (first‑time vs returning). Includes views for funnel, customers, products, and acquisition to uncover growth levers and high‑value segments. Built for GA4 data to monitor profitability and scale confidently.
Free
Google Analytics 4 Report for Clients Ecommerce cover image
Google Analytics 4 Report for Clients Ecommerce

GA4 ecommerce client reporting focused on MoM/YoY KPIs, channel/device/demographic insights, and product and page performance.

GA4 ecommerce reporting template built for client updates, combining KPIs and trends on one streamlined report. Monitor users, sessions, new users, transactions, conversion rate, revenue, and AOV with clear MoM and YoY comparisons. Break down performance by acquisition channels, device, country, city, gender, and age to see what segments drive sales. Evaluate landing pages and top-selling products, plus daily revenue and sales with a baseline to spot spikes and drops. Includes a cover page for summaries and conclusions to turn insights into next steps.
$55.87
Ecommerce GA4 Annual Report with Text Fields cover image
Ecommerce GA4 Annual Report with Text Fields

Client-ready GA4 ecommerce annual report with YOY analysis across channels, audience, pages, and product sales, plus text fields for conclusions.

Ecommerce GA4 Annual Report template for online stores to deliver client-ready year-end insights. Covers transactions, revenue, conversion rate, monthly trends, and year-over-year comparisons for sessions, users, and sales. Breaks down results by acquisition channels, campaigns, device, country, demographics, and new vs. returning users, with top pages and landing pages plus improvements/declines. Adds an ecommerce section for items purchased, product yield, and conversion trends, and includes text fields and a cover page to write conclusions and recommendations.
$86.19
Google Ads E-commerce Report by escalix io 2024 cover image
Google Ads E-commerce Report by escalix io 2024

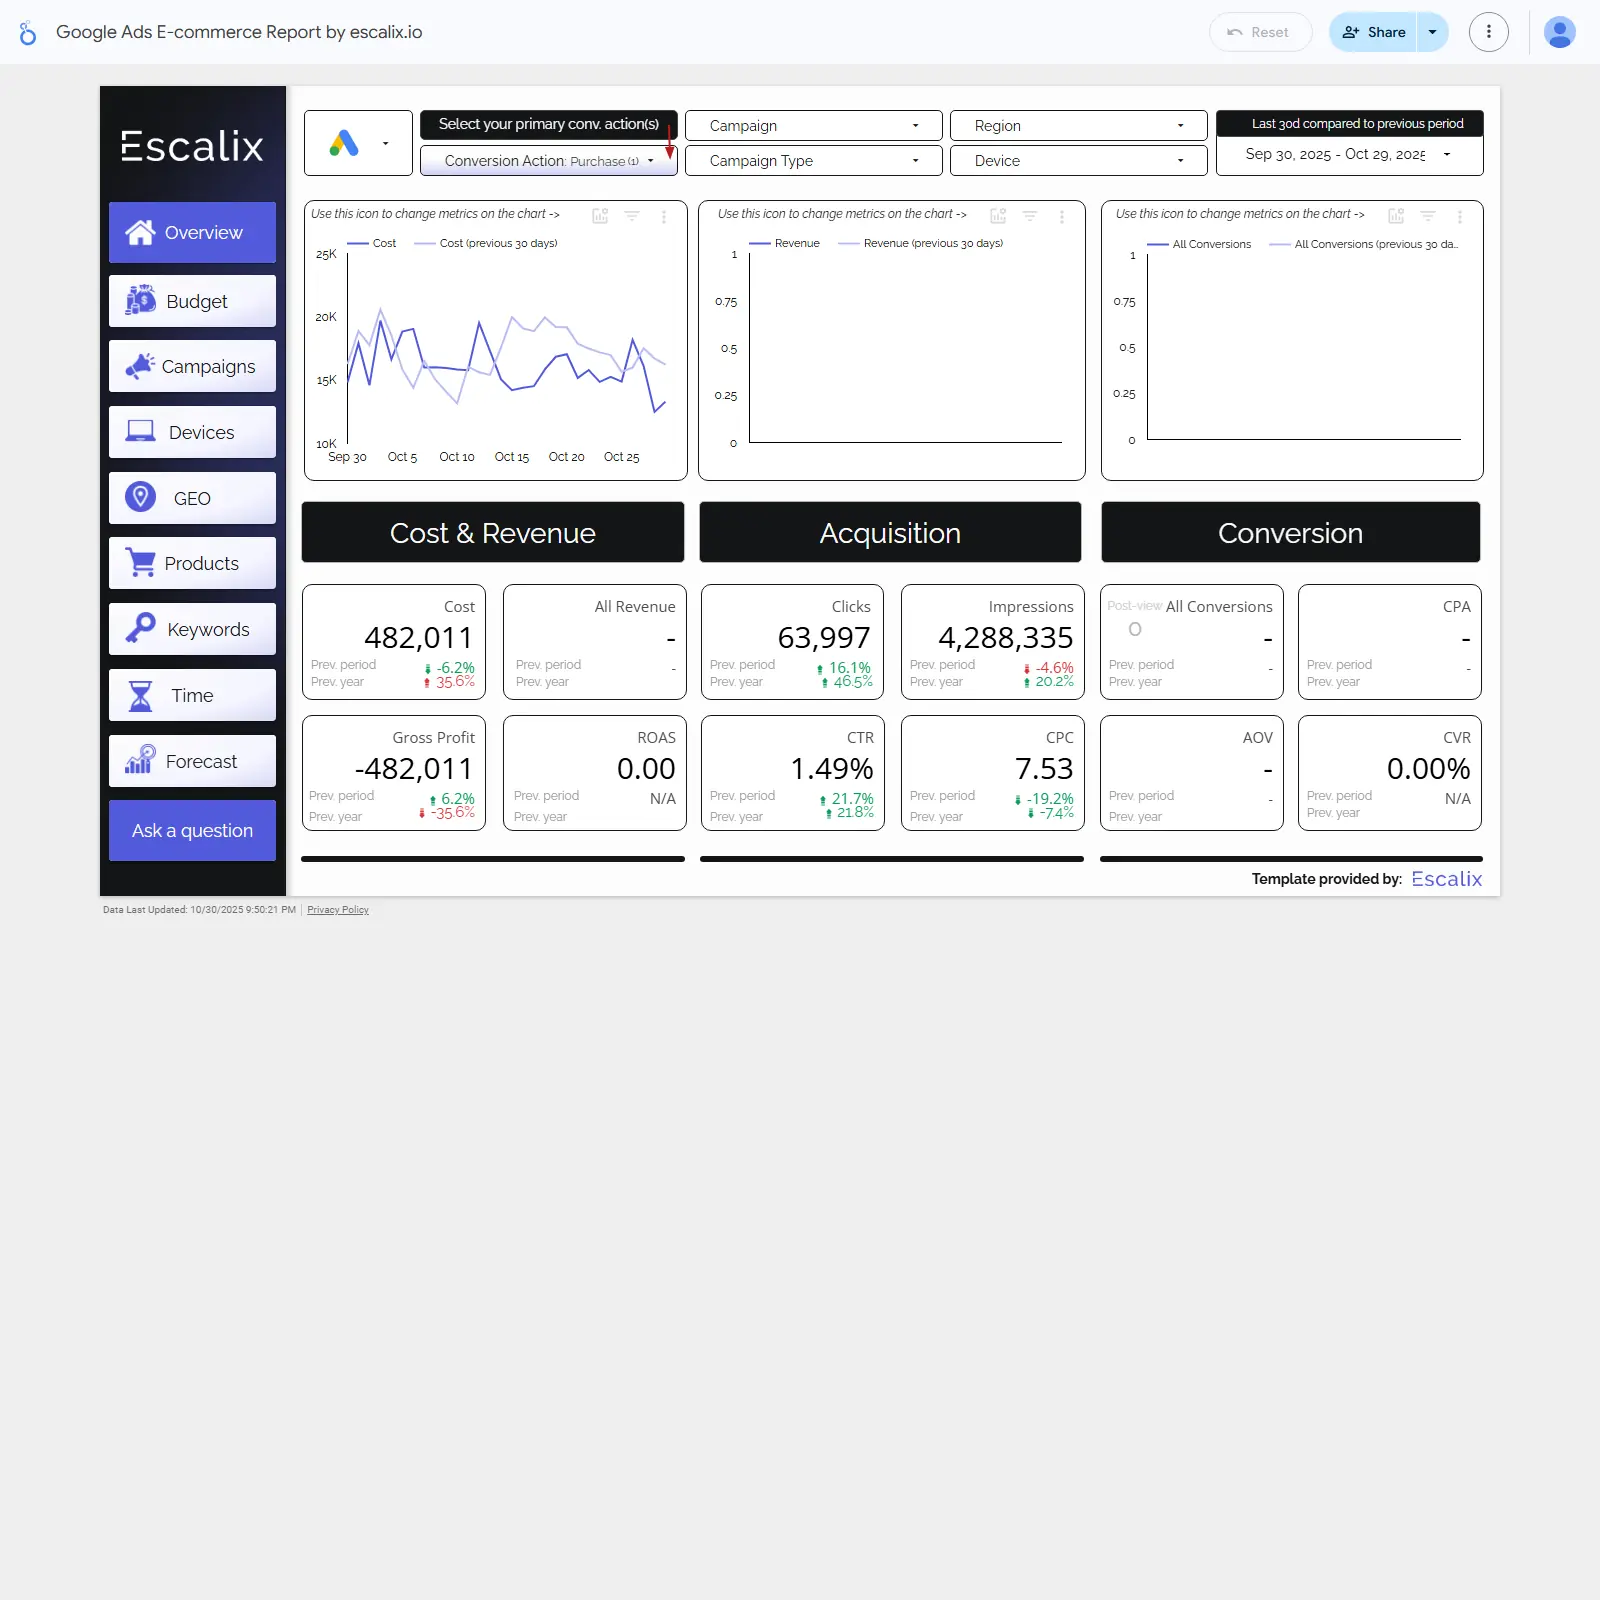
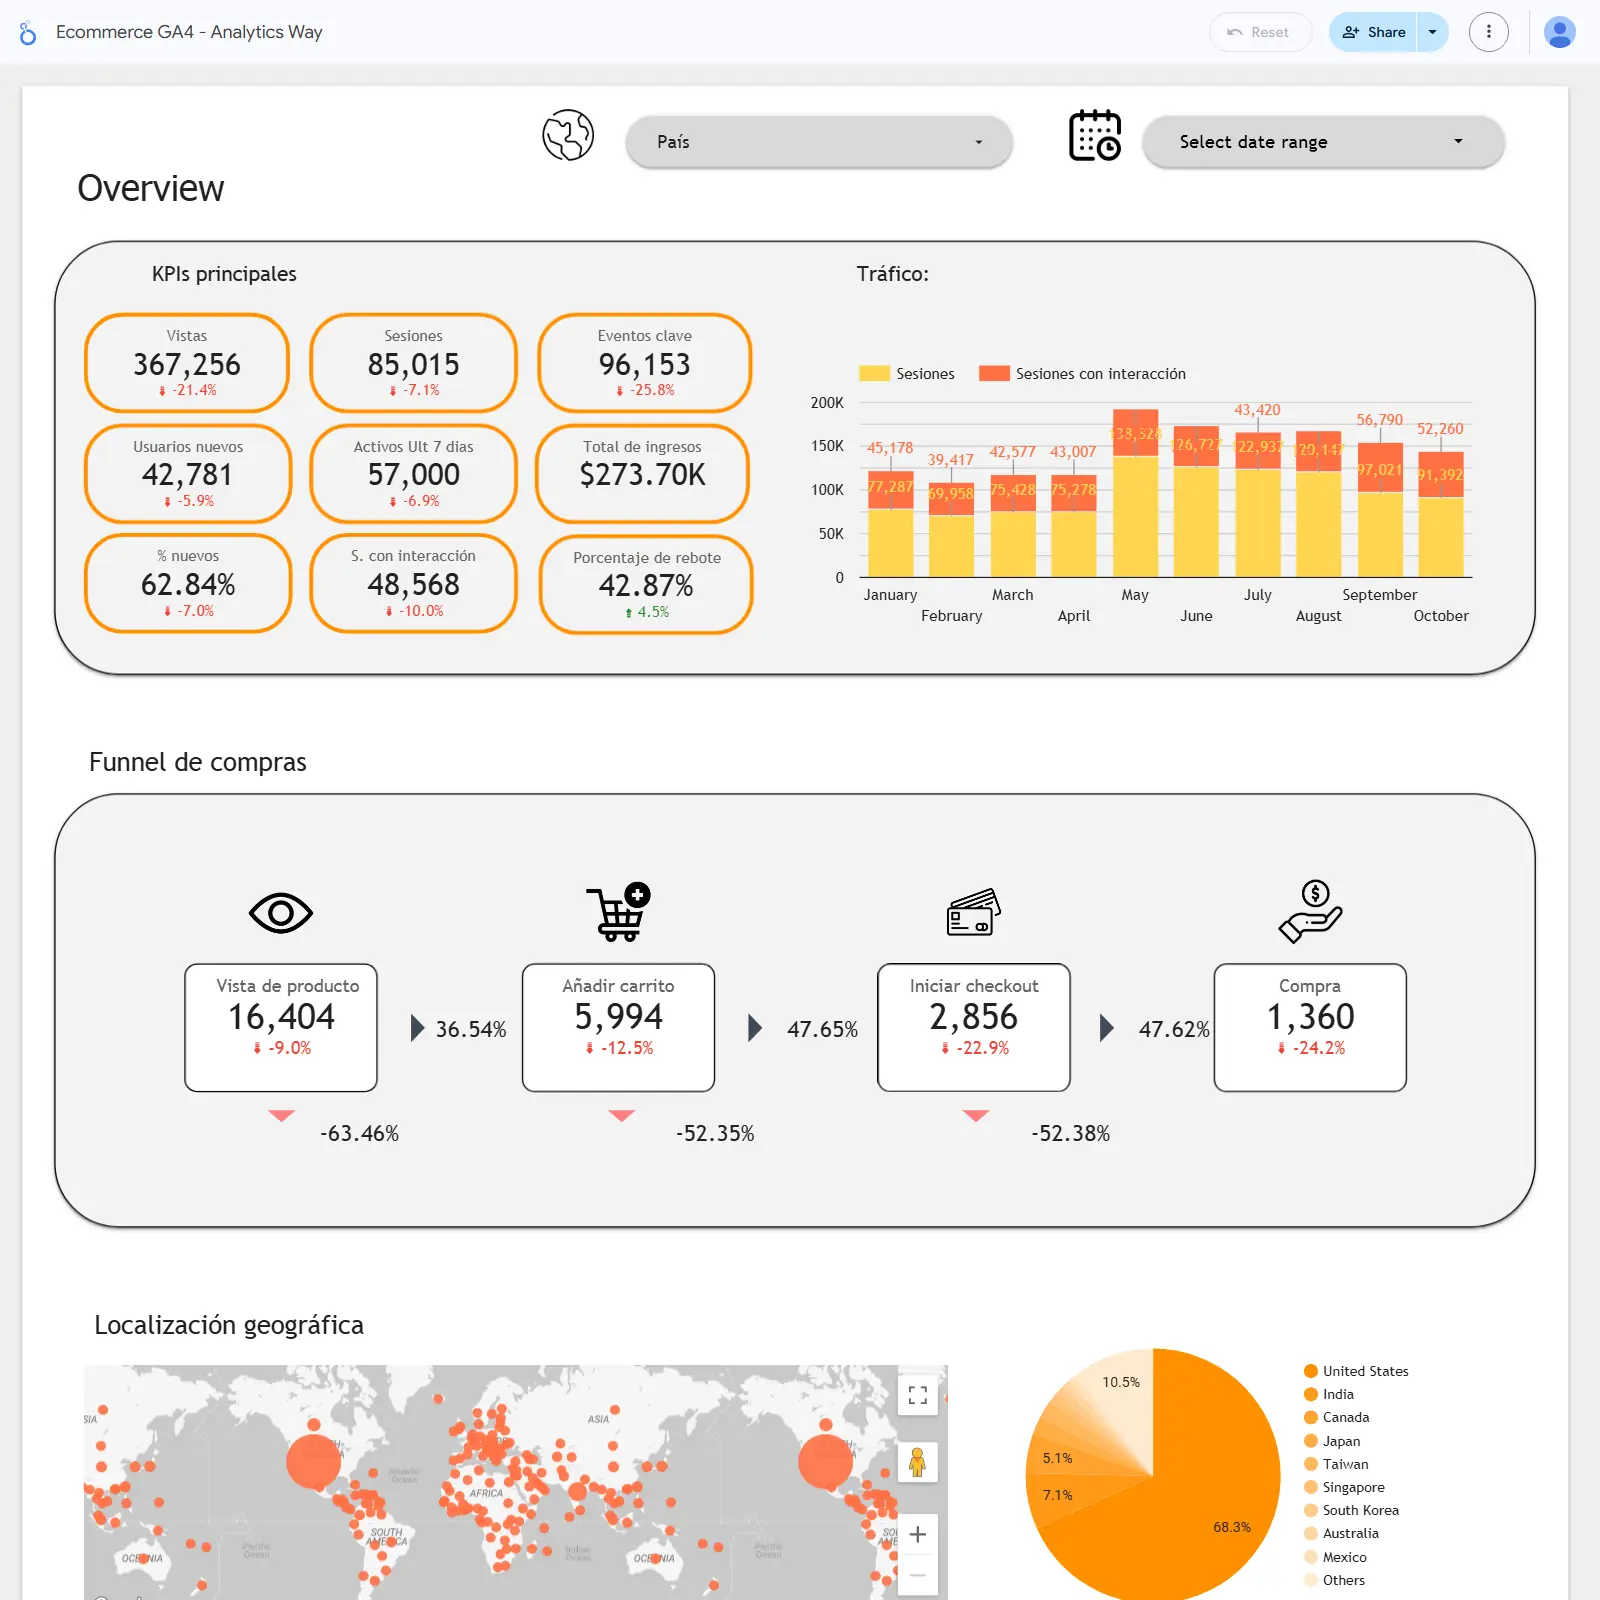
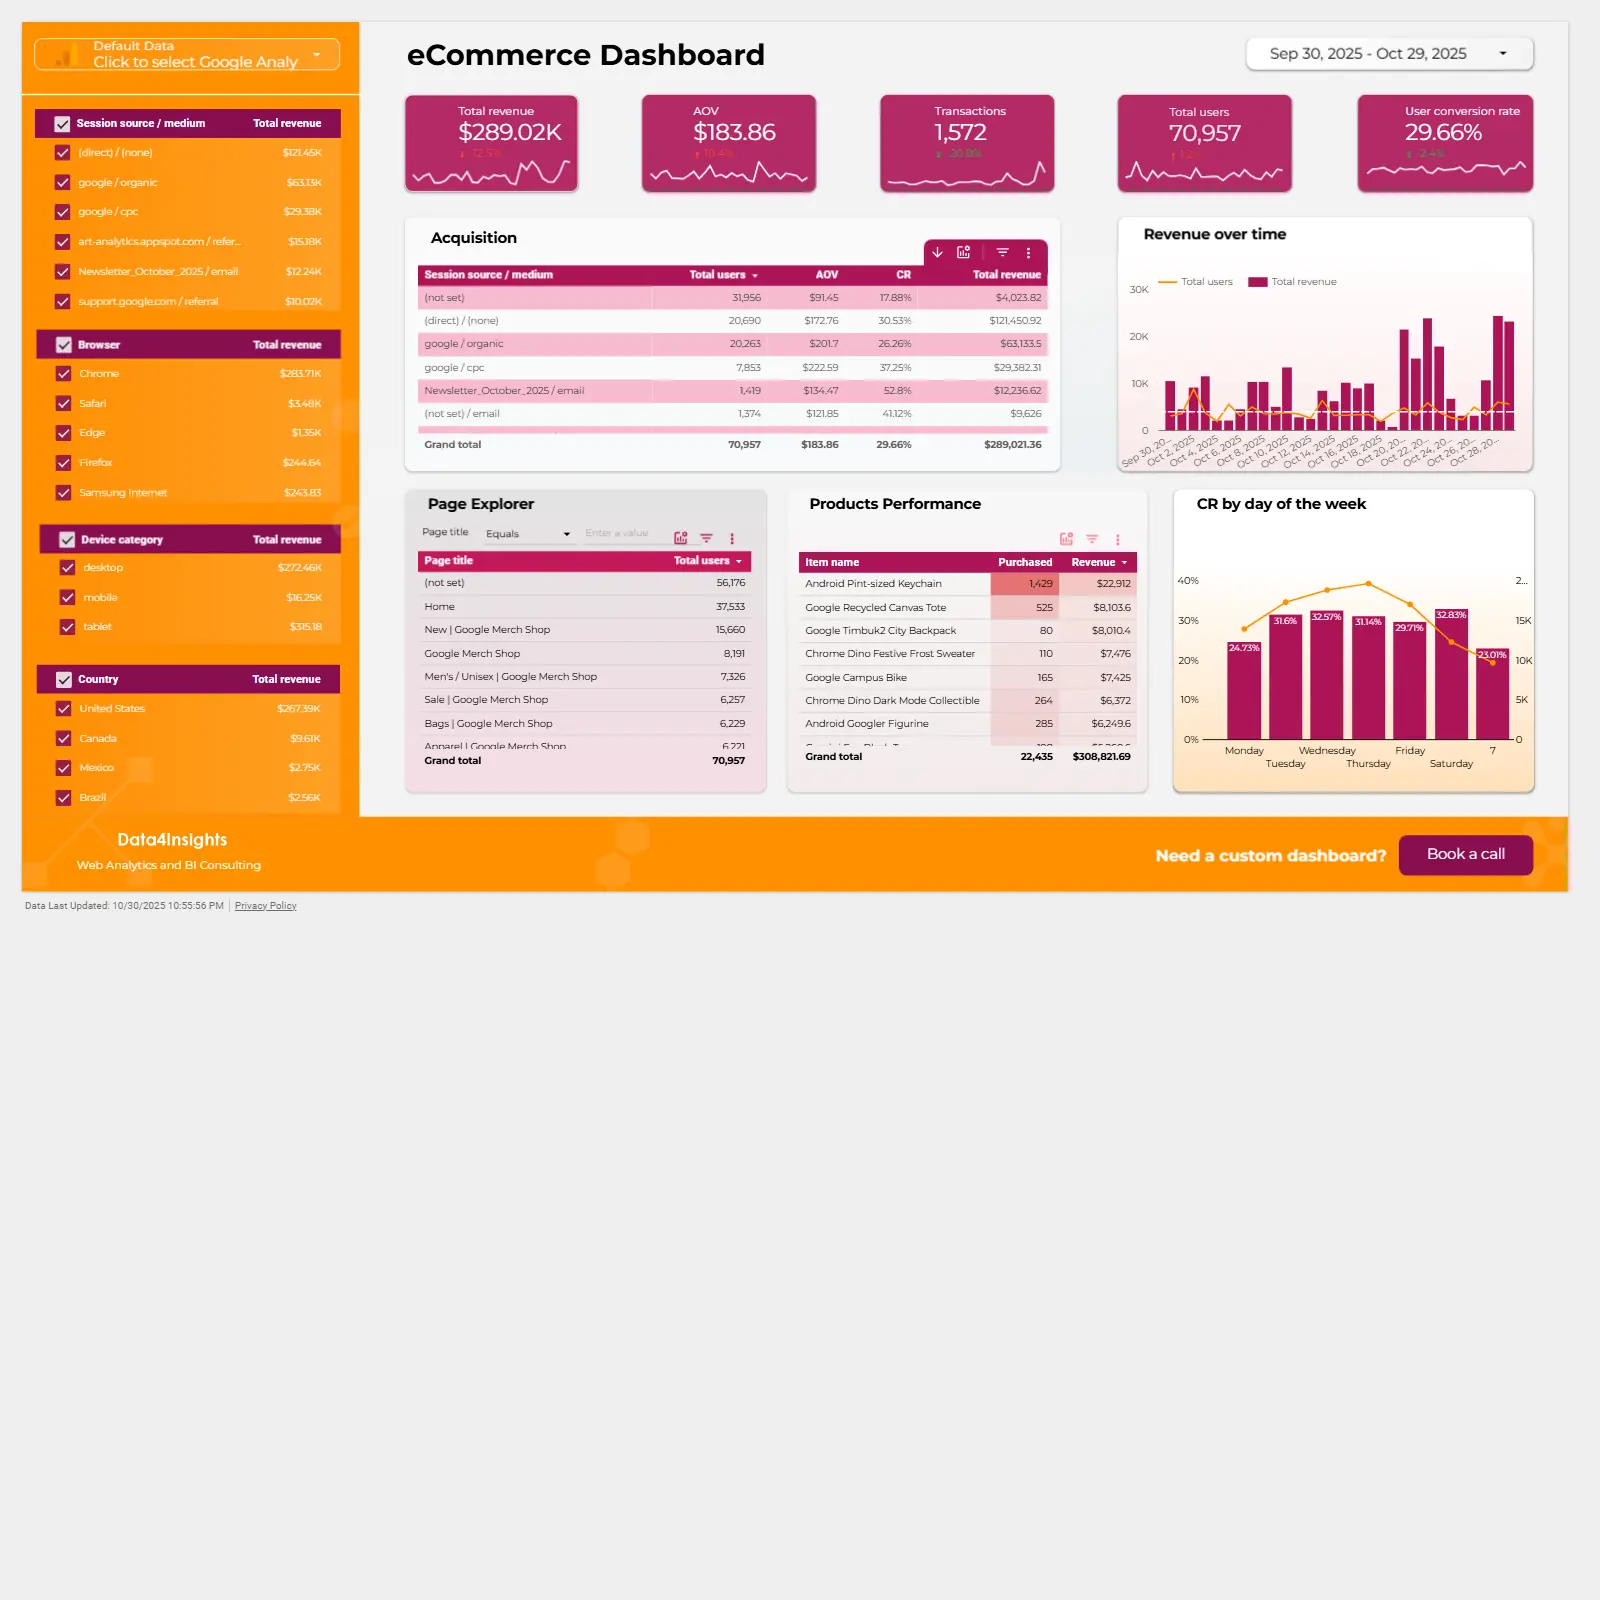
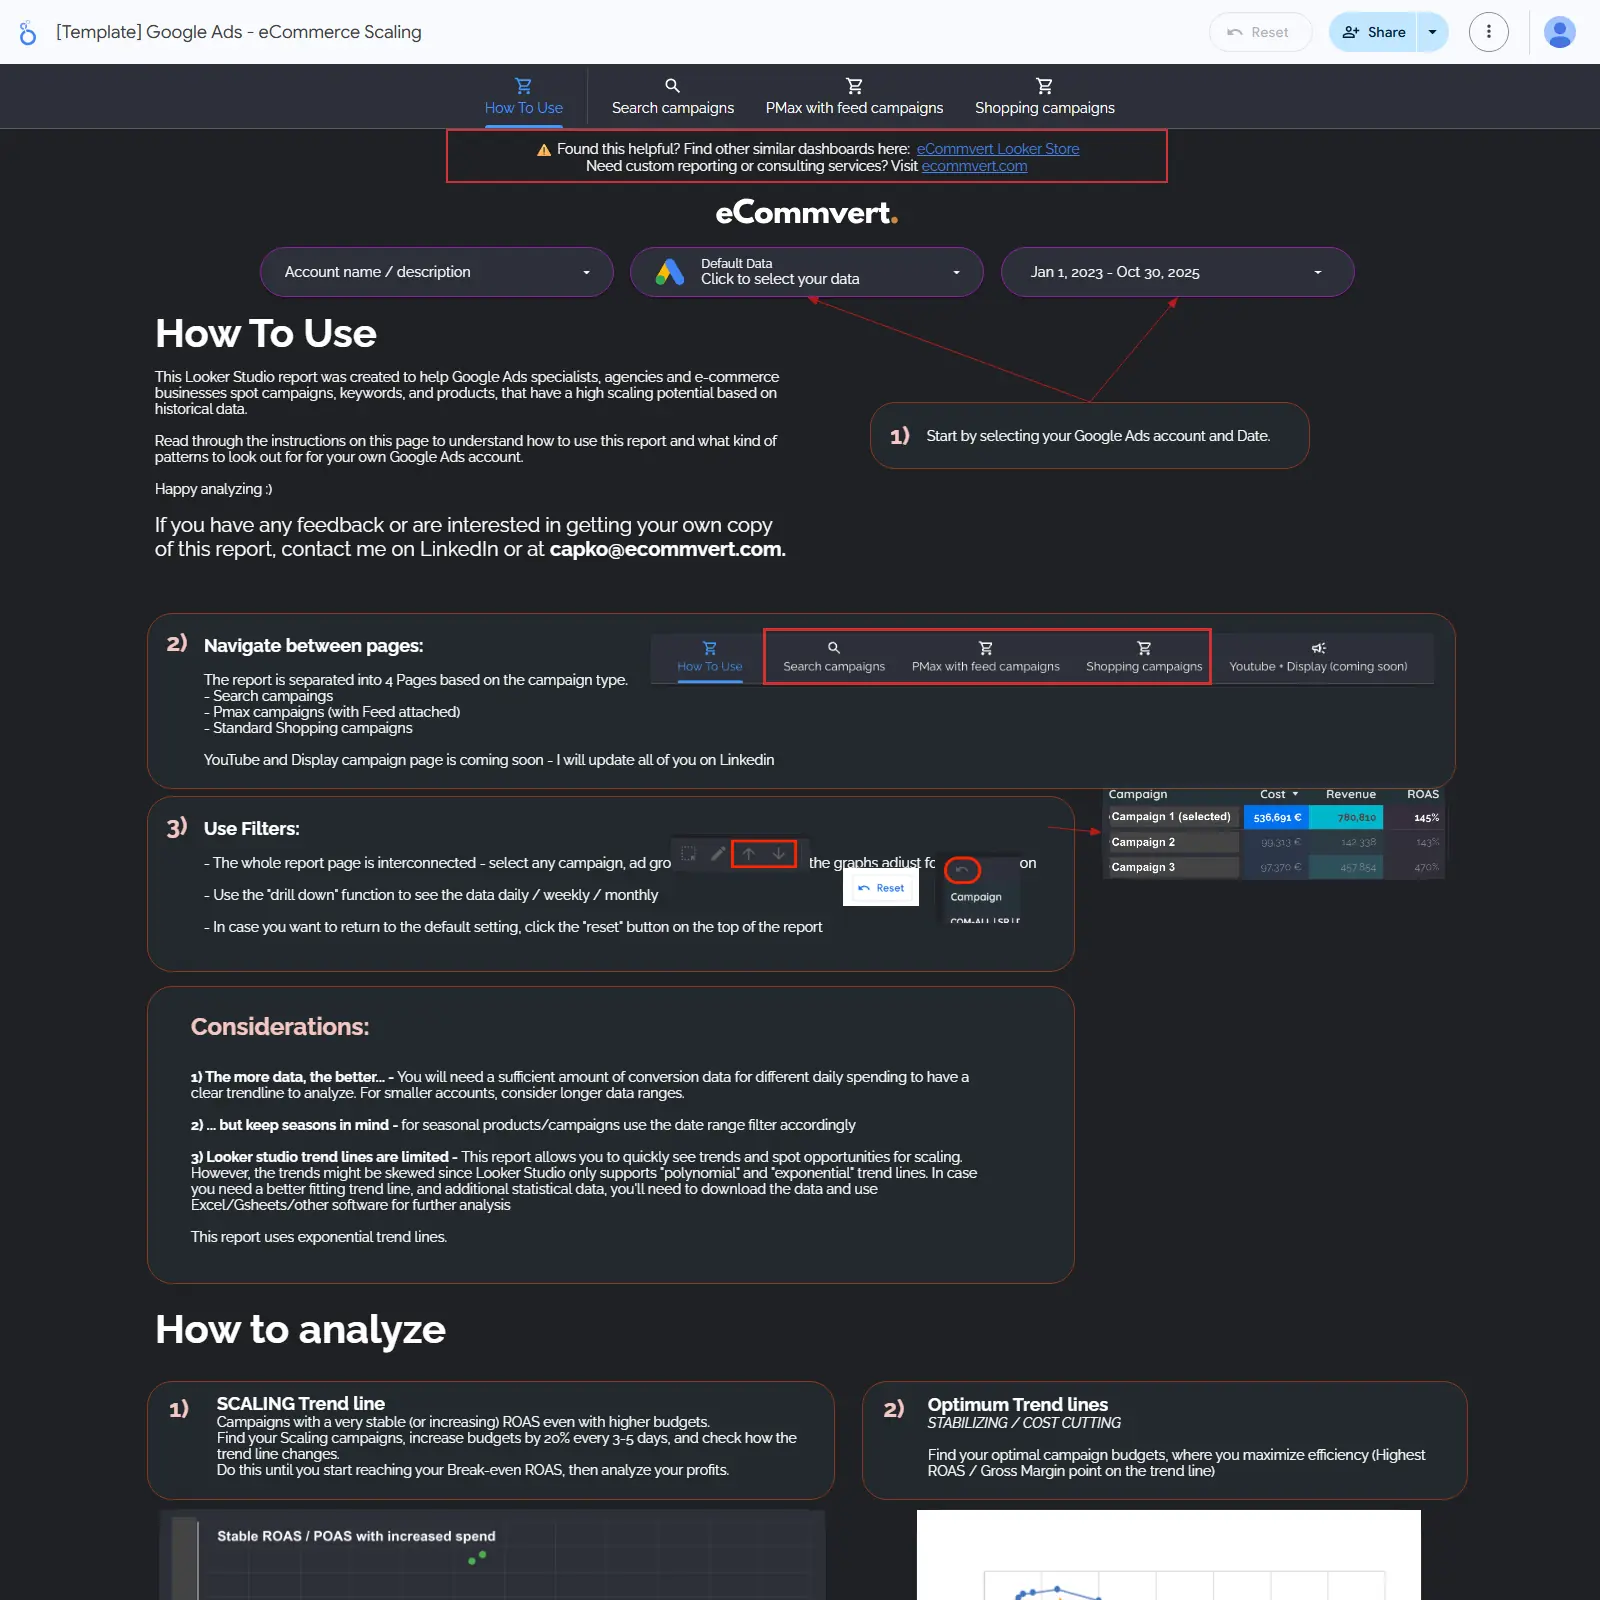
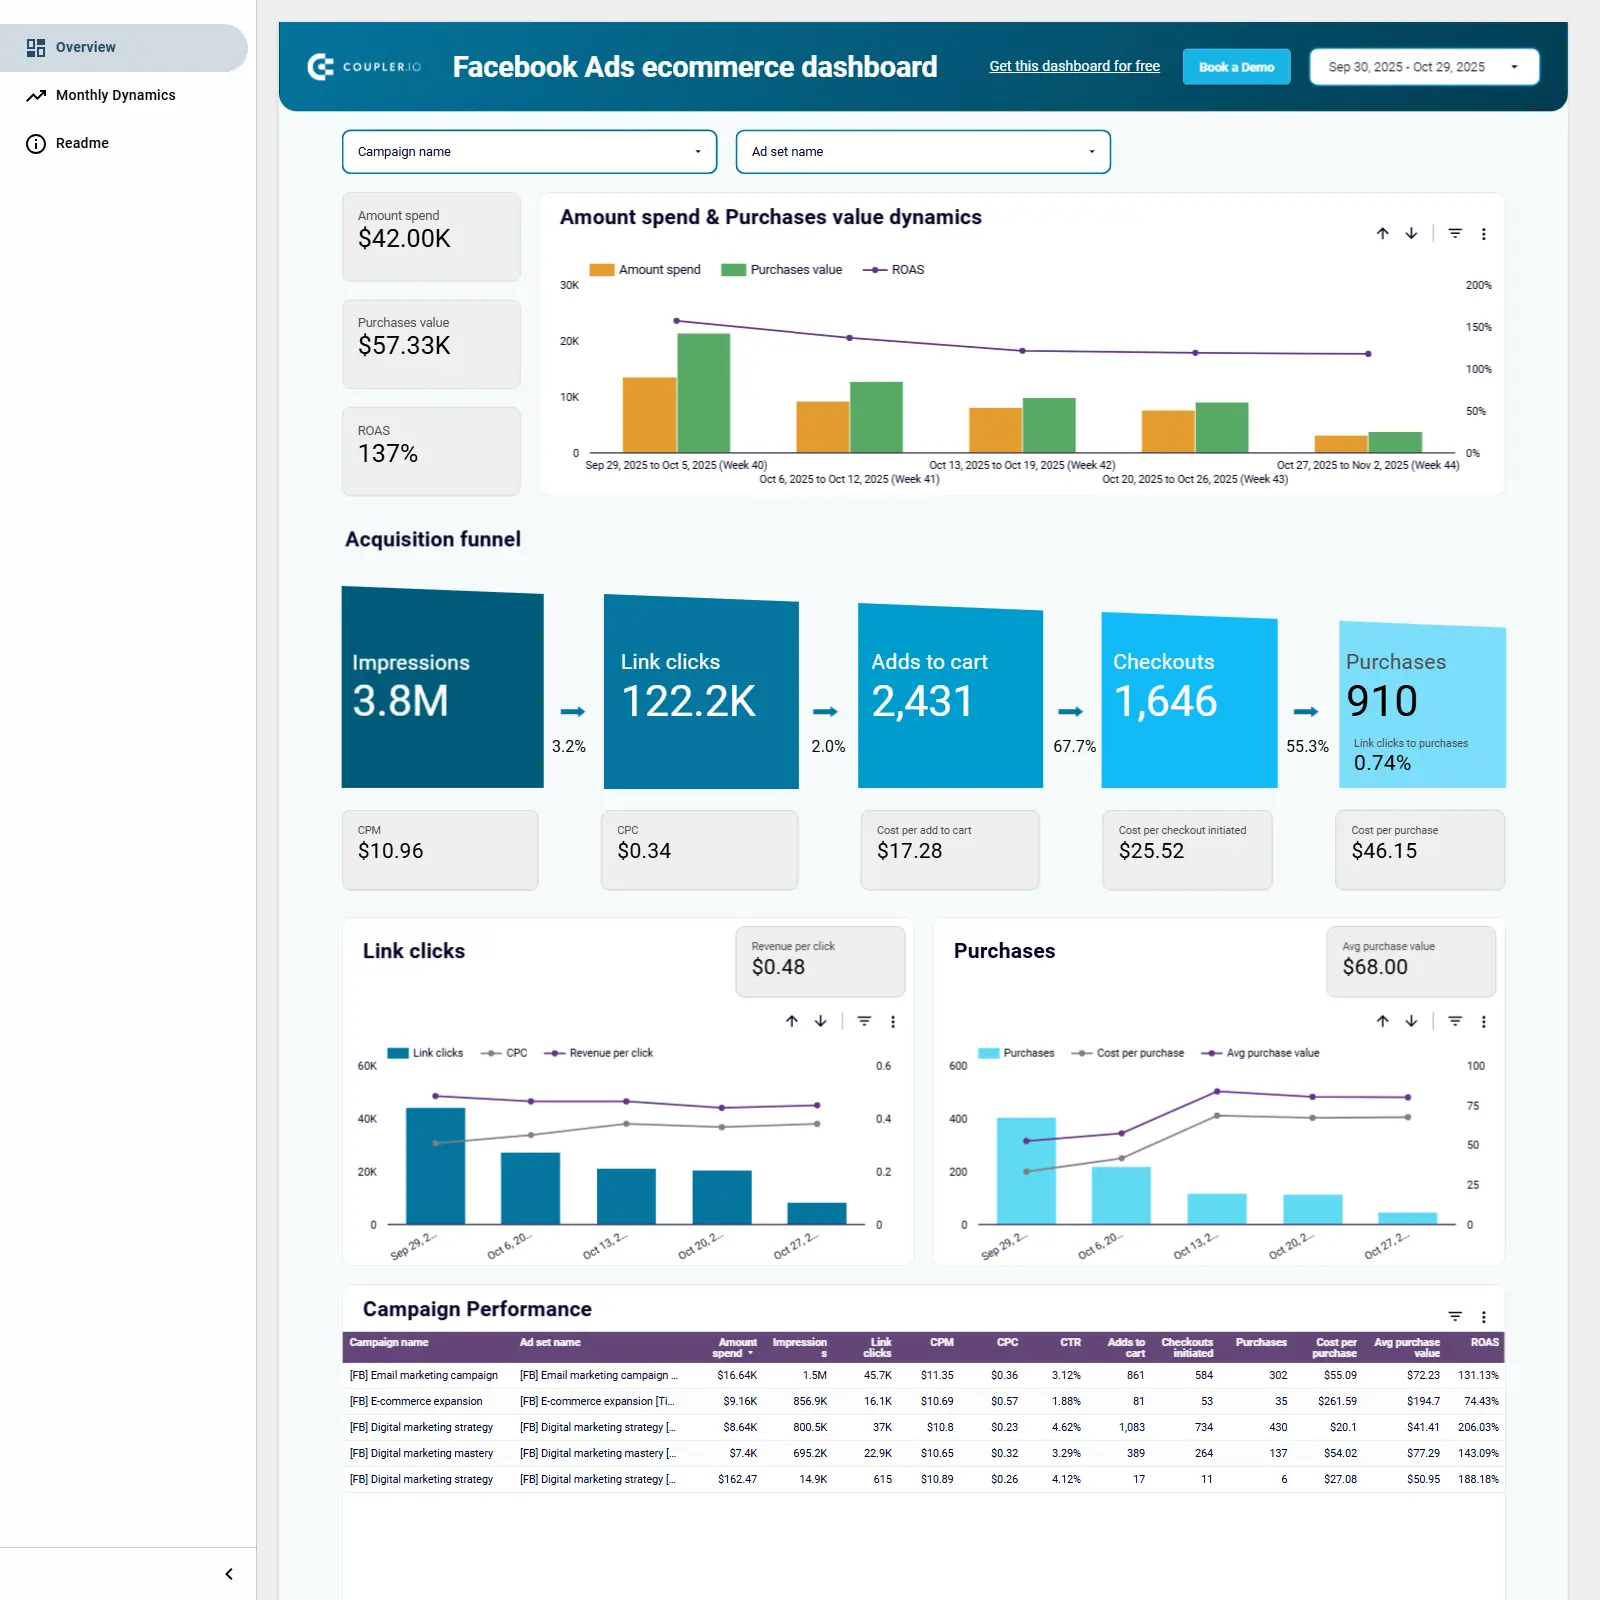
Google Ads e‑commerce dashboard to track spend, revenue, ROAS, and conversions with breakdowns by campaign, region, device, and more.

Google Ads e‑commerce performance template focused on cost, revenue, ROAS, and gross profit alongside clicks, impressions, CTR, CPC, conversions, CPA, CVR, and AOV. Filters for primary conversion action, campaign, region, device, and campaign type make it easy to zero in on what drives results. Period comparisons highlight growth or declines across acquisition and conversion metrics. Navigation includes dedicated pages for Budget, Campaigns, Devices, GEO, Products, Keywords, Time, and Forecast to optimize spend and plan outcomes.
Free
Shopify sales funnel dashboard cover image
Shopify sales funnel dashboard

Unified sales funnel template mapping conversions from ad impression to customer across CRM and marketing channels with channel, geo, and ROI insights.

Sales funnel dashboard template that tracks the full journey from first touch to closed customer by unifying CRM and marketing data. Integrates HubSpot or Pipedrive with Google Analytics, Google Ads, and Facebook Ads to visualize multi‑stage conversions and drop‑offs by channel, country, and item. Highlights channel attribution, geographic performance, and spend vs. conversion efficiency so you can reallocate budget and fix bottlenecks faster. Monitors impressions, clicks, website visitors, CRM leads, MQLs, SQLs, conversion rates, CPL, cost per SQL, bounce rate, and revenue impact. Ideal for marketers, sales teams, and agencies needing a clear view of acquisition performance and ROI.
Free
Salesforce sales dashboard cover image
Salesforce sales dashboard

Salesforce-to-Looker Studio template for tracking pipeline, win/loss, team performance, and revenue drivers with automated Coupler.io sync.

Salesforce sales analytics template for Looker Studio that unifies team performance, pipeline movement, and revenue trends into one view. Prebuilt pages surface Sales overview plus Open, Won, and Lost opportunities with breakdowns by owner, account, source, and deal size. Tracks the essentials: total sales, pipeline value, expected revenue, win/close/lost rates, average days to close, open deal age, and won/lost counts and amounts. Surfaces top performers, stage bottlenecks, and win/loss patterns to improve forecasting and execution. Powered by Coupler.io with automated refresh to keep Salesforce data current in Looker Studio.
Free
WooCommerce - Regional Sales Report cover image
WooCommerce - Regional Sales Report

Comprehensive WooCommerce regional sales dashboard for tracking revenue, customers, products, refunds, and geo performance in Looker Studio.

WooCommerce regional sales analysis in Looker Studio with KPIs for total, gross, and net sales, orders, items sold, average sale value, coupon discounts, shipping, tax, refunds, and product ratings. Time-series trends and prior-period comparisons highlight growth across key metrics. Customer, product, and category tables surface buyer details, top products, and heat-mapped performance, plus dedicated refund insights. Geo charts break down orders by country and state to spot regional winners. Built to give store owners and agencies a clear read on inventory, revenue drivers, and regional opportunities.
Free
Free Shopify Sales Funnel Dashboard Template for Looker Studio cover image
Free Shopify Sales Funnel Dashboard Template for Looker Studio

Free Looker Studio template for Shopify that highlights funnel performance, revenue, and channel impact across sources and sales channels.

A free Looker Studio template to analyze the Shopify sales funnel and revenue performance. Track gross and net sales, discounts, average order value, refunds, inventory, order count, and orders per customer. Compare traffic sources and Shopify sales channels to see which campaigns and storefronts drive revenue and conversions, with time-series trends and breakdowns. Use the insights to spot bottlenecks, lift conversion, and allocate spend to the highest‑impact channels. White‑label and customizable via Windsor.ai’s connector.
Free
GA4 General Ecommerce Report View Only cover image
GA4 General Ecommerce Report View Only

GA4 ecommerce analytics template covering traffic, engagement, and sales across channels, campaigns, devices, countries, products, and events.

GA4 template for general and ecommerce analytics that brings marketing and sales metrics into one view. Track users, new users, sessions, engaged sessions, engagement rate, and views with clear trends. Break down acquisition by source/medium and campaigns, plus device mix and country. Dive into transactions, product and category performance (including pivots), events, and internal promotions with technical details. Pinpoint winning channels, surface engagement issues, and link marketing activity to revenue.
Free
GA4 Lead Generation Report cover image
GA4 Lead Generation Report

GA4 funnel analysis for spotting drop‑offs and channel performance across each step of the user journey.

GA4 funnel analysis template focused on tracking user progression from page views to item views, selections, and other key events. Highlights step-by-step drop‑offs with a funnel chart and detailed tables by source/medium, helping pinpoint where traffic loses momentum. Surfaces acquisition insights alongside geography, demographics, landing pages, and device views to understand which audiences and channels drive deeper engagement. Ideal for optimizing campaigns and on‑site journeys by identifying the steps that most influence conversion.
Free
lespl Ecommerce GA4 - Analytics Way cover image
lespl Ecommerce GA4 - Analytics Way

GA4 ecommerce overview for revenue, traffic trends, conversion funnel, and country performance.

GA4 ecommerce performance template focused on traffic, revenue, and conversion health. It highlights core KPIs such as views, sessions, key events, new and active users, engaged sessions, bounce rate, and total revenue. Monthly traffic trends compare sessions vs engaged sessions to spot demand shifts. A purchase funnel traces product views to add-to-cart, checkout, and completed orders with conversion and drop‑off rates to identify bottlenecks. Geographic breakdown pinpoints top countries and market share to guide targeting.
Free
Ultimate GA4 Ecommerce Dashboard cover image
Ultimate GA4 Ecommerce Dashboard

GA4 eCommerce Looker Studio template for revenue, acquisition, product, and conversion insights.

An eCommerce Looker Studio template built for GA4 that highlights revenue, AOV, transactions, users, and conversion rate at a glance. Pinpoint winning channels with acquisition breakdowns and revenue by country, device, and browser. Spot trends with revenue over time and conversion rate by day of the week to optimize campaigns and timing. Drill into page and product performance to surface best‑selling items and the pages that drive sales. Ideal for ecommerce managers and marketers needing quick, actionable insights from GA4 data.
Free
Google Ads - eCommerce Scaling cover image
Google Ads - eCommerce Scaling

Google Ads eCommerce scaling template to spot high‑potential campaigns and optimal budgets across Search, PMax with feeds, and Shopping.

Google Ads eCommerce scaling template focused on finding growth opportunities across Search, Performance Max with feeds, and Shopping. Highlights campaigns and products with the strongest scaling potential using ROAS and efficiency trend lines. Guides you to the budget sweet spot—when to push spend and when to stabilize or cut costs. Built for specialists, agencies, and online stores that want decisions driven by historical data. Includes practical tips for reading trends and accounting for seasonality to drive profitable growth.
Free
Facebook Ads ecommerce performance dashboard cover image
Facebook Ads ecommerce performance dashboard

Facebook Ads ecommerce analytics with ROAS, funnel performance, and campaign-level insights for profitable scaling.

Facebook Ads ecommerce dashboard focused on ROAS and revenue impact across campaigns and ad sets. Tracks the full acquisition funnel from impressions and link clicks to adds to cart, checkouts, and purchases, with key cost metrics like CPM, CPC, CPA, and cost per purchase. Visualizes spend vs. purchases value over time and highlights average purchase value for quick ROI reads. Includes trend charts for clicks and purchases plus a detailed campaign performance table to pinpoint top- and under-performing ads. Built for ecommerce teams to optimize budgets, reduce funnel drop‑offs, and grow profitable conversions.
Free
Facebook Ads E-commerce Report cover image
Facebook Ads E-commerce Report

E‑commerce dashboard for Facebook/Instagram Ads with spend, CPC/CPE/CPA, CTR, purchases, and breakdowns by platform, country, campaign, and audience.

E‑commerce marketers can monitor Facebook and Instagram Ads performance in one place. Track investment, engagement, and results with CPC, CPE, CPA, CTR, and purchases, broken down by platform and country. Compare campaigns to spot winners and underperformers, and follow account‑level trends that highlight where to scale or cut spend. Audience insights reveal who interacts most with your ads to refine targeting and boost conversions.
Free
Amazon Ads - Orders and Sales Analytical Report cover image
Amazon Ads - Orders and Sales Analytical Report

Amazon Ads orders and sales analysis with KPIs, ROAS, campaign tables, and trend comparisons to guide budgeting and bidding.

Amazon Ads performance template focused on orders and sales analysis across campaigns and accounts. Highlights core KPIs including total ad sales, impressions, clicks, CTR, amount spent, CPC, and ROAS with trend comparisons to previous periods. Presents campaign-level heat‑mapped tables and an Orders Performance view across 1, 7, 14, and 30‑day windows. Includes visuals for order vs. sales trends, campaign status with bid strategy, and a geo view of high‑CPC countries. Built to help advertisers reallocate budget, refine bids, and grow revenue on Amazon.
Free
Sales KPI dashboard for HubSpot cover image
Sales KPI dashboard for HubSpot

Sales deals performance dashboard for tracking closed revenue, close rate, rep leaderboards, and loss reasons with 12‑month trends.

Sales performance template focused on closed deals and revenue impact. Track closed revenue, average deal size, lost amount, and 12‑month trends for closed and lost deals. Monitor close rate, top won and lost deals, and loss reasons to improve win rates. Compare best and worst owners by closed amount to pinpoint coaching and recognition opportunities. Filter by date and source to see which channels drive results and where deals stall.
Free