Price: Free Templates

The best free & paid Looker Studio templates, curated and quality-ranked for data reporting.

Clear All

Showing 81 - 120 of 443

Google Ads Break-even Analyzer cover image
Google Ads Break-even Analyzer

Ecommerce profitability dashboard with break‑even CPC/CVR/AOV and cost inputs for smarter campaign decisions.

Profit-focused ecommerce analytics template for Looker Studio that ties marketing performance to unit economics. Tracks key cost inputs like shipping per order, VAT, return rate, transaction fees, returning-customer share, and profit margin to show true profitability. Highlights break‑even CPC, required CVR, and target AOV so you know exactly what you can afford to pay for traffic and what levers to pull. Includes campaign, keyword, and search term views to spot winners and fix waste. Ideal for DTC brands and online stores that want to move beyond ROAS to real profit.
Free
Meta Ads creatives dashboard cover image
Meta Ads creatives dashboard

Creative-level Meta Ads analytics with KPIs and trends to compare, optimize, and scale ad performance.

Meta Ads creative performance tracking focused on comparing ads across campaigns and ad groups. Highlights the core KPIs marketers need—impressions, clicks, amount spent, CPC, CPM, CTR, and post engagement—to quickly identify winning and underperforming creatives. A detailed table ranks each ad by efficiency, while time‑series charts reveal trends for impressions vs. CPM, clicks vs. CPC, and spend dynamics. Helps pinpoint cost drivers, pacing issues, and optimization opportunities for higher ROI. Built for advertisers seeking clear, creative‑level insights.
Free
Facebook Ads report template for Looker Studio cover image
Facebook Ads report template for Looker Studio

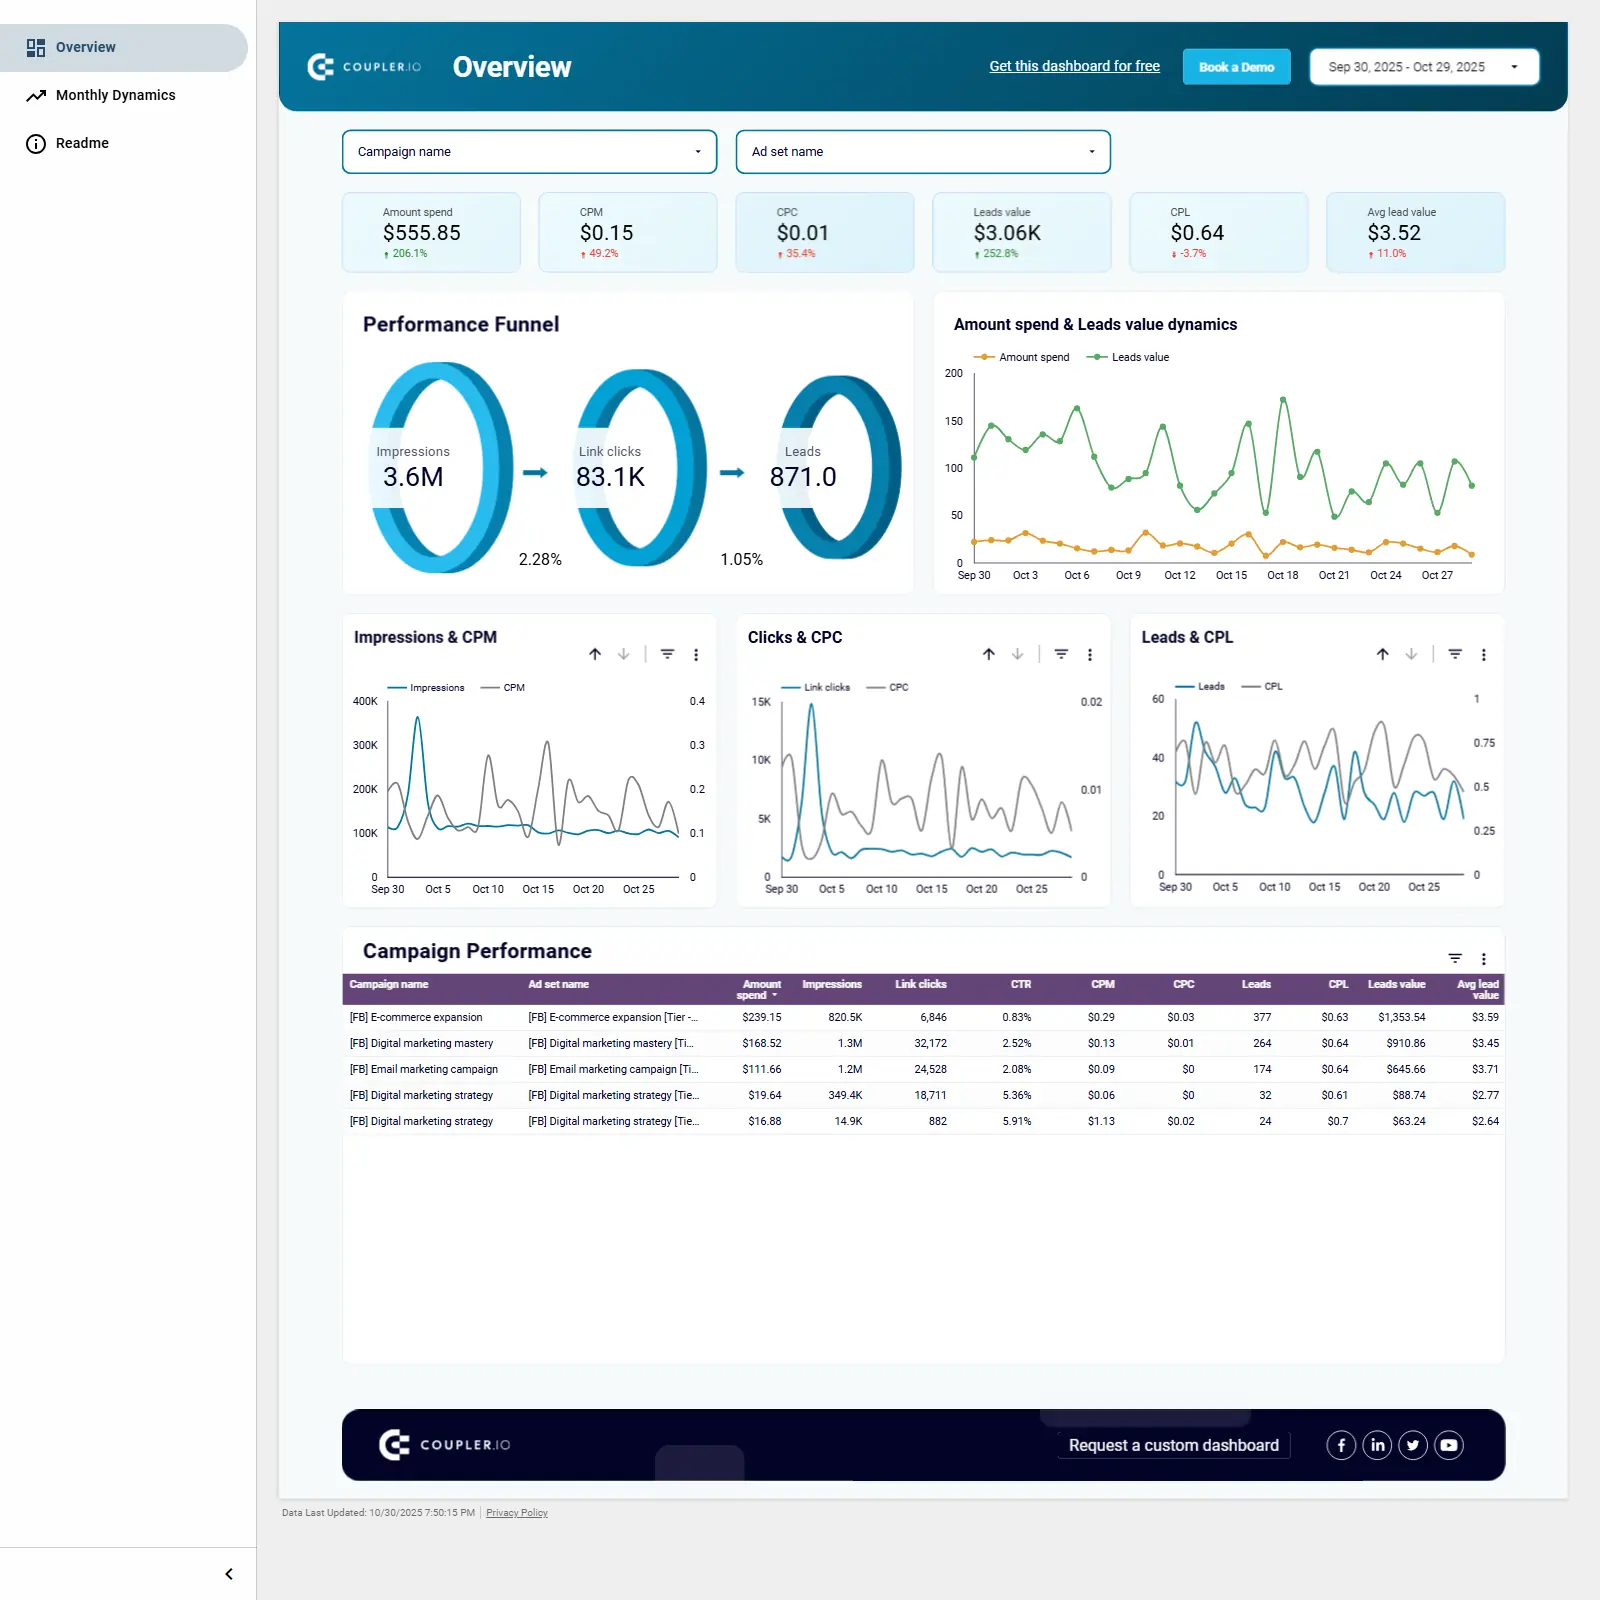
End‑to‑end Facebook Ads analytics in Looker Studio, covering performance, conversions, ROAS, audiences, platforms, and time-of-day trends.

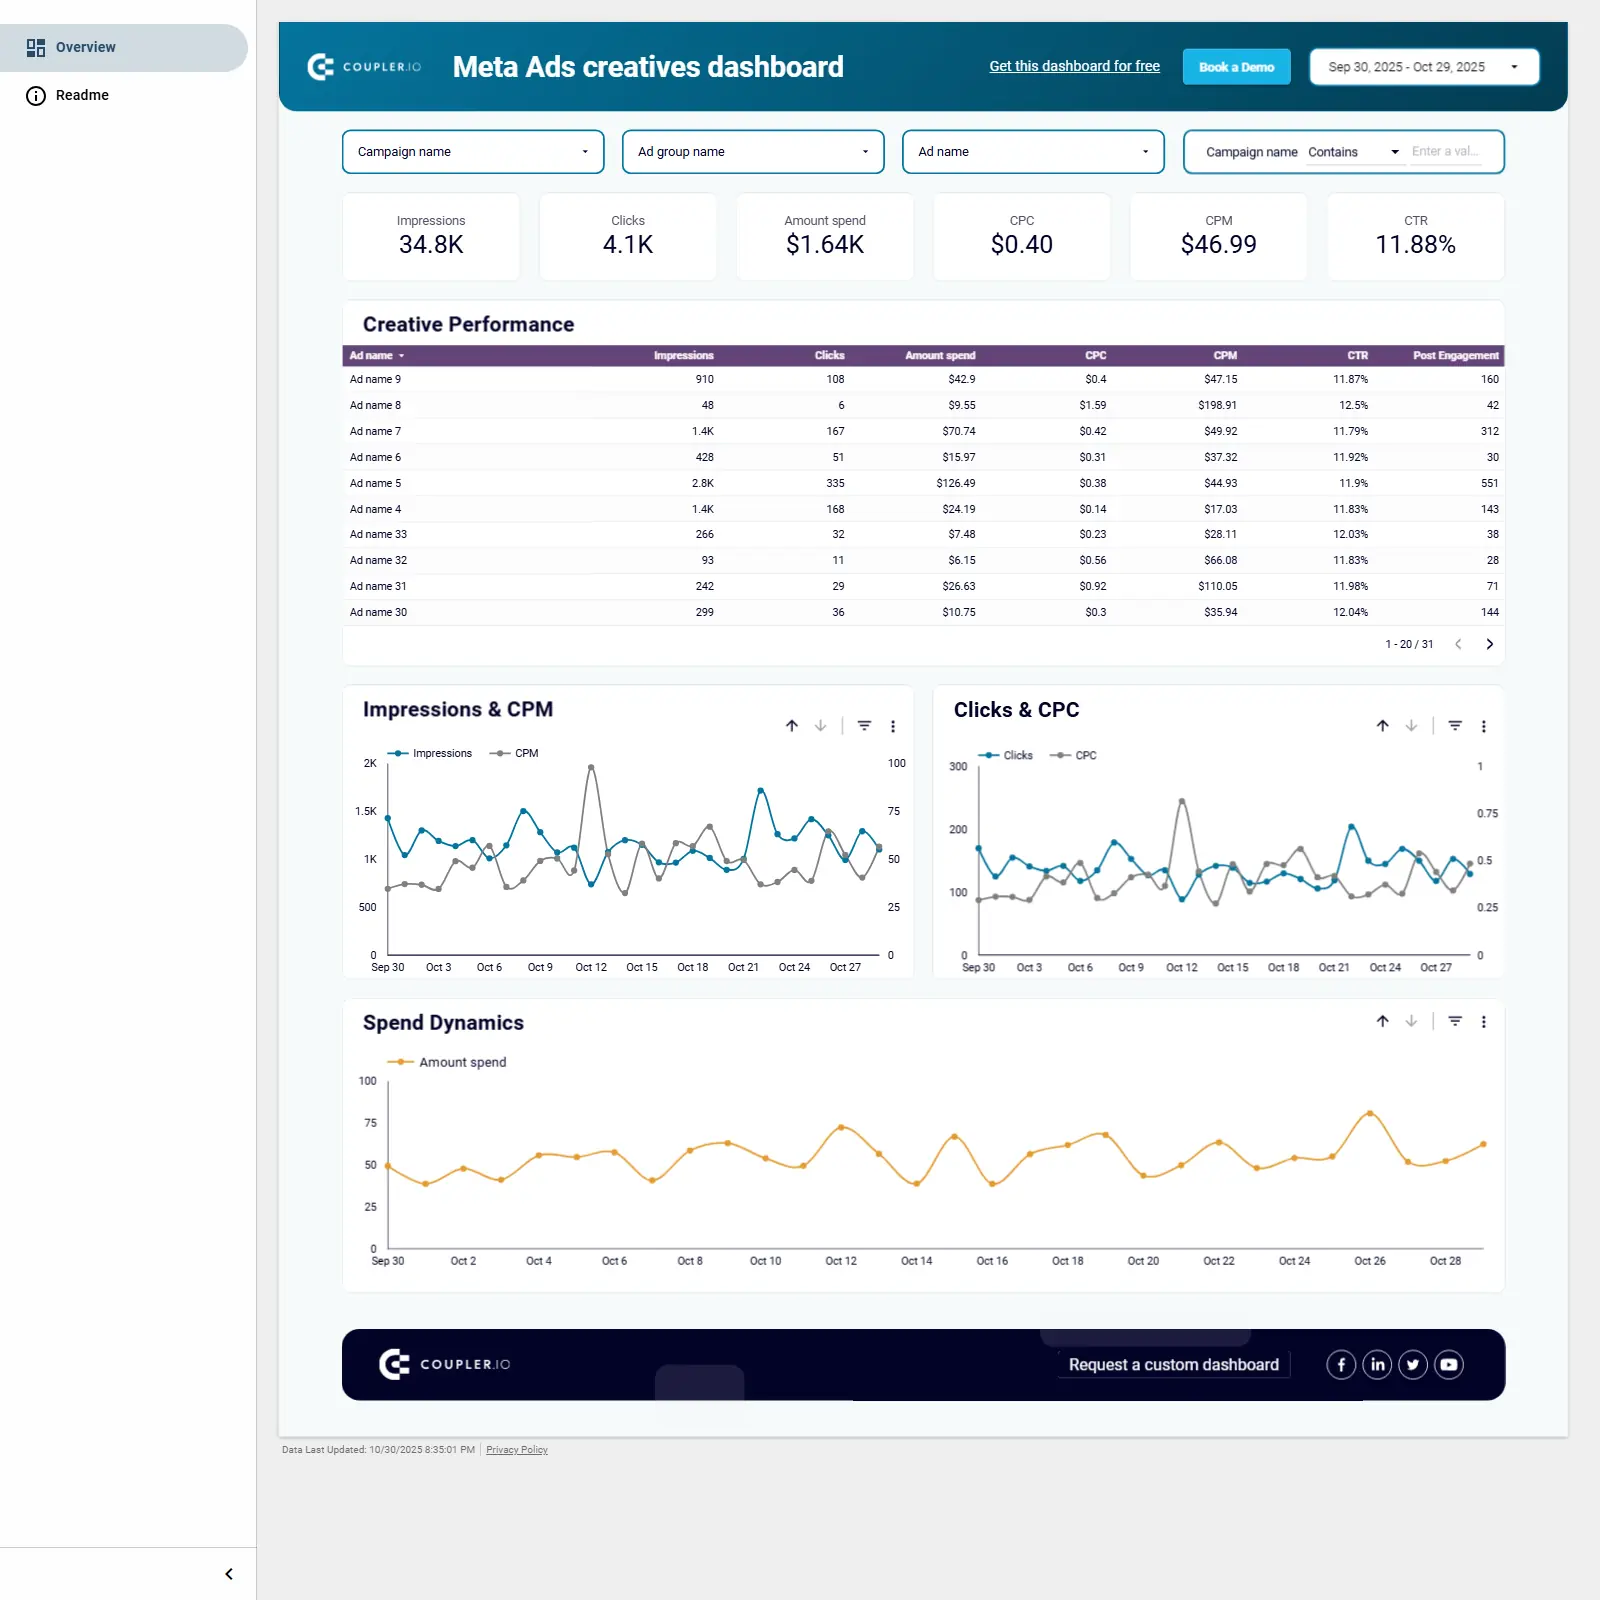
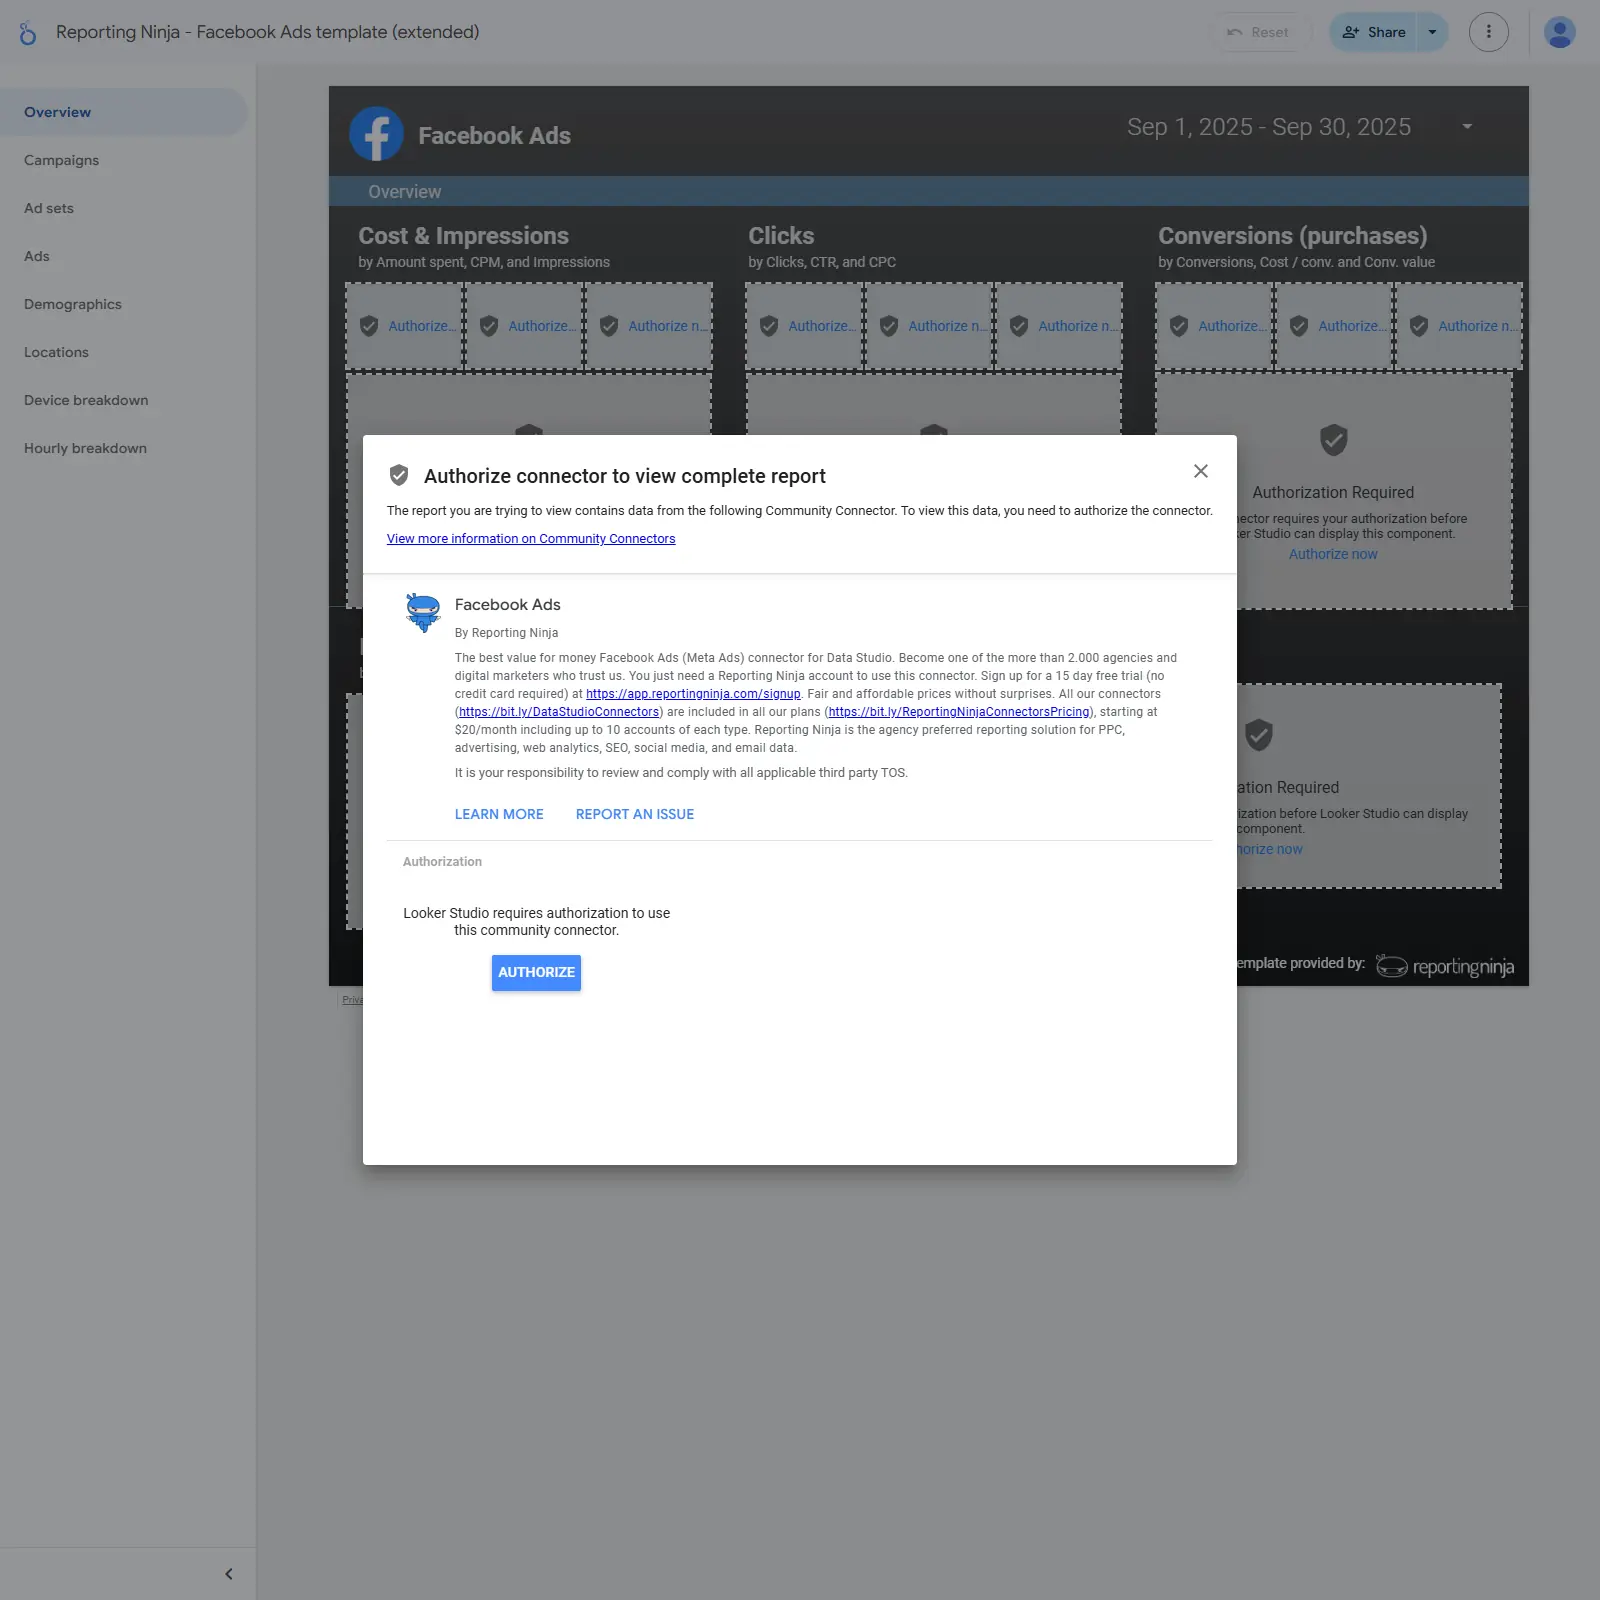
Facebook Ads performance tracking focused on spend, impressions, reach, clicks, CTR, CPC, and CPM across campaigns, ad sets, and creatives. Pinpoint top and underperforming ads using engagement signals (likes, comments, shares) and cost metrics, plus hourly and daily trends. Measure outcomes with purchases, cost per purchase, conversion value, and ROAS to understand efficiency and profitability. Compare results by audience demographics, device, country, and platform (Facebook, Instagram, Messenger, Audience Network) to refine targeting and budget. Built to surface clear, actionable insights for optimization and smarter allocation.
Free
Facebook Ads leads breakdown dashboard cover image
Facebook Ads leads breakdown dashboard

Looker Studio template to track Facebook Ads spend, funnel, and campaign/creative performance with metrics like CPL, ROAS, CTR, and lead value.

A Looker Studio template for Facebook Ads that consolidates data from Ads Manager into one view of spend, CPM, CPC, CTR, link clicks, leads, CPL, lead value, and ROAS. It visualizes the full funnel from impressions to conversions and includes a frequency meter to balance reach and avoid audience fatigue. Time-series trends, geographic insights, and a campaign/ad set/creative breakdown make it easy to spot winners and bottlenecks. Designed for marketers and agencies to compare performance across segments and reallocate budget with confidence.
Free
Keyword Cannibalisation Report cover image
Keyword Cannibalisation Report

Identify and fix SEO keyword cannibalisation using GSC data, showing competing URLs, key metrics, and trends.

Keyword Cannibalisation Checker for Google Search Console data to uncover queries where multiple pages compete in the SERPs. Surfaces each query’s page count alongside impressions, clicks, CTR, and average position, then drills into the exact URLs cannibalising the query. Guides prioritisation with a clear two-step flow—find the affected queries, then act on the overlapping pages (consolidate, redirect, noindex, or ignore). Includes a trend of query and page counts to monitor progress over time.
Free
The Ultimate Google Search Console Dashboard cover image
The Ultimate Google Search Console Dashboard

Google Search Console dashboard for tracking clicks, impressions, CTR, positions, and top pages/queries with clear trends.

Google Search Console SEO tracker focused on performance and visibility. Highlights core metrics—clicks, impressions, CTR, and average position—plus counts of ranking pages and queries. Clear trend charts reveal traffic and ranking shifts to spot wins, drops, and seasonality. Pages and queries views surface top performers and underperformers to prioritize content fixes and CTR optimizations. Ideal for monitoring the impact of SEO work and finding quick wins.
Free
Free Salesforce Marketing Cloud Dashboard Template on Looker Studio cover image
Free Salesforce Marketing Cloud Dashboard Template on Looker Studio

Free Looker Studio template for Salesforce Marketing Cloud email performance—sends, deliverability, opens, clicks, and bounces to optimize campaigns.

Salesforce Marketing Cloud Dashboard for Looker Studio focused on email marketing analytics, built by Windsor.ai. Tracks core KPIs including emails sent and delivered, unique and total clicks, link click rate, opens, and hard/soft bounces with campaign-level breakdowns. Trend charts visualize engagement and deliverability over time, while tables and pie charts highlight top campaigns and their impact. Helps teams optimize content, journeys, and ROI across Marketing Cloud campaigns. White‑label and free to use.
Free
Facebook page insights dashboard cover image
Facebook page insights dashboard

Facebook Page Insights template to track impressions, reach, views, likes by country, and post-level performance.

Facebook Page Insights template focused on page performance across one or multiple accounts. Track total, organic, and paid impressions, page views, likes, unlikes, and net likes with clear day‑by‑day trends. Compare organic reach vs. paid impact, see page views dynamics, and map page likes by country. Review recent posts with impressions, reach, shares, and reaction breakdowns to identify winning content and optimize strategy.
Free
Free X Twitter Ads Performance Dashboard on Looker Studio cover image
Free X Twitter Ads Performance Dashboard on Looker Studio

Free Looker Studio template to track and optimize X/Twitter Ads with key metrics like impressions, clicks, engagements, spend, conversions, and CPC/CPM.

A Looker Studio template for X/Twitter Ads that consolidates campaign metrics—impressions, clicks, engagements, spend, conversions, and cost efficiency (CPC, CPM, CPV)—into clear trend charts, scorecards, and campaign tables. Identify top-performing campaigns with time-series performance, side-by-side comparisons, and a spend-versus-engagement view. Uncover conversion-funnel insights from first touch to final action to refine targeting, creative, and bidding. Drive smarter budgeting and highlight ROAS drivers to communicate results confidently to stakeholders.
Free
TikTok Ads report template for Looker Studio cover image
TikTok Ads report template for Looker Studio

TikTok Ads performance and ROI tracking in Looker Studio across campaigns, ads, audiences, locations, and devices.

A Looker Studio template for TikTok Ads that consolidates campaign, ad group, and creative performance. Track impressions, clicks, CTR, conversions, CVR, CPC, CPM, CPA, ROAS, spend, and revenue. Compare formats and surface top campaigns while analyzing results by country, device, and demographics to find high‑value audiences. Use cost and efficiency views to guide budget shifts and boost return on ad spend.
Free
Shopify sales funnel dashboard cover image
Shopify sales funnel dashboard

Unified sales funnel template mapping conversions from ad impression to customer across CRM and marketing channels with channel, geo, and ROI insights.

Sales funnel dashboard template that tracks the full journey from first touch to closed customer by unifying CRM and marketing data. Integrates HubSpot or Pipedrive with Google Analytics, Google Ads, and Facebook Ads to visualize multi‑stage conversions and drop‑offs by channel, country, and item. Highlights channel attribution, geographic performance, and spend vs. conversion efficiency so you can reallocate budget and fix bottlenecks faster. Monitors impressions, clicks, website visitors, CRM leads, MQLs, SQLs, conversion rates, CPL, cost per SQL, bounce rate, and revenue impact. Ideal for marketers, sales teams, and agencies needing a clear view of acquisition performance and ROI.
Free
Salesforce sales dashboard cover image
Salesforce sales dashboard

Salesforce-to-Looker Studio template for tracking pipeline, win/loss, team performance, and revenue drivers with automated Coupler.io sync.

Salesforce sales analytics template for Looker Studio that unifies team performance, pipeline movement, and revenue trends into one view. Prebuilt pages surface Sales overview plus Open, Won, and Lost opportunities with breakdowns by owner, account, source, and deal size. Tracks the essentials: total sales, pipeline value, expected revenue, win/close/lost rates, average days to close, open deal age, and won/lost counts and amounts. Surfaces top performers, stage bottlenecks, and win/loss patterns to improve forecasting and execution. Powered by Coupler.io with automated refresh to keep Salesforce data current in Looker Studio.
Free
Quora Ads dashboard cover image
Quora Ads dashboard

Quora Ads analytics covering spend, reach, click metrics, campaign rankings, leads, CPL, and conversions.

Quora Ads performance template focused on spend efficiency and campaign impact. Track trends for amount spent, impressions, clicks, CTR, CPC, and CPM to spot shifts in reach and cost. Compare campaigns with top lists by spend, CTR, and lowest CPC to find quick optimization wins. Monitor lead generation, cost per lead, and conversions by date to gauge acquisition quality. Use it to reallocate budget toward the Quora campaigns that deliver the best results.
Free
Instagram Insights report template for Looker Studio cover image
Instagram Insights report template for Looker Studio

Instagram analytics template for Looker Studio tracking reach, impressions, engagement, followers, demographics, and top-performing content.

Optimize Instagram performance with a unified Looker Studio template that connects to Instagram Insights. Track reach, impressions, accounts engaged, follower growth, and lifetime profile stats with clear trend visuals. Compare media types—reels, stories, posts, carousels, ads—by reach, views, likes, comments, saves, and shares to identify top content. Explore audience demographics by age, gender, country, and city to refine targeting. Drill into post-level results and engagement rates to guide publishing and boost visibility.
Free
Instagram Insights report template cover image
Instagram Insights report template

Instagram analytics template that highlights engagement, growth, reach, top content, audience insights, and best time to post.

Instagram Insights template focused on tracking the performance of Instagram Business and Creator accounts in Looker Studio. Covers engagement rate, follower growth, reach, and top posts with sections for Profile performance, Profile actions, Posts, Post comparison, Best time to post, Stories, and Audience. Surfaces what content, hashtags, and formats resonate most and when to post for maximum engagement. Helps marketers understand audience demographics and validate where to invest time and budget across campaigns. Built by Porter with an Instagram Insights connector for complete, ongoing reporting.
Free
HubSpot - Company and User in depth Analysis Report cover image
HubSpot - Company and User in depth Analysis Report

Deep-dive HubSpot lifecycle, company revenue, contact engagement, email performance, and regional impact to prioritize accounts and grow pipeline.

HubSpot – Company and User In‑Depth Analysis maps the full lifecycle from leads and contacts to customers, opportunities, and subscribers, connecting engagement to revenue. It surfaces your top companies with activity and revenue data while revealing contact‑level interactions to guide targeted outreach. Email performance and traffic source insights highlight the campaigns and channels driving conversions. Country‑level revenue and company analysis uncover high‑value regions and segments for smarter targeting. Built for marketing and sales teams that want a single view of account health, pipeline impact, and ROI.
Free
Public Index Performance Report cover image
Public Index Performance Report

SEO content audit template that measures dead content and pinpoints pages to prune or optimize using clicks, impressions, and index coverage.

An SEO index performance calculator that quantifies the percentage of dead content on your site. Pages are grouped by engagement—Performing, Good, Fair, Weak, Potential, and Dead—based on clicks and impressions from search. It highlights index coverage, click share, and impression share to surface thin or low‑visibility URLs and pages with demand but no clicks. Use it to prioritize pruning, rewrites, internal linking, and indexation fixes for faster SEO gains.
Free
GA4 404 Error Management Dashboard cover image
GA4 404 Error Management Dashboard

Monitor and fix GA4-detected 404 errors with clear views of error pages, affected channels, and trends.

Looker Studio template for tracking and managing 404 errors using Google Analytics 4 data. Identify top error pages, see trends over time, and quantify impact by channel, campaign, and source. Highlight where users hit dead links and export prioritized lists to fix. Monitor remediation progress with focused views on affected pages and actions taken. Built for web, SEO, and marketing teams that need a fast, centralized 404 workflow.
Free
Consent Mode Migration Impact Report cover image
Consent Mode Migration Impact Report

GA4 impact estimator for Google Consent Mode with before/after metrics, consent-rate modelling, and behavioural modelling eligibility.

Estimate the impact of moving to Google Consent Mode on GA4 by comparing key metrics before vs. after consent. Quantify expected data loss by adjusting consent acceptance rates and seeing changes to users, sessions, views, transactions, revenue, and tracked actions. Identify eligibility for GA4 behavioral modelling and monitor denied events and average daily users to understand modelling coverage. Use the modelling breakdown to communicate the expected impact period and magnitude to stakeholders. Ideal for teams evaluating a Consent Mode migration and its effect on reporting and conversions.
Free
v2 GA4 404 Error Monitoring Dashboard cover image
v2 GA4 404 Error Monitoring Dashboard

GA4 dashboard to find, analyze, and export website 404 errors for faster fixes.

GA4-powered Looker Studio template for discovering and managing website 404 errors. Pinpoint broken pages, referrers, and campaigns driving users to 404s, with trends to gauge impact over time. See actions taken on error pages to understand user behavior and urgency. Export 404 lists to speed up debugging and fixes. Ideal for marketers, analysts, and web teams who need fast, proactive error monitoring.
Free
GA4 Marketing Report Dashboard Demo cover image
GA4 Marketing Report Dashboard Demo

Google Analytics 4 marketing dashboard covering acquisition, engagement, monetization, user, and tech with powerful cross‑filtering.

GA4 Marketing Report Dashboard for Google Analytics 4 data, focused on website performance across Acquisition, Engagement, Monetization, User, and Tech. Advanced cross‑filtering enables quick drilldowns and instant insights that feel like applying a secondary dimension to any view. Built for marketers and decision‑makers who need a clear snapshot of key KPIs from multiple angles. Accessibility features include succinct chart descriptions to support screen readers.
Free
Search Performance Overview cover image
Search Performance Overview

Looker Studio template to analyze Google Ads search performance across campaigns, keywords, devices, audiences, geos, and auction insights.

Google Ads Search Performance dashboard for Looker Studio that unifies account, campaign, ad group, keyword, and search query analytics. Tracks spend, impressions, clicks, CTR, CPC, conversions, CPA, and ROAS with daily trends and period-over-period comparisons. Explore device, demographic, and geographic views to pinpoint winning segments and eliminate wasted spend. Leverage auction insights to benchmark against competitors and guide bid and budget decisions. Built to give marketers fast, actionable visibility into search performance from overview to deep dive.
Free
Ads Overview cover image
Ads Overview

Unified ads reporting across Google, Microsoft, Meta, and LinkedIn with global and platform deep‑dives.

Cross-channel advertising overview for Google Ads, Microsoft Ads, Meta (Facebook/Instagram), and LinkedIn in a single Looker Studio template. Combines a global summary with platform-specific pages to compare performance and dig into each network. Highlights essential KPIs to track spend, reach, conversions, and cost efficiency so you can allocate budget with confidence. Powered by Catchr connectors for real-time, no‑code data sync. Built for marketers and agencies managing multiple ad accounts.
Free
Google Ads Experiments Performance cover image
Google Ads Experiments Performance

Evaluate Google Ads trial campaigns vs base campaigns and analyze incremental queries to find winning variants.

Google Ads Experiments Performance Dashboard compares trial campaigns against their corresponding base campaigns across selected accounts. It consolidates results into an executive summary, detailed performance comparisons, and incremental query analysis to surface queries uniquely captured by the experiment. Designed to quantify lift and efficiency changes so you can decide whether to scale, pause, or iterate variants. Ideal for advertisers running structured A/B tests who need fast, clear readouts.
Free
Google Ads creatives dashboard cover image
Google Ads creatives dashboard

Google Ads creative performance analytics with key KPIs, trends, and top creatives for optimization.

Google Ads creatives performance tracking focused on spend efficiency, reach, and engagement across campaigns, ad groups, and ad types. Key metrics include amount spent, impressions, clicks, CPC, CPM, and CTR with a detailed creative-level table for comparisons. Trend visuals highlight impressions vs. CPM, clicks vs. CPC, and spend dynamics over time. Ranking and breakdowns surface top-performing creatives by conversions and impressions by ad type to guide optimization.
Free
Google Ads keywords performance dashboard cover image
Google Ads keywords performance dashboard

Google Ads keyword performance analytics to optimize spend, clicks, and conversions across campaigns.

Google Ads keywords performance focused on measuring cost-efficiency and revenue impact across search terms and ad groups. Covers core KPIs such as cost, impressions, clicks, CTR, CPC, CPM, conversions, conversion value, conversion rate, and cost per conversion, with trend charts and a detailed keyword table to surface winners and waste. Highlights top keywords by clicks and visualizes shifts in impressions, CPC, and CPA over time to guide bid and budget decisions. Excludes Performance Max campaigns.
Free
Paid media report template cover image
Paid media report template

Multi-channel PPC dashboard for Looker Studio to monitor CTR, CPC, ROAS, and conversions across Google, Meta, LinkedIn, TikTok, and Twitter with GA4 insights.

Multi-channel paid media template for Looker Studio that unifies PPC performance across Google Ads, Facebook/Instagram, LinkedIn, TikTok, and Twitter. Tracks CTR, CPC, conversions, conversion rate, ROAS, spend, impressions, and engagement to surface winning channels, campaigns, and audiences. Adds GA4 website metrics like sessions, views, and bounce rate for full‑funnel insight from ad spend to on‑site outcomes. Includes white‑label styling, historical data, data blending, and scheduled email summaries for clients and stakeholders.
Free
Facebook Ads performance for mobile apps dashboard cover image
Facebook Ads performance for mobile apps dashboard

Mobile app UA dashboard tracking spend, ROAS, CPM/CPC/CPI, and funnel from impressions to purchases with weekly trends.

Looker Studio template for tracking mobile app user acquisition across paid campaigns, from impression to purchase. Highlights spend vs. purchase value with ROAS, plus CPM, CPC, CPI, average install value, and average purchase value. A funnel summarizes conversion at each stage (impressions, link clicks, installs, purchases) while weekly trend charts reveal changes in costs and volume. Ideal for spotting bottlenecks, optimizing budgets and creatives, and quantifying revenue impact of marketing efforts.
Free
Apple Search Ads Overall Performance cover image
Apple Search Ads Overall Performance

Apple Search Ads performance tracking for spend, taps, installs, CPT/CPA/CPM, LAT impact, and campaign/ad group rollups over time.

Apple Search Ads analytics in Looker Studio focused on campaign, ad group, and ad performance. Track spend, impressions, taps, TTR, installs, new downloads vs re‑downloads, and costs such as CPT, CPA, and CPM with time‑series comparisons to previous periods. Understand attribution gaps with Limited Ad Tracking (LAT) insights on installs and off‑installs. Use performance tables with budgets, statuses, and results to pinpoint winners, reduce waste, and guide bid and budget moves.
Free
Apple Search Ads dashboard cover image
Apple Search Ads dashboard

Apple Search Ads dashboard template to analyze campaigns, keywords, and device performance and optimize installs and spend.

Apple Search Ads analytics template for Looker Studio that brings all campaign data into one view to guide smarter app growth decisions. Track spend, impressions, clicks, installs, CTR, CPC, CPA, conversion rate, and new downloads with device split for iPhone vs. iPad. Compare campaigns and keywords, identify top converters, and analyze actual search terms to refine targeting. Review daily and month‑over‑month trends to spot seasonality, budget efficiency, and performance shifts. Turn insights into actions by reallocating spend, adjusting bids, and improving creatives to drive more quality installs.
Free
Google Search Console reporting template cover image
Google Search Console reporting template

Branded vs non‑branded SEO performance from Google Search Console with impressions, clicks, CTR, and ranking insights.

Google Search Console analysis focused on branded vs non‑branded search performance. Highlights impressions, clicks, CTR, and average position, with a keyword table to surface top queries. Visualizes CTR against SERP position to spot opportunities to improve rankings and click‑through rates. Helps compare brand demand to generic SEO traffic and prioritize high‑impact keywords across devices and site paths.
Free
Search Console Explorer Studio cover image
Search Console Explorer Studio

All‑in‑one Google Search Console explorer to compare performance, extract data, and spot SEO opportunities.

Explore Google Search Console performance across queries, pages, countries, and devices to see what drives clicks, impressions, CTR, and position. Use dedicated Explore (map and non‑map), Extract, Consolidate, Compare, and Opportunity views to drill into trends and uncover gaps. Compare time periods to spot winners and declines, then pinpoint keywords and pages with the best growth potential. Extract and consolidate data for deeper analysis and reporting. Ideal for SEOs and marketers who want fast, actionable insights from GSC.
Free
Google Search Console Rankings cover image
Google Search Console Rankings

Monitor Google Search Console rankings, keyword positions, and top pages with biggest movers and monthly trends.

Tracks Google Search Console rankings to reveal how queries and pages perform over time. Highlights monthly totals for queries, top‑10 keywords by position groups, total pages, and pages that earn clicks. Surfaces the biggest movers for both queries and landing pages using recent position changes to spot winners and content at risk. Filters by search type, country, device, and date to zero in on performance segments. Ideal for identifying high‑potential keywords and pages to optimize next.
Free
WooCommerce - Regional Sales Report cover image
WooCommerce - Regional Sales Report

Comprehensive WooCommerce regional sales dashboard for tracking revenue, customers, products, refunds, and geo performance in Looker Studio.

WooCommerce regional sales analysis in Looker Studio with KPIs for total, gross, and net sales, orders, items sold, average sale value, coupon discounts, shipping, tax, refunds, and product ratings. Time-series trends and prior-period comparisons highlight growth across key metrics. Customer, product, and category tables surface buyer details, top products, and heat-mapped performance, plus dedicated refund insights. Geo charts break down orders by country and state to spot regional winners. Built to give store owners and agencies a clear read on inventory, revenue drivers, and regional opportunities.
Free
Pinterest Organic report template for Looker Studio cover image
Pinterest Organic report template for Looker Studio

A Pinterest analytics template that highlights profile, pin, and video performance, traffic sources, and top pins to grow engagement and clicks.

Pinterest Organic Looker Studio template tracks how your content performs across impressions, engagements, saves, pin clicks, and outbound clicks. Surface follower growth, active boards and pins, and pinpoint top-performing pins and formats (standard, product, video, story). Analyze video performance with views, starts, average play duration, and 95% completion to understand what holds attention. Break down traffic sources and devices to see where visibility and clicks come from. Turn trend insights into actions to refine creative, boost engagement, and drive more site traffic.
Free
LinkedIn company page performance dashboard cover image
LinkedIn company page performance dashboard

LinkedIn Company Pages analytics for tracking engagement, audience sources, and post performance.

LinkedIn Company Pages analytics focused on content and audience performance. Track impressions, engagements, engagement rate, clicks, likes, and reposts with clear trend lines. See where traffic comes from with page views split by device and a country map. Surface top and underperforming posts with a detailed table showing impressions, likes, reposts, comments, and engagement rate. Built for marketers and social teams to spot growth drivers and refine posting strategy.
Free
Google Analytics 4 Template cover image
Google Analytics 4 Template

GA4 template to track acquisition, engagement, conversions, and e‑commerce with clear KPIs, channel and country insights.

Google Analytics 4 template focused on website performance and acquisition. Key KPIs include sessions, engaged sessions, bounce rate, average session duration, transactions, and purchase rate with period comparisons. Visuals highlight device mix, top acquisition channels, and top countries, plus a time-series of KPI trends. Dedicated sections cover Overview, Engagement, Conversions, and E‑commerce for a full funnel view from traffic to revenue.
Free
Google Analytics 4 report template for Looker Studio cover image
Google Analytics 4 report template for Looker Studio

GA4 Looker Studio template to analyze traffic, engagement, conversions, and audience insights for smarter marketing and content decisions.

Google Analytics 4 Looker Studio template for tracking website performance across traffic, engagement, conversions, and revenue. Compare acquisition channels like organic, direct, paid, and referral to see which sources drive new users and results. Surface user behavior with page-level views, events, session quality, and trends over time. Explore demographics by country, city, gender, and interests to refine targeting and content. Turn GA4 data into actionable insights to grow traffic and improve conversion rates.
Free
Metrics Breakdown Tree cover image
Metrics Breakdown Tree

Ecommerce decision‑tree template that surfaces profit drivers from Google Ads and Google Analytics with a clear metrics breakdown.

Ecommerce analytics template that turns Google Ads and Google Analytics data into a decision tree to pinpoint the biggest levers for growth and profitability. Highlights metrics such as repeat order rate, return rate, shipping per order, transaction fees, sale percentage, and profit margin to prioritize fixes and quick wins. Includes a detailed metrics breakdown plus keyword and product filters to compare performance across campaigns and SKUs. Built to reveal where money is made or lost across the funnel and guide next steps.
Free
Facebook Organic report template for Looker Studio cover image
Facebook Organic report template for Looker Studio

All‑in‑one Facebook Insights template to track growth, engagement, content performance, and Reels/video impact—split by organic vs paid.

Facebook marketing analytics focused on growth, reach, impressions, engagement, and video performance. Compare organic vs paid results, track fan adds/removes, and surface top posts and Reels by likes, comments, shares, and interactions. Understand audience locations and languages to tailor content and pinpoint the best days and times to post. Monitor video views, 30‑second completions, and completion rate to refine creative and improve retention.
Free