Price: Free Templates

The best free & paid Looker Studio templates, curated and quality-ranked for data reporting.

Clear All

Showing 121 - 160 of 443

YouTube report template for Looker Studio cover image
YouTube report template for Looker Studio

Looker Studio template to analyze YouTube views, watch time, engagement, subscribers, traffic sources, audience, retention, and playlists.

YouTube performance dashboard for Looker Studio focused on channel growth and engagement. Track views, watch time, average view duration, subscriber gains/losses, likes, comments, shares, and top videos with retention. See where viewers come from (search, suggested, external) and which sources drive the most watch time. Understand audience demographics and geography, playback locations and devices, and how playlists contribute to overall engagement. Use the insights to refine content, improve retention, and expand reach.
Free
YouTube Channel Report cover image
YouTube Channel Report

YouTube Analytics dashboard for tracking channel trends, top videos, engagement, and geographic reach.

YouTube channel analytics focused on what matters: views, average watch time, and shares trended over time. Pinpoint top-performing videos with side‑by‑side metrics for views and engagement. Track audience sentiment with likes, dislikes, subscriptions added/removed, and comments. See where viewers come from with country and U.S. state maps. Designed for creators and marketers who want quick, actionable insight into channel performance.
Free
Revenue dashboard for Xero cover image
Revenue dashboard for Xero

Xero revenue analytics covering invoices, 12‑month P&L, top customers, and top products to guide cash flow and sales decisions.

Revenue dashboard for Xero focused on revenue, cash flow, and sales performance. Monitor invoices with totals for paid, due, overdue, and open amounts alongside monthly trends. Review a 12‑month Profit & Loss table showing revenue, direct costs, and operating expenses. Identify top customers and products by revenue, plus average revenue per customer, number of products sold, and average price. See invoice details by customer and status to spot blockers and opportunities.
Free
TikTok Organic report template for Looker Studio cover image
TikTok Organic report template for Looker Studio

Track TikTok Organic performance, identify top videos, and analyze audience demographics to refine your content strategy.

TikTok Organic performance tracking focused on views, likes, shares, comments, follower growth, and profile views. Surfaces top-performing videos with engagement, full‑watch rates, and trend lines to spot what’s working over time. Breaks down audience by gender and country to guide targeting and content planning. Highlights correlations between views and interactions to refine posting cadence and creative. Designed to optimize content strategy, boost visibility, and improve retention with clear, comparative insights.
Free
Snapchat Ads report template for Looker Studio cover image
Snapchat Ads report template for Looker Studio

Comprehensive Snapchat Ads analytics in Looker Studio to track costs, conversions, ROAS, and audience performance.

Snapchat Ads performance template for Looker Studio focused on campaign, ad group, and creative analysis. Track impressions, clicks, CTR, CPC, eCPM, conversions, CPA, ROAS, and spend to evaluate efficiency and ROI. Compare results by ad format and placement, and identify winning segments by country, device (iOS vs Android), age, and gender. Turn trends and breakdowns into clear actions to optimize budgets, boost engagement, and scale profitable campaigns.
Free
Snapchat Ads dashboard cover image
Snapchat Ads dashboard

Snapchat Ads analytics with KPIs, trends, and campaign comparisons to optimize spend and conversions.

Snapchat Ads performance dashboard focused on spend, reach, impressions, views, swipe ups, purchases, and cost efficiency metrics like eCPM, eCPV, and eCPSU. Visualizes daily trends and spend dynamics to catch rising costs or underperforming periods. Highlights top campaigns by swipe ups and provides a detailed campaign table for fast comparisons of status, costs, rates, and outcomes. Helps optimize budgets and creative strategy to drive more conversions at lower costs.
Free
Free Shopify Sales Funnel Dashboard Template for Looker Studio cover image
Free Shopify Sales Funnel Dashboard Template for Looker Studio

Free Looker Studio template for Shopify that highlights funnel performance, revenue, and channel impact across sources and sales channels.

A free Looker Studio template to analyze the Shopify sales funnel and revenue performance. Track gross and net sales, discounts, average order value, refunds, inventory, order count, and orders per customer. Compare traffic sources and Shopify sales channels to see which campaigns and storefronts drive revenue and conversions, with time-series trends and breakdowns. Use the insights to spot bottlenecks, lift conversion, and allocate spend to the highest‑impact channels. White‑label and customizable via Windsor.ai’s connector.
Free
Display Video 360 Account Summary V2 0 cover image
Display Video 360 Account Summary V2 0

DV360 Looker Studio template summarizing campaign-to-line item performance with device, environment, exchange, creative, and inventory QA views.

DV360 Account Summary for Looker Studio focused on Display & Video 360 performance across advertisers, campaigns, insertion orders, and line items. View revenue and CPM with breakdowns by device, environment, and exchange to spot where spend and results concentrate. Tabs extend into DV360 hierarchy, creative performance, and URL/exchange analysis, with an additional QA section for inventory and DMP checks. Filters for advertiser, campaign, device, line item status, exchange, and creative type keep analysis targeted. Built for media buyers and analysts who need a quick, consistent read on core DV360 KPIs.
Free
QuickBooks Revenue dashboard cover image
QuickBooks Revenue dashboard

Revenue dashboard for Looker Studio that analyzes QuickBooks/Xero income, P&L, customers, products, and invoices.

Revenue analytics template for Looker Studio focused on tracking income and profitability from QuickBooks or Xero data. Monitors paid, overdue, and open invoices alongside month‑to‑date and year‑to‑date Profit & Loss. Surfaces customer metrics such as total customers, revenue by customer, and average revenue per customer to target retention and collections. Reveals product performance with top products, quantities, and average prices to guide pricing and assortment. Includes a detailed invoice table for audit trails and cash‑flow follow‑up.
Free
CRM dashboard for Pipedrive cover image
CRM dashboard for Pipedrive

Pipedrive CRM template for monitoring pipeline health, conversion rates, revenue trends, and rep performance.

Pipedrive CRM template focused on revenue and pipeline performance across teams and deal labels. Tracks essentials like total sales, win rate, close rate, average days to close, pipeline value, open deals, weighted pipeline, and deal age. Includes time‑series for closed and projected value, stacked pipelines by agent and label, and a monthly deal stage breakdown to spot bottlenecks. Highlights top vs. underperforming reps to guide coaching, forecasting, and prioritization.
Free
Pinterest Ads report template for Looker Studio cover image
Pinterest Ads report template for Looker Studio

Track Pinterest Ads ROI with CTR, conversions, CPA/ROAS, and spend across campaigns, ad groups, and ads.

Pinterest Ads performance template for Looker Studio that tracks impressions, pin clicks, CTR, engagements, conversions, CPA, ROAS, CPC, CPM, and spend. Compare campaigns, ad groups, and creatives to spot winners and fix underperformers. Visualize conversions vs. spend and total order value to guide budget and bidding decisions. Evaluate cost efficiency and ad formats (video, carousel, standard) to improve targeting and creative strategy. Powered by the Pinterest Ads connector from Reporting Ninja.
Free
Microsoft Advertising report template for Looker Studio cover image
Microsoft Advertising report template for Looker Studio

Analyze Microsoft Advertising performance by campaign, keyword, audience, device, location, and time to boost ROAS.

Microsoft Advertising (Bing Ads) template for Looker Studio that tracks impressions, clicks, CTR, conversions, CPC/CPA, spend, and ROAS across campaigns, ads, and keywords. Compare performance by network, match type, device, location, and demographics to find high-ROI segments. Spot time-of-day and day-of-week trends, monitor cost efficiency, and quickly identify top campaigns and search queries. Ideal for optimizing budgets and improving return from Bing Ads.
Free
Mailchimp report template cover image
Mailchimp report template

Mailchimp Looker Studio dashboard covering campaigns, e‑commerce, list health, bounces, A/B tests, and industry benchmarks.

Mailchimp analytics template for Looker Studio focused on email campaign performance and revenue. Brings together campaigns, core email KPIs, e‑commerce results, list growth, bounces, and A/B testing insights. Compares your metrics against industry benchmarks to highlight strengths and gaps. Helps diagnose deliverability issues and refine content and cadence based on test outcomes and engagement.
Free
LinkedIn Pages report template for Looker Studio cover image
LinkedIn Pages report template for Looker Studio

LinkedIn Pages analytics for followers, visitors, and post engagement with detailed audience and device breakdowns.

LinkedIn Pages performance template focused on tracking follower growth, page views, and engagement across posts. Compare paid vs. organic follower gains and monitor visitor traffic by device, country, industry, function, seniority, and company size. Surface top posts, impressions, clicks, likes, comments, shares, and engagement rates by content type. Spot trends over time to refine content strategy, improve reach, and strengthen brand visibility.
Free
LinkedIn page and ads analytics cover image
LinkedIn page and ads analytics

A LinkedIn page and ads analytics template covering key KPIs, campaign performance, and geo insights.

LinkedIn page and ads analytics for tracking campaign performance and organic reach in one place. Monitor impressions, clicks, cost, CPM, CPC, CTR, organic page views, and spend over time to spot trends and optimize budgets. Review a campaign overview table with landing page clicks and frequency to identify top performers and underachievers. Compare countries with geo maps for ad impressions and page views to refine targeting. Ideal for marketers who need quick answers on efficiency, growth, and where to scale on LinkedIn.
Free
Klaviyo - Email SMS Campaign Report cover image
Klaviyo - Email SMS Campaign Report

Klaviyo Email & SMS analytics in Looker Studio covering performance, deliverability, audience insights, and channel impact.

Klaviyo Email & SMS Campaign template for Looker Studio tracks core email KPIs—open rate, click rate, conversions, revenue per campaign, and deliverability signals like bounces, unsubscribes, and spam complaints. Visual insights include time-series trends, heatmaps, maps by country and city, and campaign-level tables to spot winners and underperformers fast. Audience analysis highlights peak engagement times, geography, and device preferences to refine targeting. Subscriber growth and segment performance reveal which cohorts drive conversions, while side‑by‑side email vs SMS views clarify each channel’s contribution.
Free
Social Media competitors report template cover image
Social Media competitors report template

Benchmark competitors across major social platforms and uncover winning content, audience trends, and campaign impact.

A competitive social media template for Looker Studio that benchmarks your brand against rivals across Instagram, Facebook, LinkedIn, TikTok, Pinterest, and Google Business Profile. Track engagement rates, follower growth, reach, ad spend, and content performance to pinpoint what competitors do best. Segment results by time, platform, demographics, location, device, and post type to uncover strategic opportunities. Blend multiple sources to create a single view of the market and highlight top-performing campaigns and posts. White‑label visuals, custom metrics, historical data, filters, and scheduled email alerts make it client‑ready and actionable.
Free
Instagram business dashboard cover image
Instagram business dashboard

Instagram analytics for Looker Studio to compare profiles, monitor reach and engagement, analyze audience, and optimize content performance.

Instagram Business Dashboard for Looker Studio unifies analytics across multiple Instagram profiles to benchmark reach, impressions, and engagement. Track likes, comments, shares, saves, website clicks, “Get directions,” and Reels plays to see what content drives outcomes. Explore follower demographics and day‑of‑week patterns, plus follower reach rate, to refine targeting and posting schedules. Assess performance by media type and individual posts to optimize creative and improve results. Auto‑updated charts keep metrics current for fast, confident reporting.
Free
CRM report template cover image
CRM report template

B2B CRM dashboard for Looker Studio to track pipeline, revenue, conversion rates, and rep performance using HubSpot data.

A Looker Studio CRM template focused on B2B performance, tracking sales revenue, total deals, won/lost ratios, and lead-to-customer conversion. Visualizations cover pipeline by stage, funnel performance, time to close, and performance by assignee to find bottlenecks and high-impact opportunities. Segment results by sales region, product category, and customer segment to compare outcomes and prioritize actions. Pull metrics such as contacts created, deals closed, email sends, opens, clicks, bounces, and campaign revenue from sources like HubSpot or Google Sheets. Designed to align marketing and sales around one view of pipeline health and growth.
Free
All-in-one marketing analytics dashboard cover image
All-in-one marketing analytics dashboard

Unified marketing overview for traffic, paid ads, and organic search in one place.

All‑in‑one marketing overview template that unifies website analytics, paid media, and organic search in a single view. Track top traffic sources, compare paid channels, and monitor ads performance alongside Google search insights. Connect data from Google Analytics and major ad networks to see clicks, cost, conversions, and trends together. Identify winning channels and reallocate budget with confidence.
Free
SEO dashboard template by Goolge on how to combine Google Search Console Google Analytics 4 cover image
SEO dashboard template by Goolge on how to combine Google Search Console Google Analytics 4

GA + Search Console template to track organic sessions, clicks, CTR, top pages/queries, and country performance.

Unified view of organic performance using Google Analytics and Search Console. Track organic sessions, engaged sessions, engagement rate, and the share of traffic from organic over time. Follow clicks, impressions, and CTR trends, and spotlight top pages and queries driving results. Compare countries with period‑over‑period change to surface growth opportunities. Built for SEO and content teams to quickly see what’s working and where to focus next.
Free
Google Business Profile Overview cover image
Google Business Profile Overview

Google My Business overview template that tracks visibility, engagement, and reviews in Looker Studio.

Google My Business performance dashboard for Looker Studio focused on local visibility, engagement, and reputation. Track search impressions, website visits, phone calls, direction requests, and views split by Google Search versus Maps with trend lines and totals. Monitor reviews with average star rating, total review count, and per‑location ratings to catch issues early. Surface top search terms and total views to guide listing optimization and drive footfall or calls. Ideal for agencies and multi‑location brands needing a quick snapshot of what’s working.
Free
Google Business Profile report template for Looker Studio cover image
Google Business Profile report template for Looker Studio

Google My Business analytics for tracking performance, reviews, and search terms to grow local visibility and actions.

Google My Business performance dashboard focused on local visibility and customer actions. Track impressions, clicks, calls, website visits, and directions requests across Search vs Maps and by device. Monitor reviews with average rating trends, volume over time, common comments, and sentiment. Identify top search terms and keywords that drive impressions and engagement. Use these insights to optimize your Google Business Profile and boost local SEO results.
Free
GA4 General Ecommerce Report View Only cover image
GA4 General Ecommerce Report View Only

GA4 ecommerce analytics template covering traffic, engagement, and sales across channels, campaigns, devices, countries, products, and events.

GA4 template for general and ecommerce analytics that brings marketing and sales metrics into one view. Track users, new users, sessions, engaged sessions, engagement rate, and views with clear trends. Break down acquisition by source/medium and campaigns, plus device mix and country. Dive into transactions, product and category performance (including pivots), events, and internal promotions with technical details. Pinpoint winning channels, surface engagement issues, and link marketing activity to revenue.
Free
Google Analytics 4 GA4 Essential cover image
Google Analytics 4 GA4 Essential

GA4 Looker Studio template for analyzing traffic sources and e‑commerce results, including engaged sessions, transactions, revenue, and ARPU.

Built on Google Analytics 4 data in Looker Studio, the GA4 Essential template centers on acquisition and e‑commerce performance. A heat‑mapped source/medium table surfaces total and new users, sessions, engaged sessions, engagement rate, transactions, total revenue, and ARPU. Filters for country, device category, and date enable quick comparison of segments and channels. Additional sections cover overview, e‑commerce charts, page/screen views, and events & tech details for a complete read on site performance. Ideal for pinpointing the channels that drive engaged sessions and revenue.
Free
GA4 Looker Studio Template cover image
GA4 Looker Studio Template

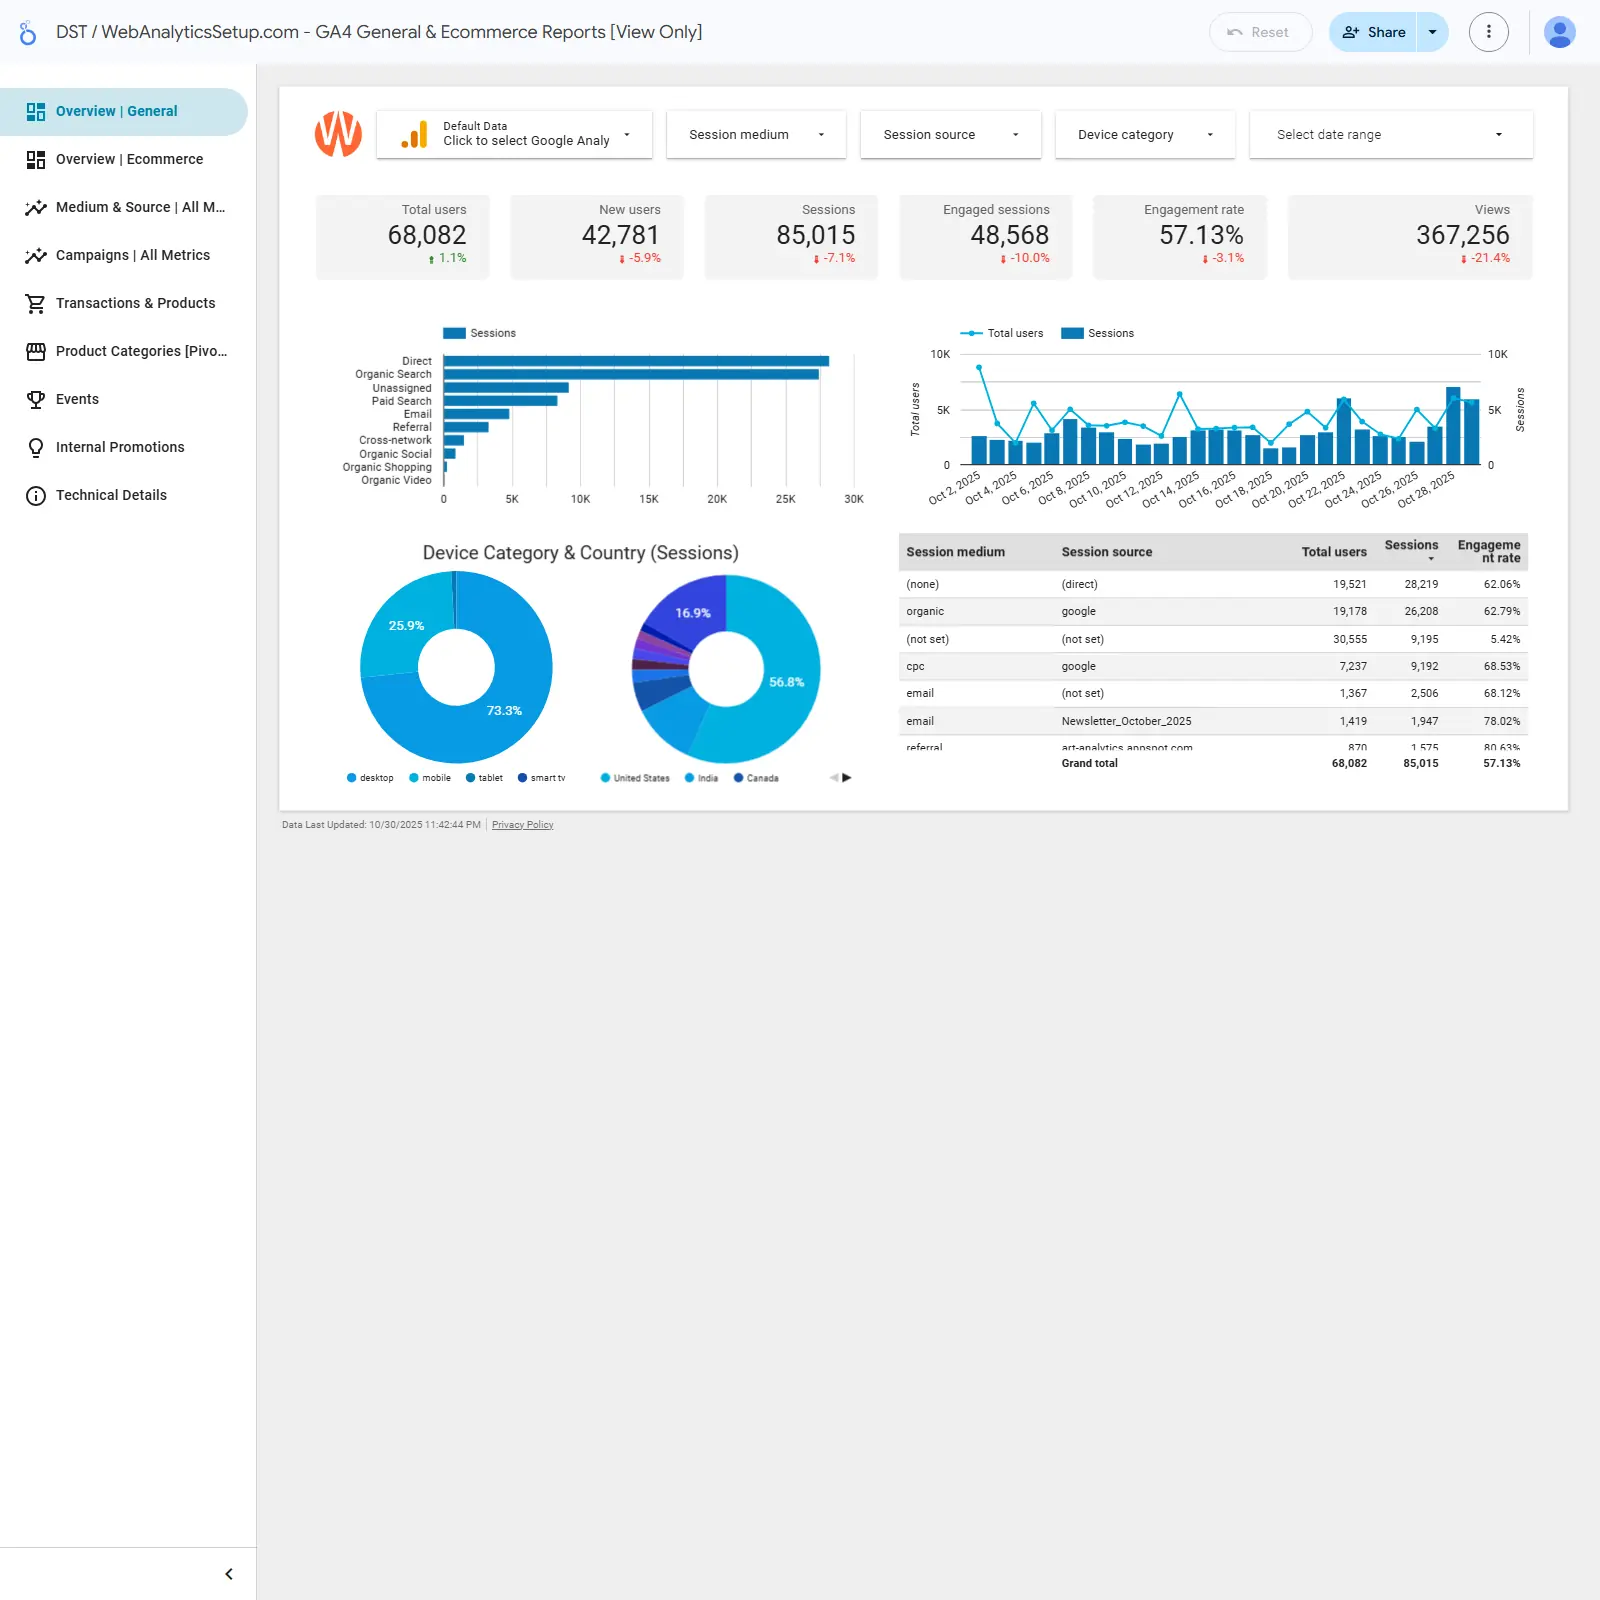
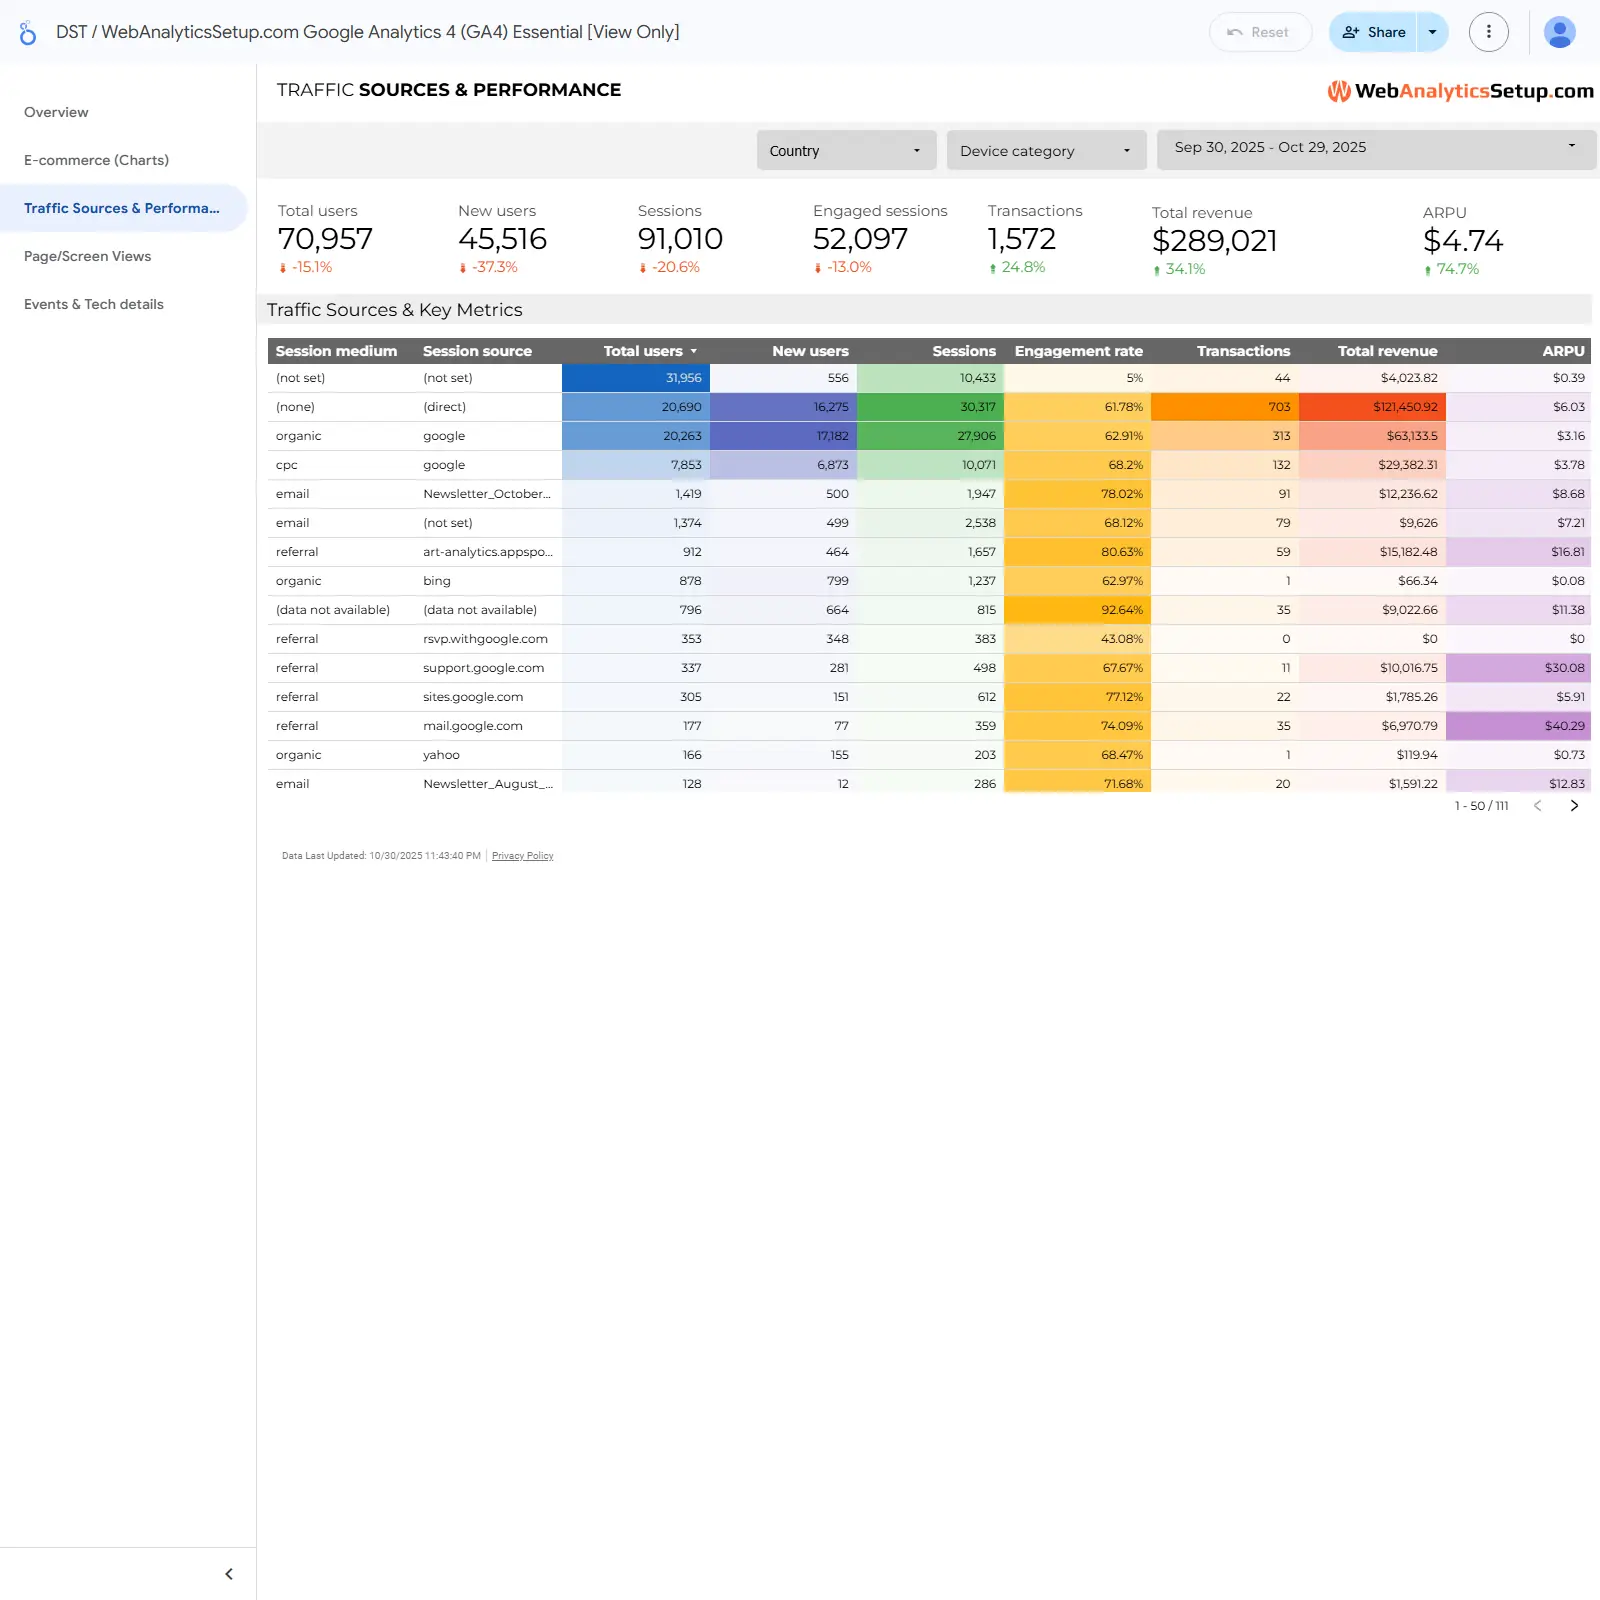
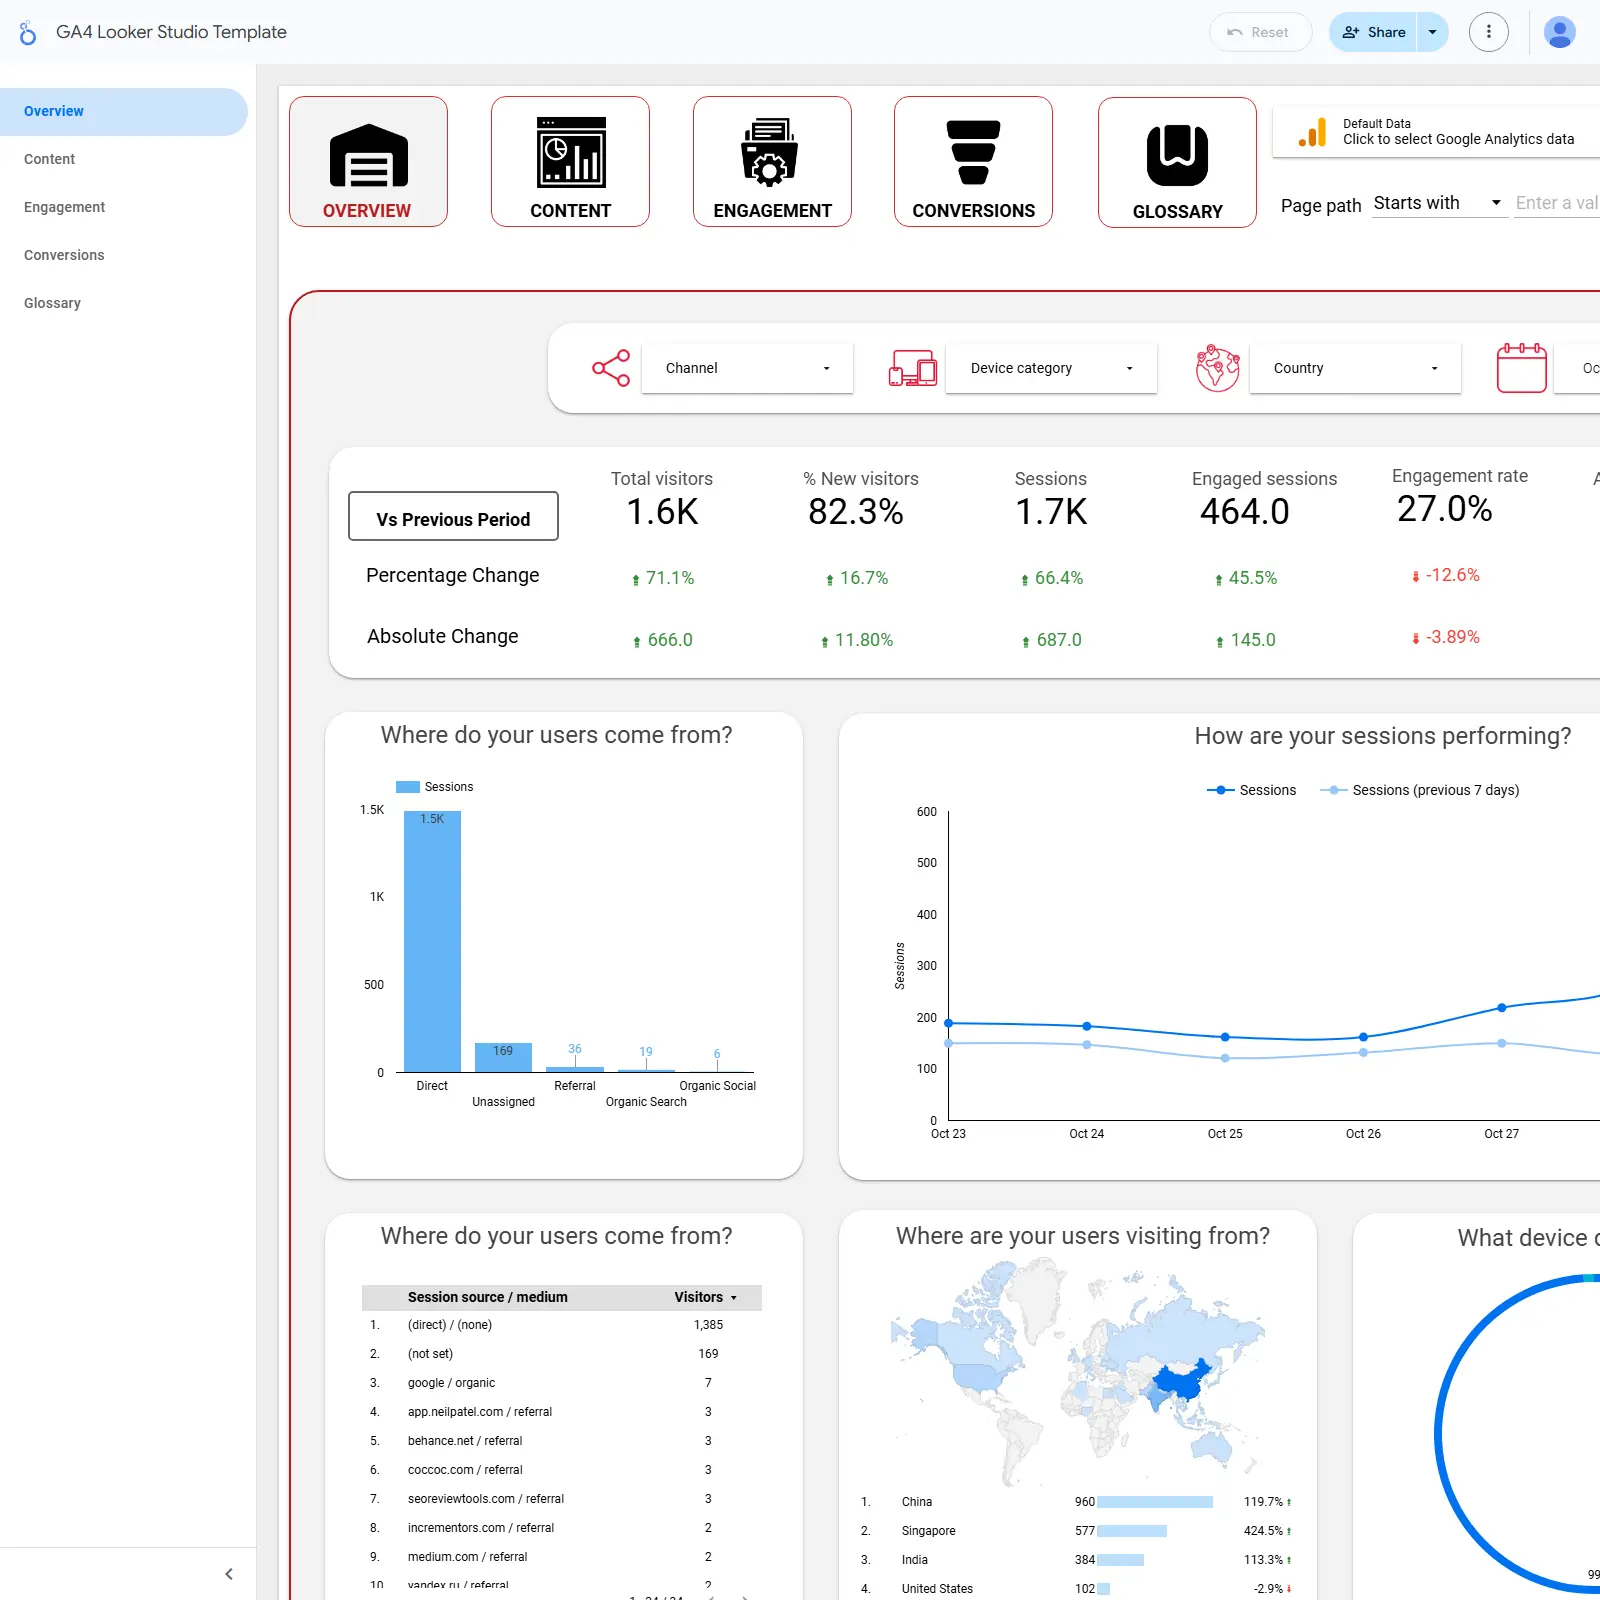
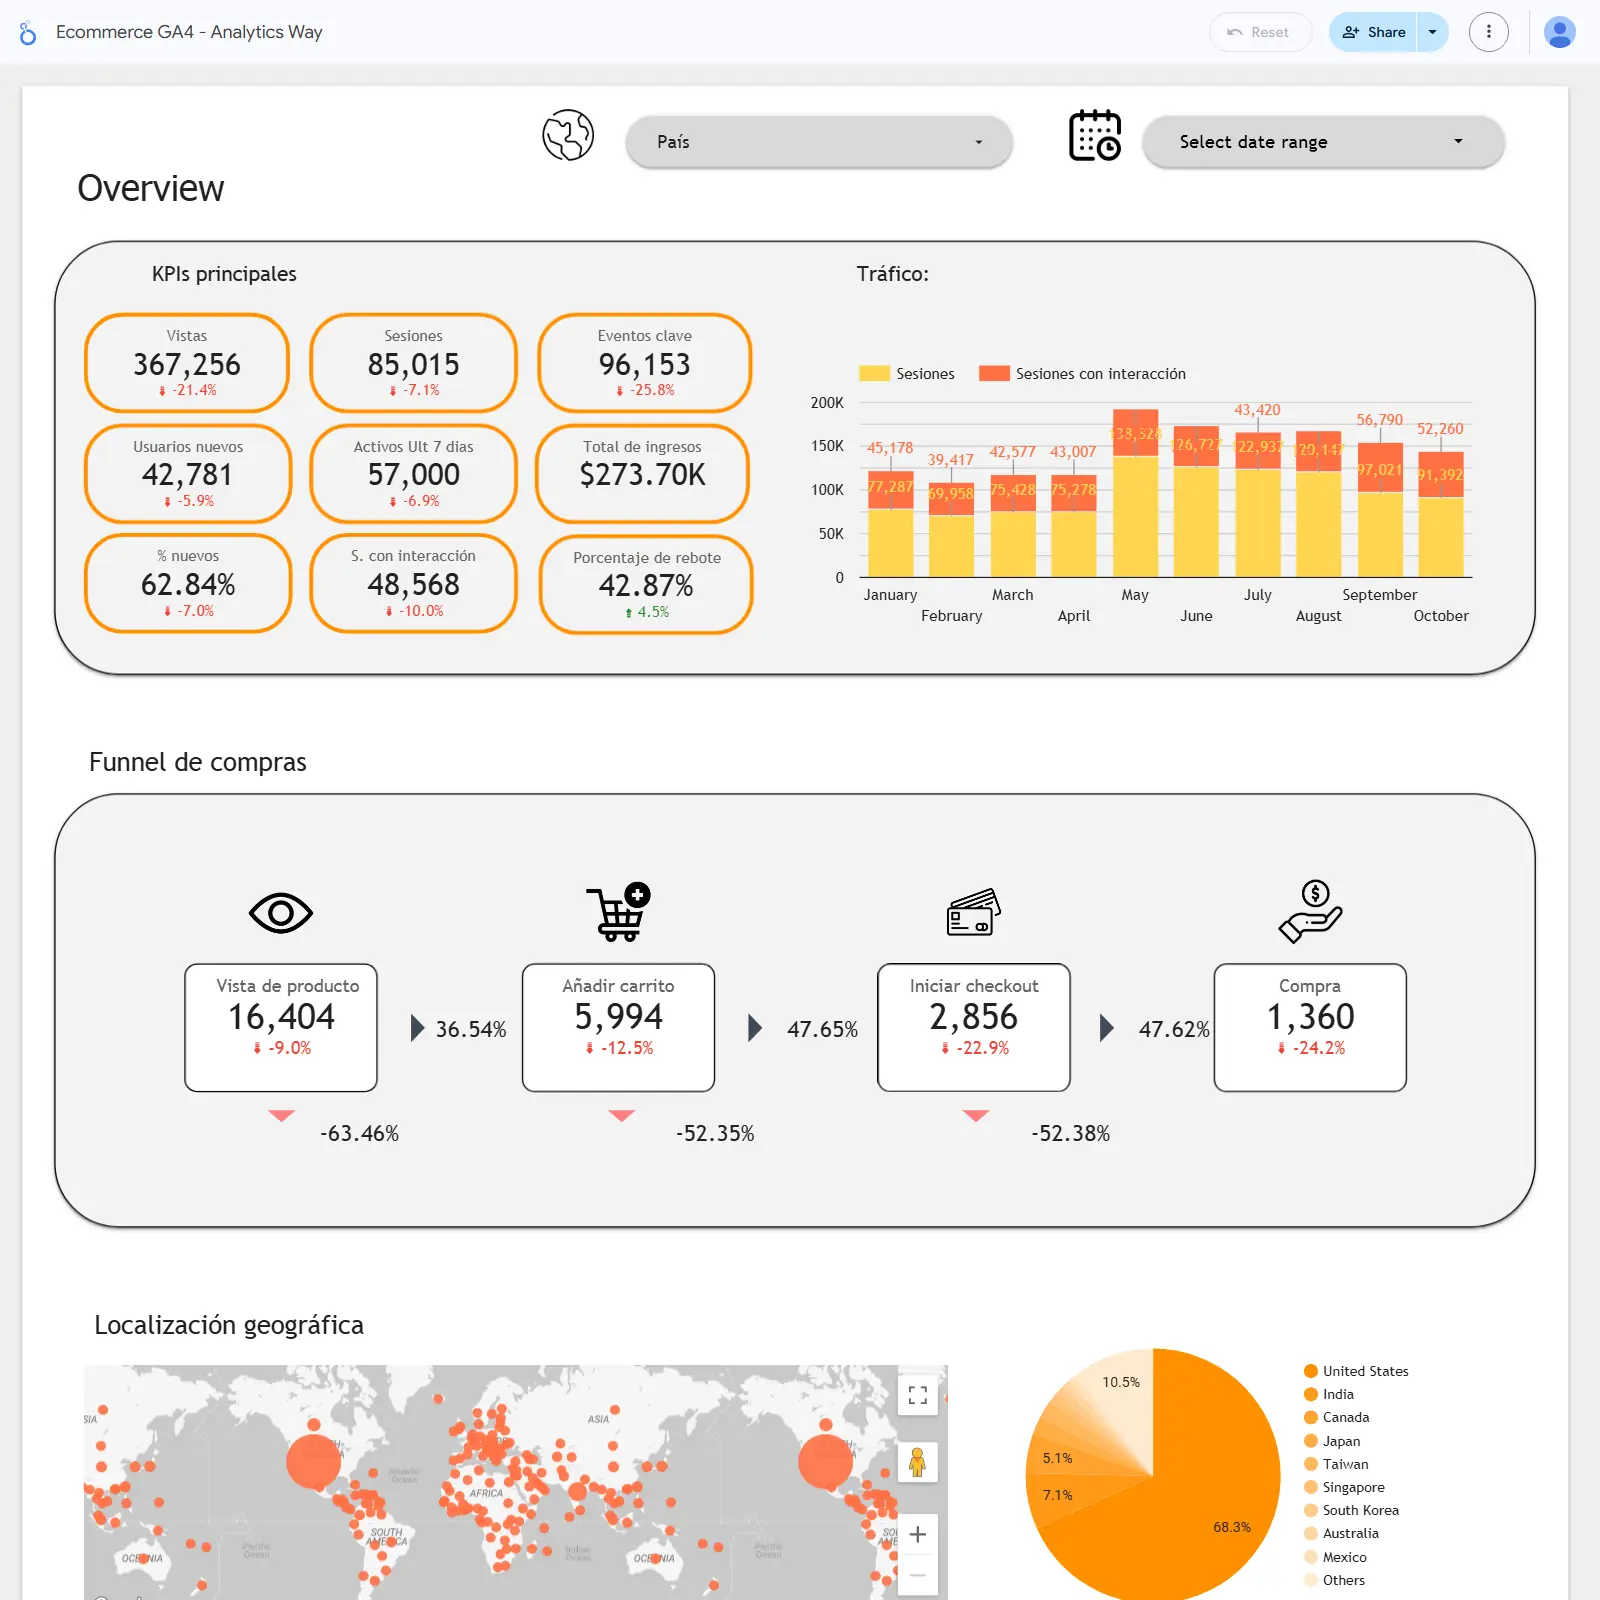
All‑in‑one GA4 template to track visitors, engagement, content results, and conversions by channel, device, and country.

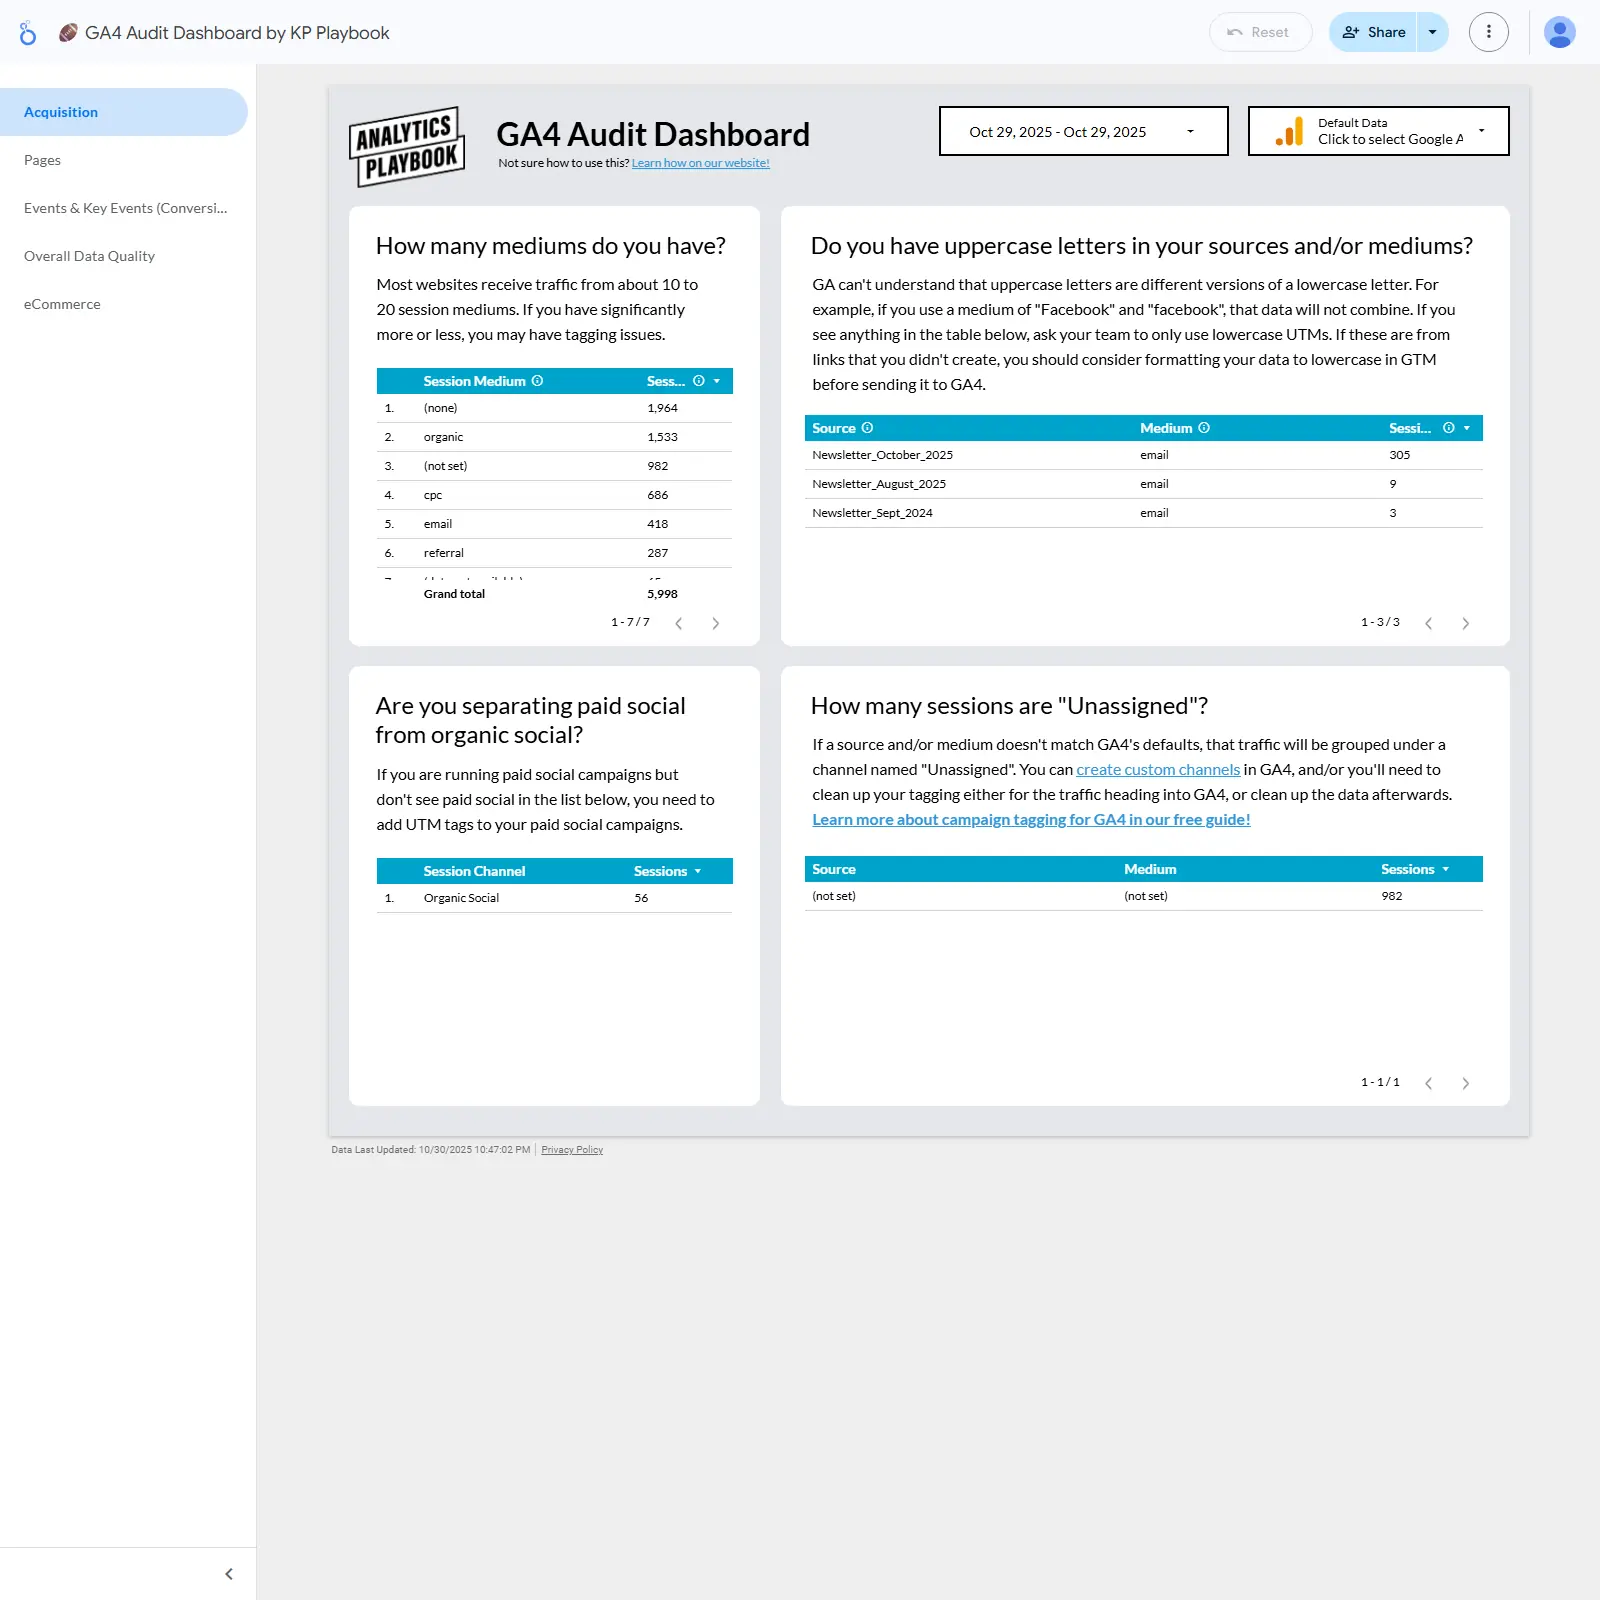
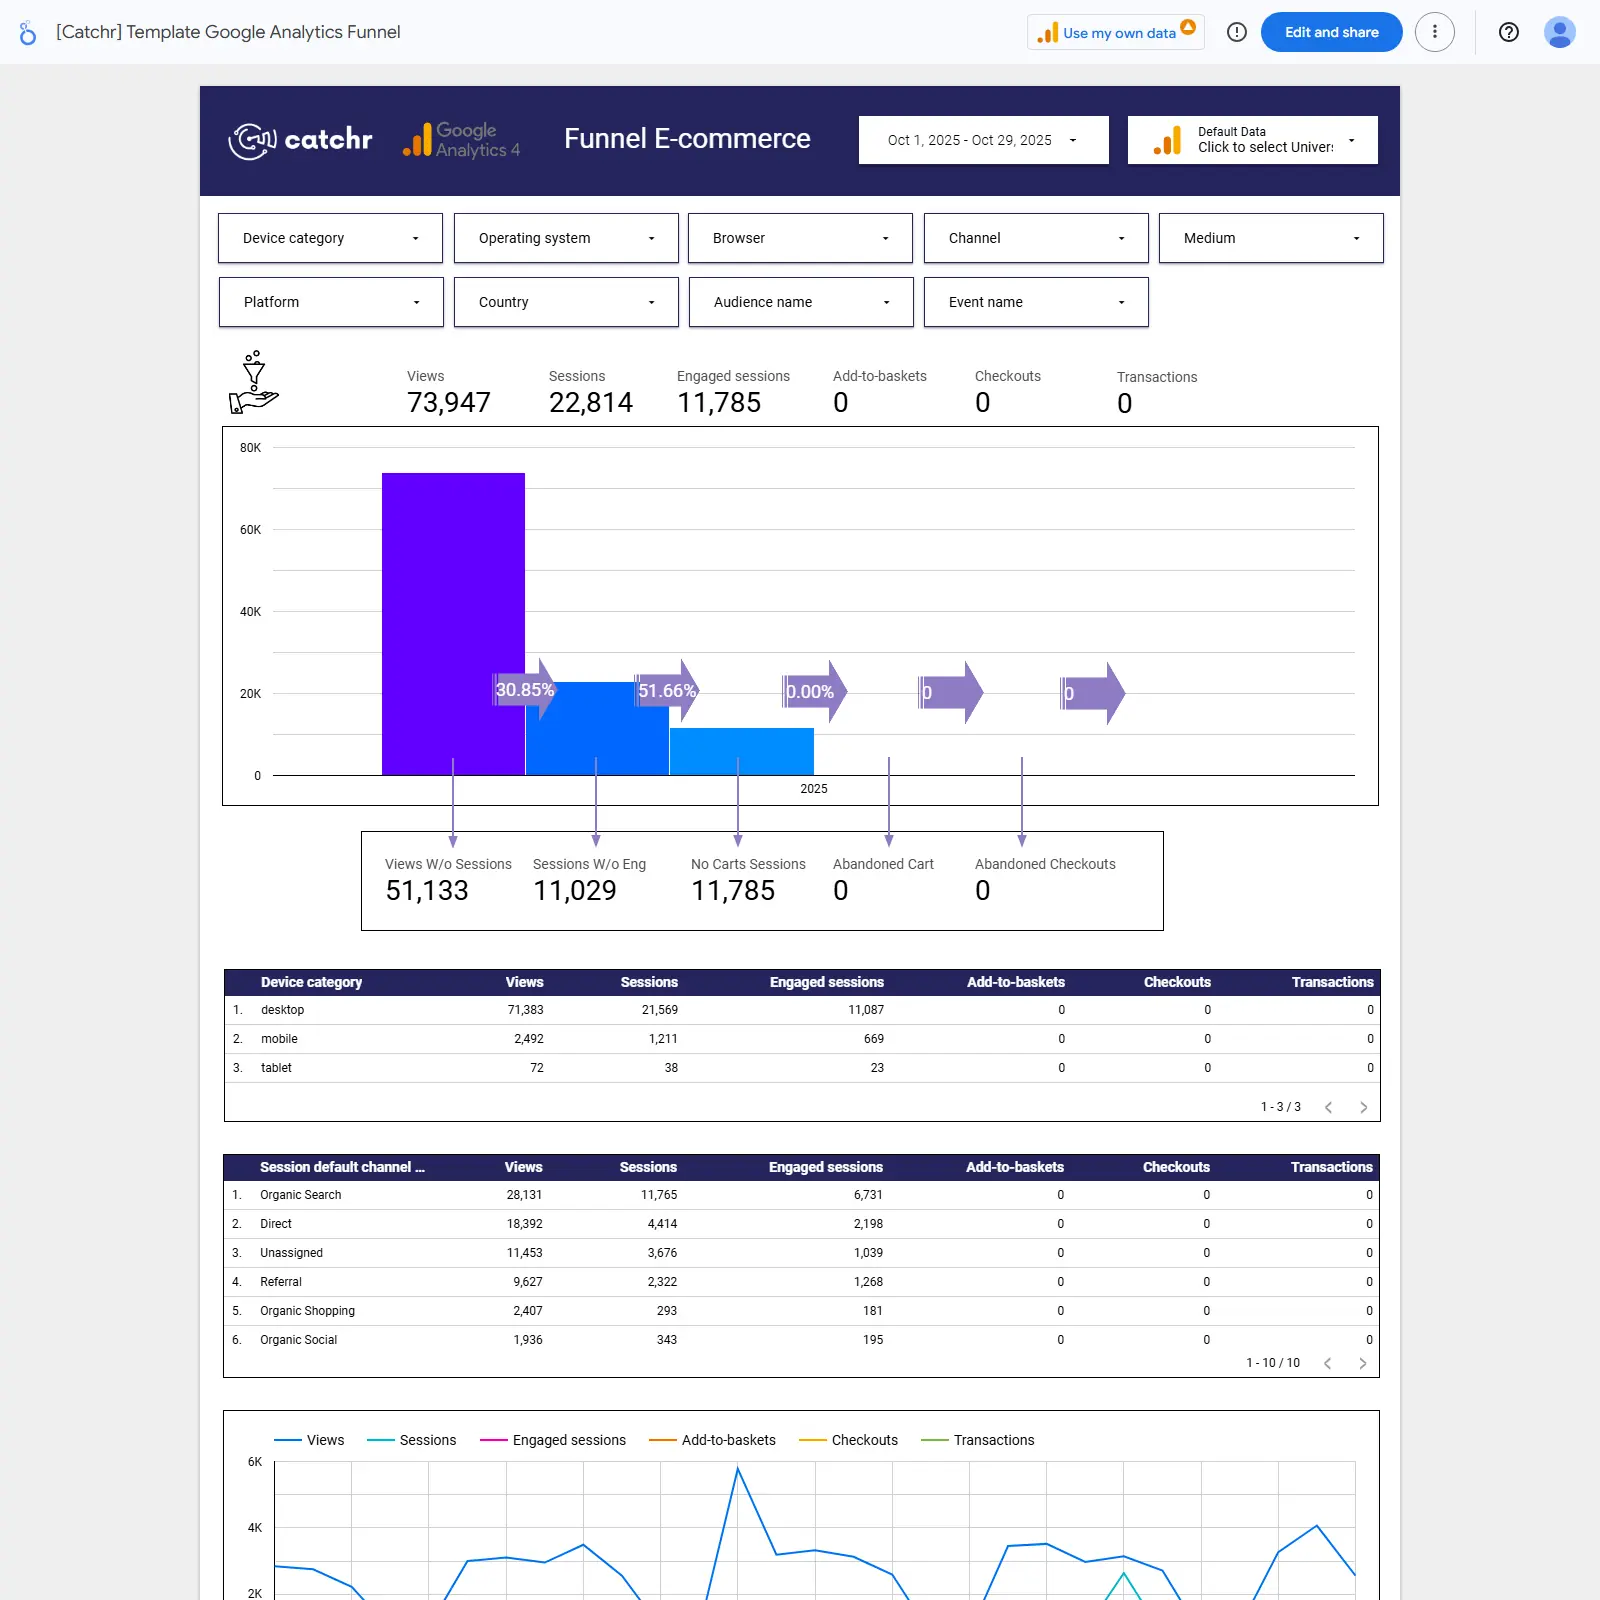
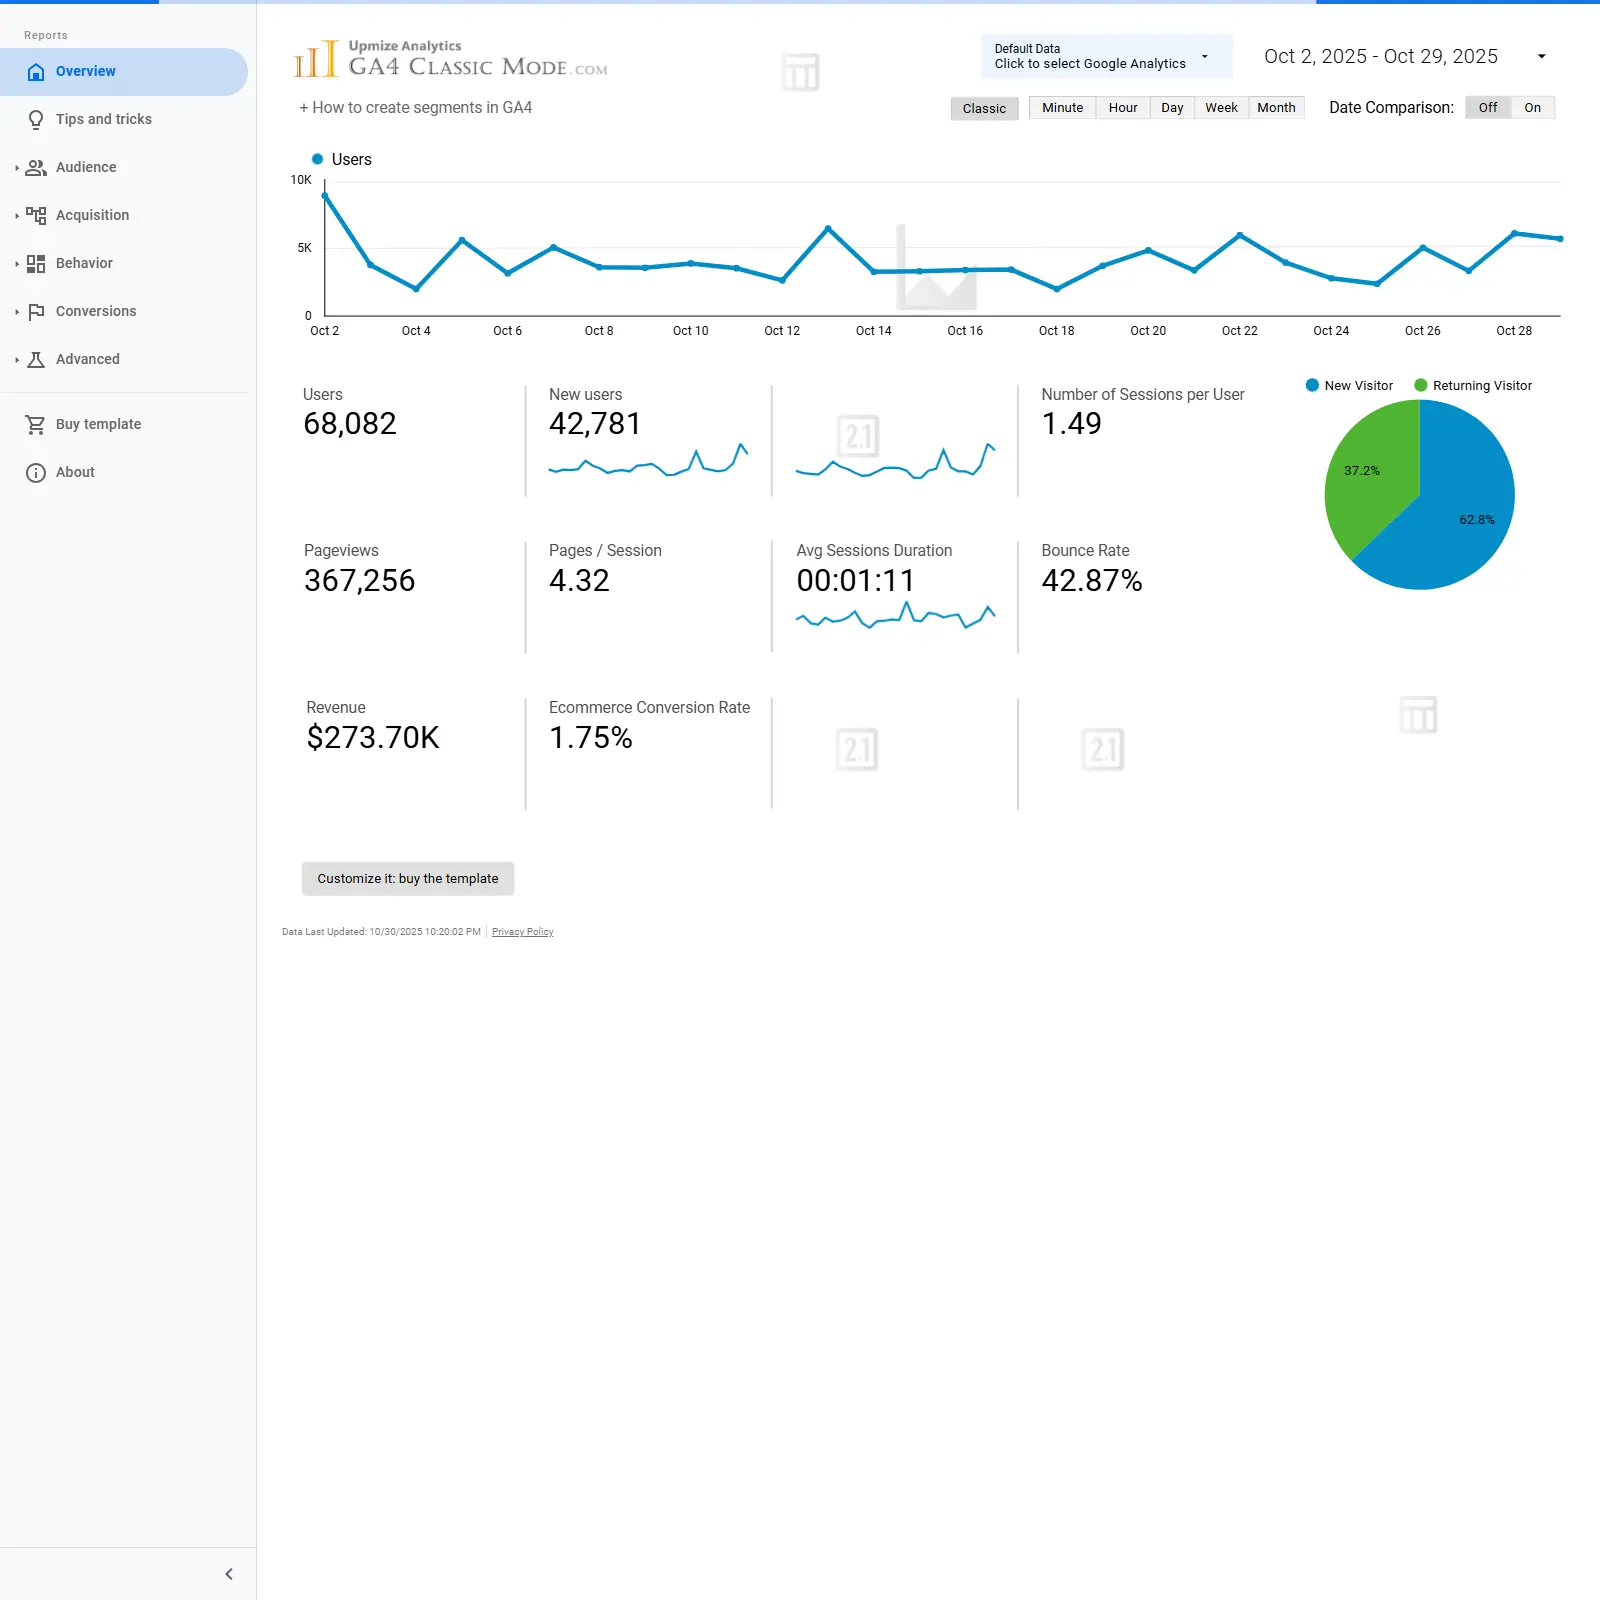
GA4 Looker Studio template focused on measuring website and app performance across Overview, Content, Engagement, and Conversions. Tracks core KPIs like total visitors, percent new visitors, sessions, engaged sessions, and engagement rate with period-over-period change indicators. Visuals highlight channel/source performance, time‑series trends, top traffic sources, country heatmap, and device mix to reveal where users come from and how they behave. Helps identify winning content, pinpoint drop‑offs, and connect acquisition and engagement to conversion outcomes. Ideal for marketers, analysts, and decision‑makers who need fast, actionable GA4 insights.
Free
GA4 Lead Generation Report cover image
GA4 Lead Generation Report

GA4 funnel analysis for spotting drop‑offs and channel performance across each step of the user journey.

GA4 funnel analysis template focused on tracking user progression from page views to item views, selections, and other key events. Highlights step-by-step drop‑offs with a funnel chart and detailed tables by source/medium, helping pinpoint where traffic loses momentum. Surfaces acquisition insights alongside geography, demographics, landing pages, and device views to understand which audiences and channels drive deeper engagement. Ideal for optimizing campaigns and on‑site journeys by identifying the steps that most influence conversion.
Free
lespl Ecommerce GA4 - Analytics Way cover image
lespl Ecommerce GA4 - Analytics Way

GA4 ecommerce overview for revenue, traffic trends, conversion funnel, and country performance.

GA4 ecommerce performance template focused on traffic, revenue, and conversion health. It highlights core KPIs such as views, sessions, key events, new and active users, engaged sessions, bounce rate, and total revenue. Monthly traffic trends compare sessions vs engaged sessions to spot demand shifts. A purchase funnel traces product views to add-to-cart, checkout, and completed orders with conversion and drop‑off rates to identify bottlenecks. Geographic breakdown pinpoints top countries and market share to guide targeting.
Free
Newsletter - UTM Tagging cover image
Newsletter - UTM Tagging

GA4 UTM auditing template that flags untagged URLs and malformed UTMs to protect attribution accuracy.

UTM Tagging Auditor for Google Analytics 4 that audits campaign tagging quality and protects attribution accuracy. Highlights untagged campaign URLs and sessions where auto‑tagging is enabled but utm_source, utm_medium, or utm_campaign are missing, with counts by page location. Surfaces anomalies like unusually long UTM values and separates issues with clear red/green indicators for fast triage. Helps marketers prioritize fixes so channel and campaign performance reporting stays trustworthy.
Free
GA4 404 Error Monitoring Dashboard cover image
GA4 404 Error Monitoring Dashboard

GA4-powered Looker Studio template for finding, analyzing, and prioritizing website 404 errors.

Monitors and investigates 404 errors using Google Analytics 4 data in Looker Studio. Pinpoints broken URLs, where they occur, and which sources and campaigns drive traffic to them. Surfaces trends, volumes, and user actions on 404 pages to gauge impact on users and conversions. Helps prioritize fixes to stop wasted ad spend and improve SEO and site experience.
Free
Ultimate GA4 Ecommerce Dashboard cover image
Ultimate GA4 Ecommerce Dashboard

GA4 eCommerce Looker Studio template for revenue, acquisition, product, and conversion insights.

An eCommerce Looker Studio template built for GA4 that highlights revenue, AOV, transactions, users, and conversion rate at a glance. Pinpoint winning channels with acquisition breakdowns and revenue by country, device, and browser. Spot trends with revenue over time and conversion rate by day of the week to optimize campaigns and timing. Drill into page and product performance to surface best‑selling items and the pages that drive sales. Ideal for ecommerce managers and marketers needing quick, actionable insights from GA4 data.
Free
Website Speed Performance cover image
Website Speed Performance

GA4 website speed template to monitor load times and spot slow pages across devices, browsers, OS, and time.

GA4 Website Speed Performance Template focused on measuring how fast pages load and where delays happen. Tracks DNS, TCP connect, server response, DOM interactive, content load, and full page load times with clear trends. Compares performance across devices, browsers, operating systems, and time of day. Surfaces the slowest landing pages and groups them by load‑time thresholds to target fixes. Helps teams prioritize speed improvements that boost user experience and conversions.
Free
GA4 Audit Dashboard by KP Playbook cover image
GA4 Audit Dashboard by KP Playbook

GA4 audit template focused on UTM hygiene, channel grouping accuracy, and end‑to‑end data quality across acquisition, pages, events, and eCommerce.

GA4 Audit Dashboard to diagnose Google Analytics 4 data quality and tagging issues. Highlights UTM hygiene such as uppercase/lowercase mismatches in sources and mediums, excessive or messy medium lists, and missing separation of paid vs. organic social. Surfaces “Unassigned” sessions and other channel grouping problems so you can fix tracking at the source. Includes sections for Acquisition, Pages, Events/Key Events, Overall Data Quality, and eCommerce to validate end‑to‑end GA4 setup. Built for quick, actionable insights that improve accuracy and reporting reliability.
Free
Google Analytics Funnel Template cover image
Google Analytics Funnel Template

GA4 e-commerce funnel tracking that pinpoints drop‑offs from visit to purchase by device and channel to boost conversions.

GA4 e-commerce funnel analytics focused on every step from visits and sessions to engaged sessions, add‑to‑baskets, checkouts, and transactions. Quantifies drop‑offs and abandonment to reveal where shoppers exit the path to purchase. Breaks performance down by device, channel, country, browser, and more to spot conversion blockers and winning sources. Combines funnel visuals, detailed tables, and trends to highlight issues and growth opportunities. Built to help prioritize fixes that increase revenue.
Free
GA4 Classic Mode - Upmize Analytics cover image
GA4 Classic Mode - Upmize Analytics

GA4 “Classic Mode” template that mirrors UA to track traffic, engagement, and ecommerce performance at a glance.

GA4 template modeled after Universal Analytics “Classic Mode” for fast, familiar performance tracking. Monitor users, new users, sessions per user, pageviews, pages per session, average session duration, bounce rate, revenue, and ecommerce conversion rate with time-series trends and a new vs. returning visitor split. Organized navigation across Overview, Audience, Acquisition, Behavior, Conversions, and Advanced sections. Ideal for teams migrating from UA who want actionable GA4 insights without relearning their workflow.
Free
Branded organic search vs paid campaign performance dashboard for Google cover image
Branded organic search vs paid campaign performance dashboard for Google

Compare paid vs organic search to track clicks, impressions, CTR, spend, and share of clicks by keyword.

Paid vs organic search performance in one place to see how keywords drive visibility and traffic. Track impressions, clicks, CTR, spend, and share of clicks over time and by search term. Compare organic vs paid CTR and impressions to uncover cannibalization or lift. Highlight high‑impact keywords to shift budget, improve creatives, and align SEO with PPC.
Free
Cross-platform report template for Looker Studio cover image
Cross-platform report template for Looker Studio

Unified ad performance dashboard comparing spend, clicks, CTR, conversions, and ROI across Facebook, Google, LinkedIn, and other channels.

Cross-platform Looker Studio template for unifying marketing performance from Facebook Ads, Google Ads, LinkedIn Ads, and more. Brings together cost, impressions, clicks, CTR, conversions, conversion rate, and efficiency metrics like CPA/ROAS to compare channels side by side. Pinpoints which platforms drive the best results and how cost per conversion and ROI stack up to guide budget shifts. Trend views surface seasonality and performance changes by channel and account for faster decisions. Built to highlight total impact and reveal opportunities to reallocate spend to top performers.
Free
Google Ads vs Facebook Ads comparison template cover image
Google Ads vs Facebook Ads comparison template

Side‑by‑side comparison of Google Ads vs Facebook Ads across CTR, CPC, CPA, cost, impressions, clicks, and conversions.

Compare Google Ads and Facebook Ads head‑to‑head to find the stronger acquisition channel. Track CTR, CPC, cost per conversion, total cost, impressions, clicks, and conversions side‑by‑side for quick benchmarking. Highlight audience and performance differences with demographics insights to guide budget shifts. Clean comparison cards make it easy to spot trends and winners fast. Built by Supermetrics for marketers running paid media on both platforms.
Free
Google Ads Audience report template cover image
Google Ads Audience report template

Google Ads audience analytics in Looker Studio with segment-level insights on reach, CTR, conversions, CPA, and ROAS.

Monitor Google Ads audience performance across reach, conversions, CTR, CPC/CPM, cost per conversion, and ROAS. Segment results by demographics, devices, locations, time of day, campaign, ad group, keyword, and audience to spot high‑value segments. Identify which audiences and geographies drive the most impressions and conversions and how costs vary by segment. Built for PPC teams to compare results and shift budget toward profitable audiences.
Free
Google Ads YouTube Performance cover image
Google Ads YouTube Performance

Google Ads YouTube for Action performance dashboard covering KPIs, ad groups, creatives, engagement, and day‑of‑week insights.

Track Google Ads YouTube for Action performance with a clear overview of key KPIs like impressions, views, clicks, cost, and conversions. Drill into Ad Groups and Creatives to compare results and spot best‑performing assets. Review engagement metrics and view-rate trends, plus day‑of‑week patterns for clicks, views, and conversions. Surface top campaigns to guide budget shifts and creative optimizations.
Free