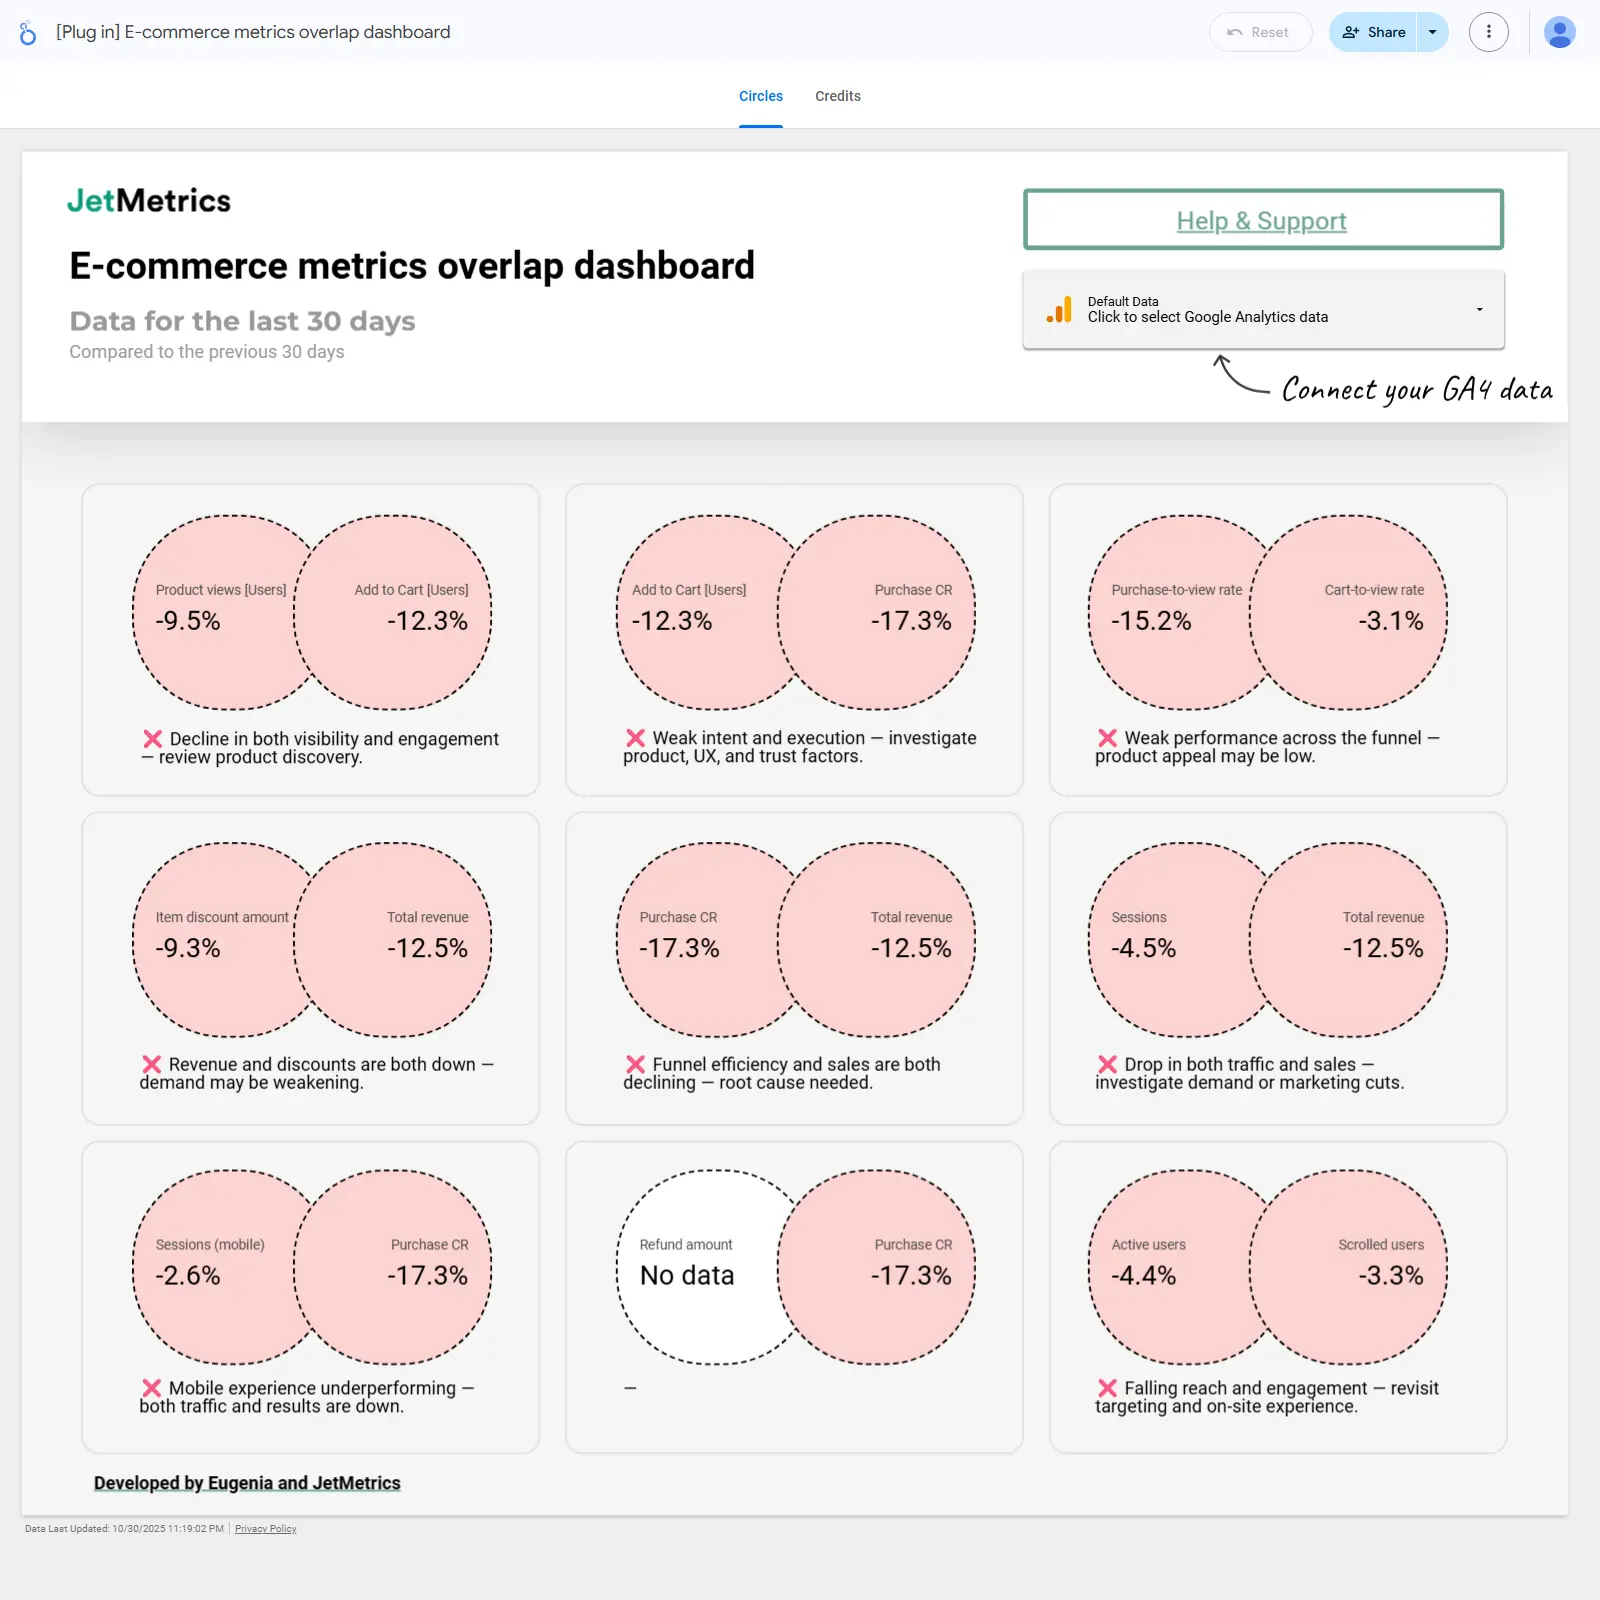
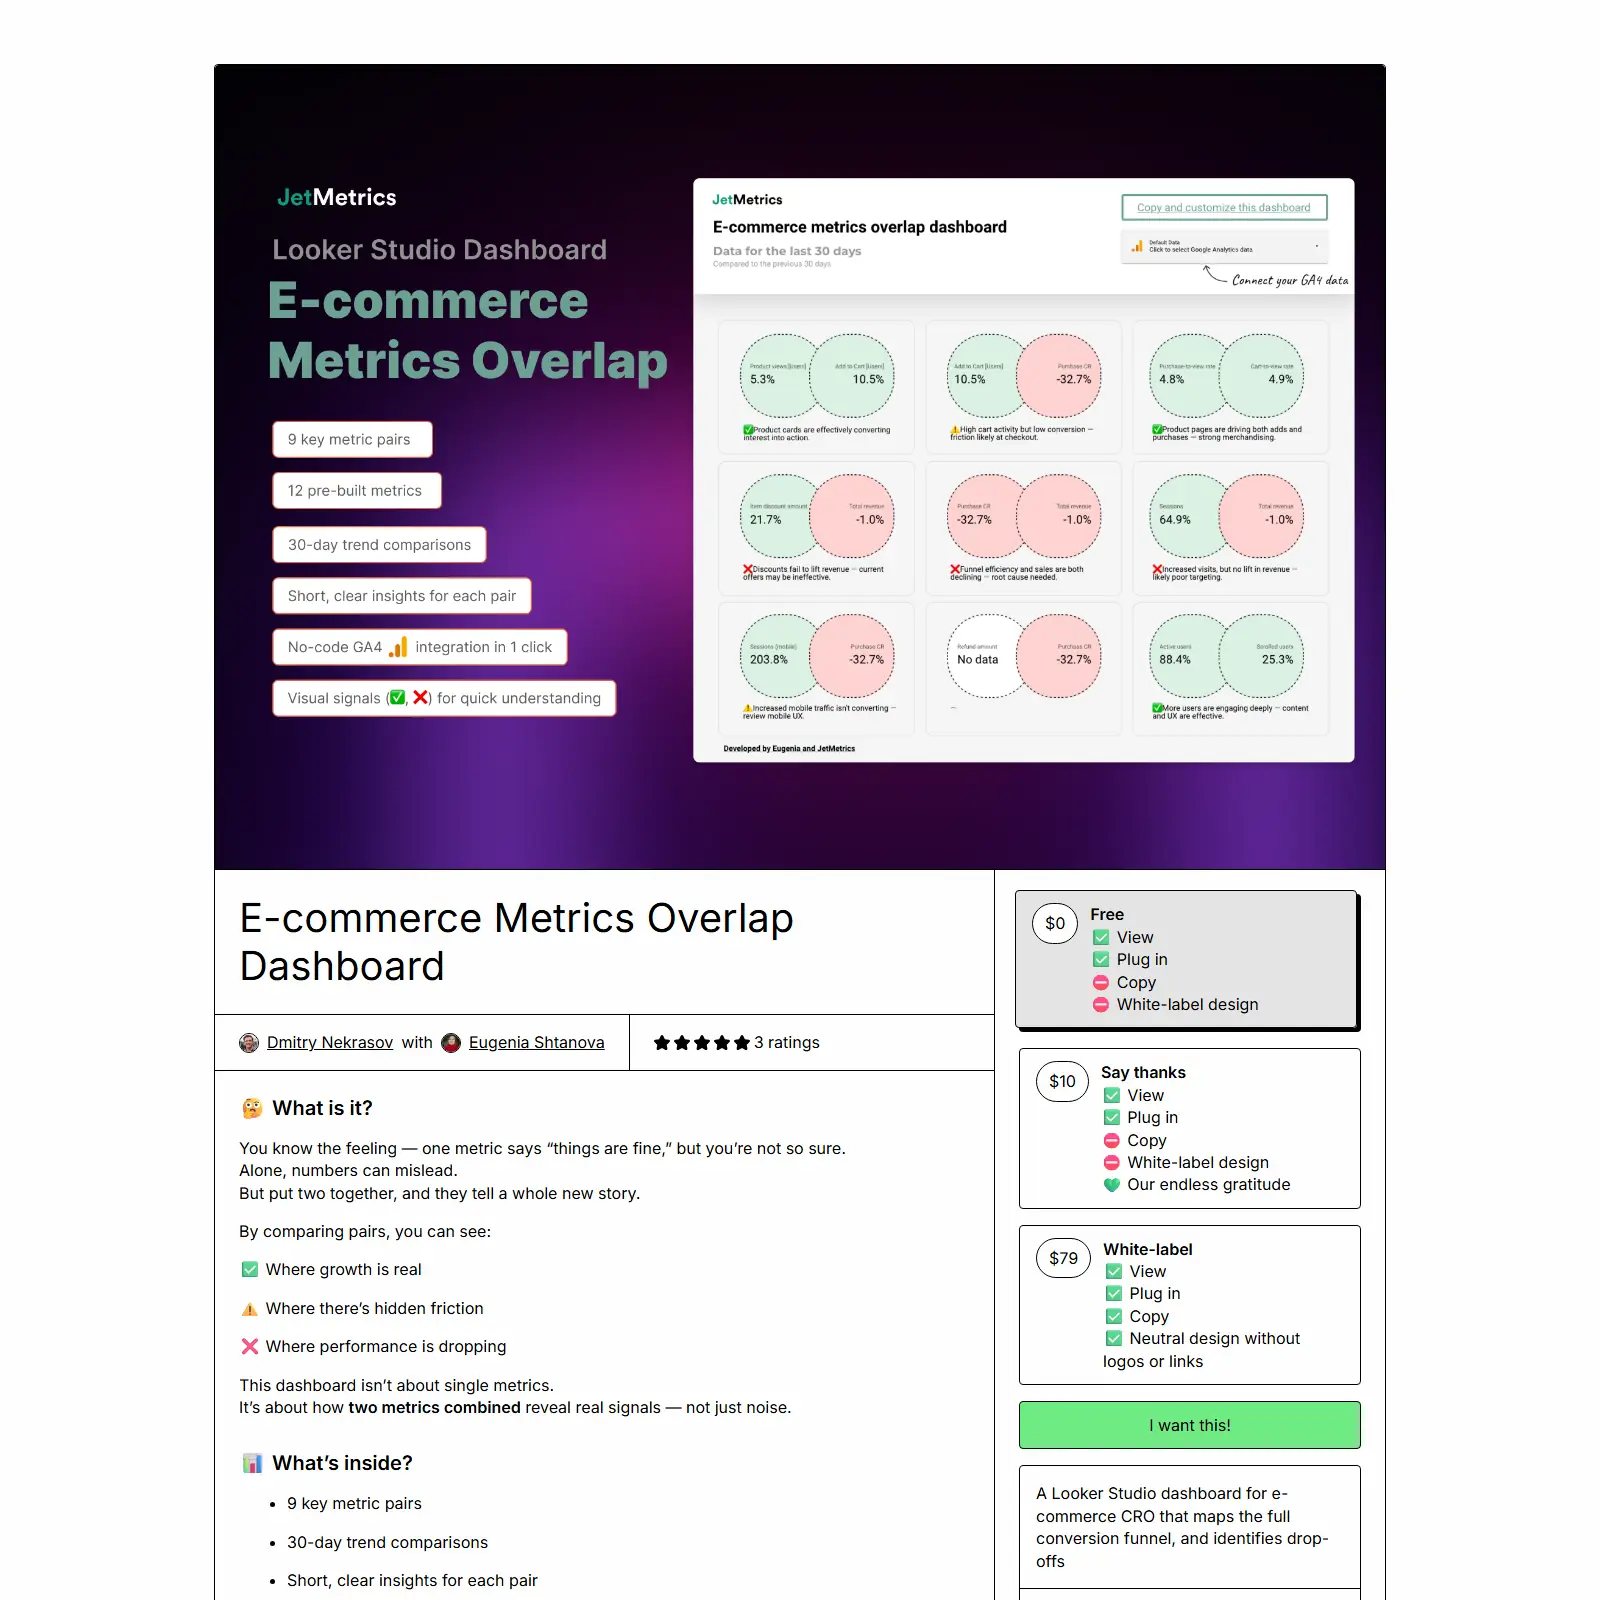
Pairs up key GA4 e‑commerce metrics to reveal how signals change across the conversion funnel and where drop‑offs happen. Nine curated metric pairs (e.g., product views vs add‑to‑cart, purchase rate vs revenue, sessions vs revenue) are visualized as overlaps with clear ✅/⚠️/❌ indicators. 30‑day trend comparisons and short, plain‑English insights highlight real growth, hidden friction, and performance declines. Built for e‑commerce teams, agencies, and consultants who need to explain the “why” behind results and prioritize fixes. Works with Google Analytics 4 data and offers a white‑label option for client delivery.