€49
€89
Lifetime


By proceeding with your purchase, you acknowledge that you have read and agree to our Template License Agreement.
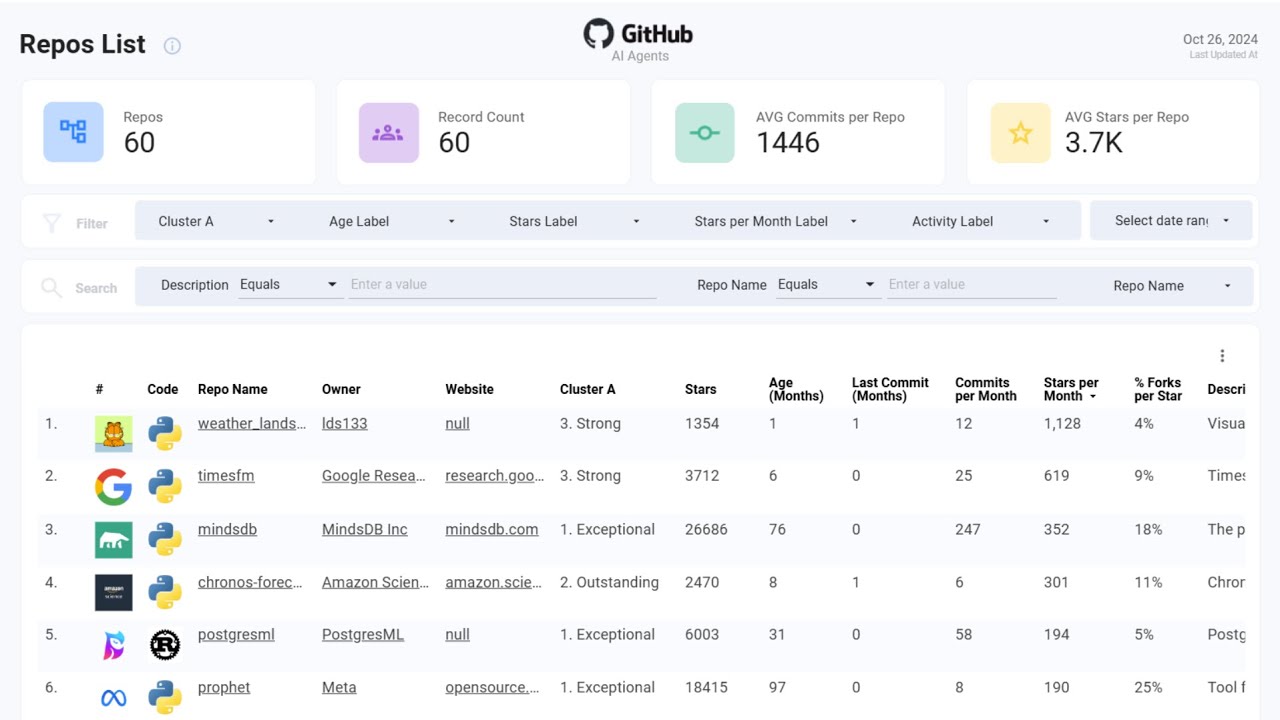
Analyzing GitHub repositories on a specific topic is essential for gaining insights into the open-source landscape. This dashboard reveals community interests, compares project popularity, growth rates, and momentum through various metrics, and clusters projects for an at-a-glance view. By analyzing this dashboard, it can highlight gaps where new tools could be developed, inspire innovative solutions and new project ideas, showcase best practices through top projects, and inform product development by leveraging existing projects as a foundation.
Designed exclusively for JustDataPlease Google Sheets Addon - Github Repo Research Connector (free) and Looker Studio.
Below, you’ll find a list of key measures that provide valuable insights into repository activity, popularity, and maintenance. Each measure offers a description to help you understand its purpose, along with details on why it’s important for assessing repository performance.
| Metric | Description | Importance |
|---|---|---|
| % Forks per Star | Represents the proportion of forks to stars a repository has received. | A high percentage indicates that the repository is widely used as a foundational library or utility, with many interested in modifying or building upon it. |
| Open PRs | The number of open pull requests in the repository. | Indicates the level of contribution and the maintainers' responsiveness in reviewing and merging changes. |
| Open Issues | The number of open issues in the repository. | Reflects the number of reported problems or enhancement requests, showing current workload and areas for improvement. |
| Last Commit (Months) | The number of months since the last commit was made. | Assesses how recently the repository has been updated, indicating ongoing maintenance and support. |
| Stars | The total number of stars a repository has received. | Represents the repository's popularity and appreciation by the community. |
| Commits | The total number of commits made to the repository. | Indicates the overall activity and development effort put into the project. |
| Age (Months) | The total age of the repository in months since its creation. | Reflects the maturity of the repository, providing context for other metrics over its lifespan. |
| Commits per Month | The number of commits made to the repository each month. | Measures the development pace and overall activity level. |
| Stars per Month | The number of stars a repository receives each month. | Indicates growing interest and popularity over time. |
| Activity Label | A label indicating the level of activity in the repository, such as "1. Active (<1 month)", "2. Moderately Maintained (1-6 months)", "3. Inactive (6-12 months)", or "4. Freeze (>12 months)". | Provides a quick overview of the repository's activity level. |
| Stars per Month Label | A label describing the trend of stars per month, such as "1. Breakout Hit (>100 stars/month)", "2. Popular Choice (20-100 stars/month)", "3. Gaining Momentum (5-20 stars/month)", or "4. Slow (<5 stars/month)". | Identifies whether the repository's popularity is increasing, stable, or decreasing over time. |
| Age Label | A label describing the age of the repository, such as "1. Mature (>24 months)", "2. Growing (6-24 months)", or "3. New (<6 months)". | Offers a quick reference to the repository's maturity and development stage. |
| Stars Label | A label categorizing the number of stars, such as "1. Superstar (>3000 stars)", "2. Well Known (300-3000 stars)", "3. Rising Star (<300 stars)", or "4. Under the Radar (<100 stars)". | Provides an at-a-glance understanding of the repository's popularity. |
| Cluster A | A label that categorizes repositories based on age, stars, and activity level into clusters such as "1. Exceptional," "2. Outstanding," "3. Strong," or "4. Weak." | Assesses the overall status and potential of repositories by combining other labels, helping understand performance and areas for improvement. |
With the GitHub Repos Research connector, you can use Github search syntrax:
| Qualifier | Matches |
|---|---|
| QUERY | Has QUERY anywhere |
| QUERY in:name | Has QUERY in the repository name |
| QUERY in:description | Has QUERY in the repository description |
| QUERY in:topics | Labeled with QUERY as a topic |
| QUERY in:readme | Has QUERY in the README file |
| topic:TOPIC | Has a topic of TOPIC |
You can also create complex queries using OR and AND logical operators to combine multiple subjects.
For example: ai OR agents OR llm OR agents
* OR and AND logical operators are not supported for topics on GitHub. To search for multiple topics, use topic:ai topic:agents, where only the AND operator is supported. This will return results that include both "ai" and "agents" as topics.
JustDataPlease Reports is a Google Sheets™ add-on that makes it easy to bring information from various sources directly into your spreadsheets. The data is automatically organized and formatted, so you can start reporting right away without any extra work.
| SKU | GIT-RES-GIT-GSC-GS-LS-TEM |
| Slug | github-repos-research-git-gs-ls-template |
| Product Type | Templates |
| Category | Web Analytics |
| Tags | Google Spreadsheets |
| Audience | Analyst |
| Business Type | Tech-Driven |
| Setup Time | 10' |
| Setup Difficulty | 1 | No technical knowledge needed — Use the Browser or Spreadsheets |
| Tech Used | Github - Google Spreadsheets Connector - Google Spreadsheets - Looker Studio |
This guide provides instructions on how to conduct research on GitHub repositories using the Github Repos Research Connector (JustDataPlease Google Sheets Connector) and Looker Studio.
A. Open a new Google Sheet by clicking here. In the top navigation bar, click Extensions > Add-ons > Get add-ons. In the pop-up window, search for JustDataPlease and install it. After installation, return to your sheet and In the top navbar bar locate Extensions > JustDataPlease > Launch Sidebar.
B. Setup the Github Repos Connector to import GitHub repositories data into your Google Sheet.
You will need to provide a GitHub Personal Access Token for authentication. For instructions on how to generate a GitHub Personal Access Token, please refer to this guide.
C. Once the data is imported, copy the URL of the specific sheet (the tab containing the GitHub repositories data) for the next step.
To create your own report in Looker Studio, follow the steps below.
A. Paste the URL of your Google Sheet containing the GitHub repositories data below, and click the Generate report button.
B. After being redirected to the report, click the Edit & Share button to review the data sources linked to the report. The button is located on the top navbar, on the right. If you do not see it, hover over the top navbar.
C. Click the Acknowledge and Save button.
D. When your report is ready, follow these steps to ensure it is fully functional:
In the top navigation bar, go to Resource > Manage added data sources and find the JustDataPlease | Github Sheet data source. Click Edit to modify it.
Locate the github_icon field and update its formula. Change the name from
github_icon to github_icon_safe and click Update. Do the same for language_icon, and return to the report.
On the first page > first table, click on the first two columns to authorize image view.
Finally, reload the report.
You have now generated your own copy of the report, and it is saved to your Looker Studio account. You have full access and control over it.
When you update your Google Sheet, the report will automatically update!
Find most common questions from our users. If you can't find yours, contact us!