Category: Marketing

The best free & paid Looker Studio templates, curated and quality-ranked for data reporting.

Clear All

Showing 81 - 120 of 367

Free X Twitter Ads Performance Dashboard on Looker Studio cover image
Free X Twitter Ads Performance Dashboard on Looker Studio

Free Looker Studio template to track and optimize X/Twitter Ads with key metrics like impressions, clicks, engagements, spend, conversions, and CPC/CPM.

A Looker Studio template for X/Twitter Ads that consolidates campaign metrics—impressions, clicks, engagements, spend, conversions, and cost efficiency (CPC, CPM, CPV)—into clear trend charts, scorecards, and campaign tables. Identify top-performing campaigns with time-series performance, side-by-side comparisons, and a spend-versus-engagement view. Uncover conversion-funnel insights from first touch to final action to refine targeting, creative, and bidding. Drive smarter budgeting and highlight ROAS drivers to communicate results confidently to stakeholders.
Free
Organic TikTok 4 pages side menu Metricool cover image
Organic TikTok 4 pages side menu Metricool

4-page TikTok organic analytics template (Metricool) covering growth, video performance, and audience demographics with period comparisons.

4-page Looker Studio template to analyze TikTok organic performance using Metricool data. Track followers, new followers, reach, views, videos posted, engagement, and interactions with month-over-month and year-over-year comparisons. Dig into daily trends and 12‑month growth, spotlight top videos, and review per‑video metrics like reach, engagement, average view time, and impression sources. Understand audience makeup with demographics by gender and country to refine content and targeting. Presentation‑ready visuals and a detailed video table support quick auditing and client reporting.
$57.96
TikTok Ads report template for Looker Studio cover image
TikTok Ads report template for Looker Studio

TikTok Ads performance and ROI tracking in Looker Studio across campaigns, ads, audiences, locations, and devices.

A Looker Studio template for TikTok Ads that consolidates campaign, ad group, and creative performance. Track impressions, clicks, CTR, conversions, CVR, CPC, CPM, CPA, ROAS, spend, and revenue. Compare formats and surface top campaigns while analyzing results by country, device, and demographics to find high‑value audiences. Use cost and efficiency views to guide budget shifts and boost return on ad spend.
Free
Quora Ads dashboard cover image
Quora Ads dashboard

Quora Ads analytics covering spend, reach, click metrics, campaign rankings, leads, CPL, and conversions.

Quora Ads performance template focused on spend efficiency and campaign impact. Track trends for amount spent, impressions, clicks, CTR, CPC, and CPM to spot shifts in reach and cost. Compare campaigns with top lists by spend, CTR, and lowest CPC to find quick optimization wins. Monitor lead generation, cost per lead, and conversions by date to gauge acquisition quality. Use it to reallocate budget toward the Quora campaigns that deliver the best results.
Free
Instagram Insights report template for Looker Studio cover image
Instagram Insights report template for Looker Studio

Instagram analytics template for Looker Studio tracking reach, impressions, engagement, followers, demographics, and top-performing content.

Optimize Instagram performance with a unified Looker Studio template that connects to Instagram Insights. Track reach, impressions, accounts engaged, follower growth, and lifetime profile stats with clear trend visuals. Compare media types—reels, stories, posts, carousels, ads—by reach, views, likes, comments, saves, and shares to identify top content. Explore audience demographics by age, gender, country, and city to refine targeting. Drill into post-level results and engagement rates to guide publishing and boost visibility.
Free
Instagram Insights report template cover image
Instagram Insights report template

Instagram analytics template that highlights engagement, growth, reach, top content, audience insights, and best time to post.

Instagram Insights template focused on tracking the performance of Instagram Business and Creator accounts in Looker Studio. Covers engagement rate, follower growth, reach, and top posts with sections for Profile performance, Profile actions, Posts, Post comparison, Best time to post, Stories, and Audience. Surfaces what content, hashtags, and formats resonate most and when to post for maximum engagement. Helps marketers understand audience demographics and validate where to invest time and budget across campaigns. Built by Porter with an Instagram Insights connector for complete, ongoing reporting.
Free
GA4 Content Performance Template cover image
GA4 Content Performance Template

GA4 content analytics in Looker Studio to find top pages, audiences, and channels and boost engagement and conversions.

Analyze how your website content performs in GA4 with an overview, page-level drill-downs, and a clear readers summary. Track sessions, engagement time, pages per session, bounce rate, page views, and average time on page across channels, devices, and sources. Identify top pages and content categories, peak engagement times, and the formats that resonate most. Compare new vs returning readers and understand audience demographics to guide editorial and distribution decisions. Evaluate channel performance and session behavior to optimize traffic growth, retention, and conversions in Looker Studio.
£99
Consent Mode Migration Impact Report cover image
Consent Mode Migration Impact Report

GA4 impact estimator for Google Consent Mode with before/after metrics, consent-rate modelling, and behavioural modelling eligibility.

Estimate the impact of moving to Google Consent Mode on GA4 by comparing key metrics before vs. after consent. Quantify expected data loss by adjusting consent acceptance rates and seeing changes to users, sessions, views, transactions, revenue, and tracked actions. Identify eligibility for GA4 behavioral modelling and monitor denied events and average daily users to understand modelling coverage. Use the modelling breakdown to communicate the expected impact period and magnitude to stakeholders. Ideal for teams evaluating a Consent Mode migration and its effect on reporting and conversions.
Free
GA4 Marketing Report Dashboard Demo cover image
GA4 Marketing Report Dashboard Demo

Google Analytics 4 marketing dashboard covering acquisition, engagement, monetization, user, and tech with powerful cross‑filtering.

GA4 Marketing Report Dashboard for Google Analytics 4 data, focused on website performance across Acquisition, Engagement, Monetization, User, and Tech. Advanced cross‑filtering enables quick drilldowns and instant insights that feel like applying a secondary dimension to any view. Built for marketers and decision‑makers who need a clear snapshot of key KPIs from multiple angles. Accessibility features include succinct chart descriptions to support screen readers.
Free
Google Ads Report Template cover image
Google Ads Report Template

Google Ads performance dashboard with campaign metrics, auction insights, cost analysis, and device breakdown to optimize PPC results.

Track Google Ads performance in Looker Studio with a clear overview of impressions, clicks, cost, and conversions. Dive into campaign-level metrics like CTR, CPC, and conversion rate to identify top performers and fix underperformers. Leverage Auction Insights to benchmark against competitors using impression share, average position, and overlap rate. Evaluate spend and efficiency with cost analysis and conversion tracking to improve returns. Compare mobile and desktop results to refine targeting and bids.
£89
Search Performance Overview cover image
Search Performance Overview

Looker Studio template to analyze Google Ads search performance across campaigns, keywords, devices, audiences, geos, and auction insights.

Google Ads Search Performance dashboard for Looker Studio that unifies account, campaign, ad group, keyword, and search query analytics. Tracks spend, impressions, clicks, CTR, CPC, conversions, CPA, and ROAS with daily trends and period-over-period comparisons. Explore device, demographic, and geographic views to pinpoint winning segments and eliminate wasted spend. Leverage auction insights to benchmark against competitors and guide bid and budget decisions. Built to give marketers fast, actionable visibility into search performance from overview to deep dive.
Free
Ads Overview cover image
Ads Overview

Unified ads reporting across Google, Microsoft, Meta, and LinkedIn with global and platform deep‑dives.

Cross-channel advertising overview for Google Ads, Microsoft Ads, Meta (Facebook/Instagram), and LinkedIn in a single Looker Studio template. Combines a global summary with platform-specific pages to compare performance and dig into each network. Highlights essential KPIs to track spend, reach, conversions, and cost efficiency so you can allocate budget with confidence. Powered by Catchr connectors for real-time, no‑code data sync. Built for marketers and agencies managing multiple ad accounts.
Free
Google Ads Experiments Performance cover image
Google Ads Experiments Performance

Evaluate Google Ads trial campaigns vs base campaigns and analyze incremental queries to find winning variants.

Google Ads Experiments Performance Dashboard compares trial campaigns against their corresponding base campaigns across selected accounts. It consolidates results into an executive summary, detailed performance comparisons, and incremental query analysis to surface queries uniquely captured by the experiment. Designed to quantify lift and efficiency changes so you can decide whether to scale, pause, or iterate variants. Ideal for advertisers running structured A/B tests who need fast, clear readouts.
Free
Google Ads creatives dashboard cover image
Google Ads creatives dashboard

Google Ads creative performance analytics with key KPIs, trends, and top creatives for optimization.

Google Ads creatives performance tracking focused on spend efficiency, reach, and engagement across campaigns, ad groups, and ad types. Key metrics include amount spent, impressions, clicks, CPC, CPM, and CTR with a detailed creative-level table for comparisons. Trend visuals highlight impressions vs. CPM, clicks vs. CPC, and spend dynamics over time. Ranking and breakdowns surface top-performing creatives by conversions and impressions by ad type to guide optimization.
Free
Google Ads keywords performance dashboard cover image
Google Ads keywords performance dashboard

Google Ads keyword performance analytics to optimize spend, clicks, and conversions across campaigns.

Google Ads keywords performance focused on measuring cost-efficiency and revenue impact across search terms and ad groups. Covers core KPIs such as cost, impressions, clicks, CTR, CPC, CPM, conversions, conversion value, conversion rate, and cost per conversion, with trend charts and a detailed keyword table to surface winners and waste. Highlights top keywords by clicks and visualizes shifts in impressions, CPC, and CPA over time to guide bid and budget decisions. Excludes Performance Max campaigns.
Free
Dashboard Google Ads One page internal analysis daily use cover image
Dashboard Google Ads One page internal analysis daily use

One-page Google Ads dashboard with WoW/MoM/YoY comparisons and campaign, ad group, keyword, and search term analysis for daily decisions.

One-page Google Ads performance template for daily internal analysis. Puts core KPIs—clicks, conversions, cost, CPC, and CTR—side by side with WoW, MoM, and YoY comparisons. Visual timelines highlight current‑month trends, while campaign, ad group, keyword, and search term tables surface winners and waste by match type. Built‑in filters (campaign, type, status, device) and an account selector focus insights quickly across accounts. Ideal for spotting shifts in efficiency and reallocating spend in minutes.
$29.97
Paid media report template cover image
Paid media report template

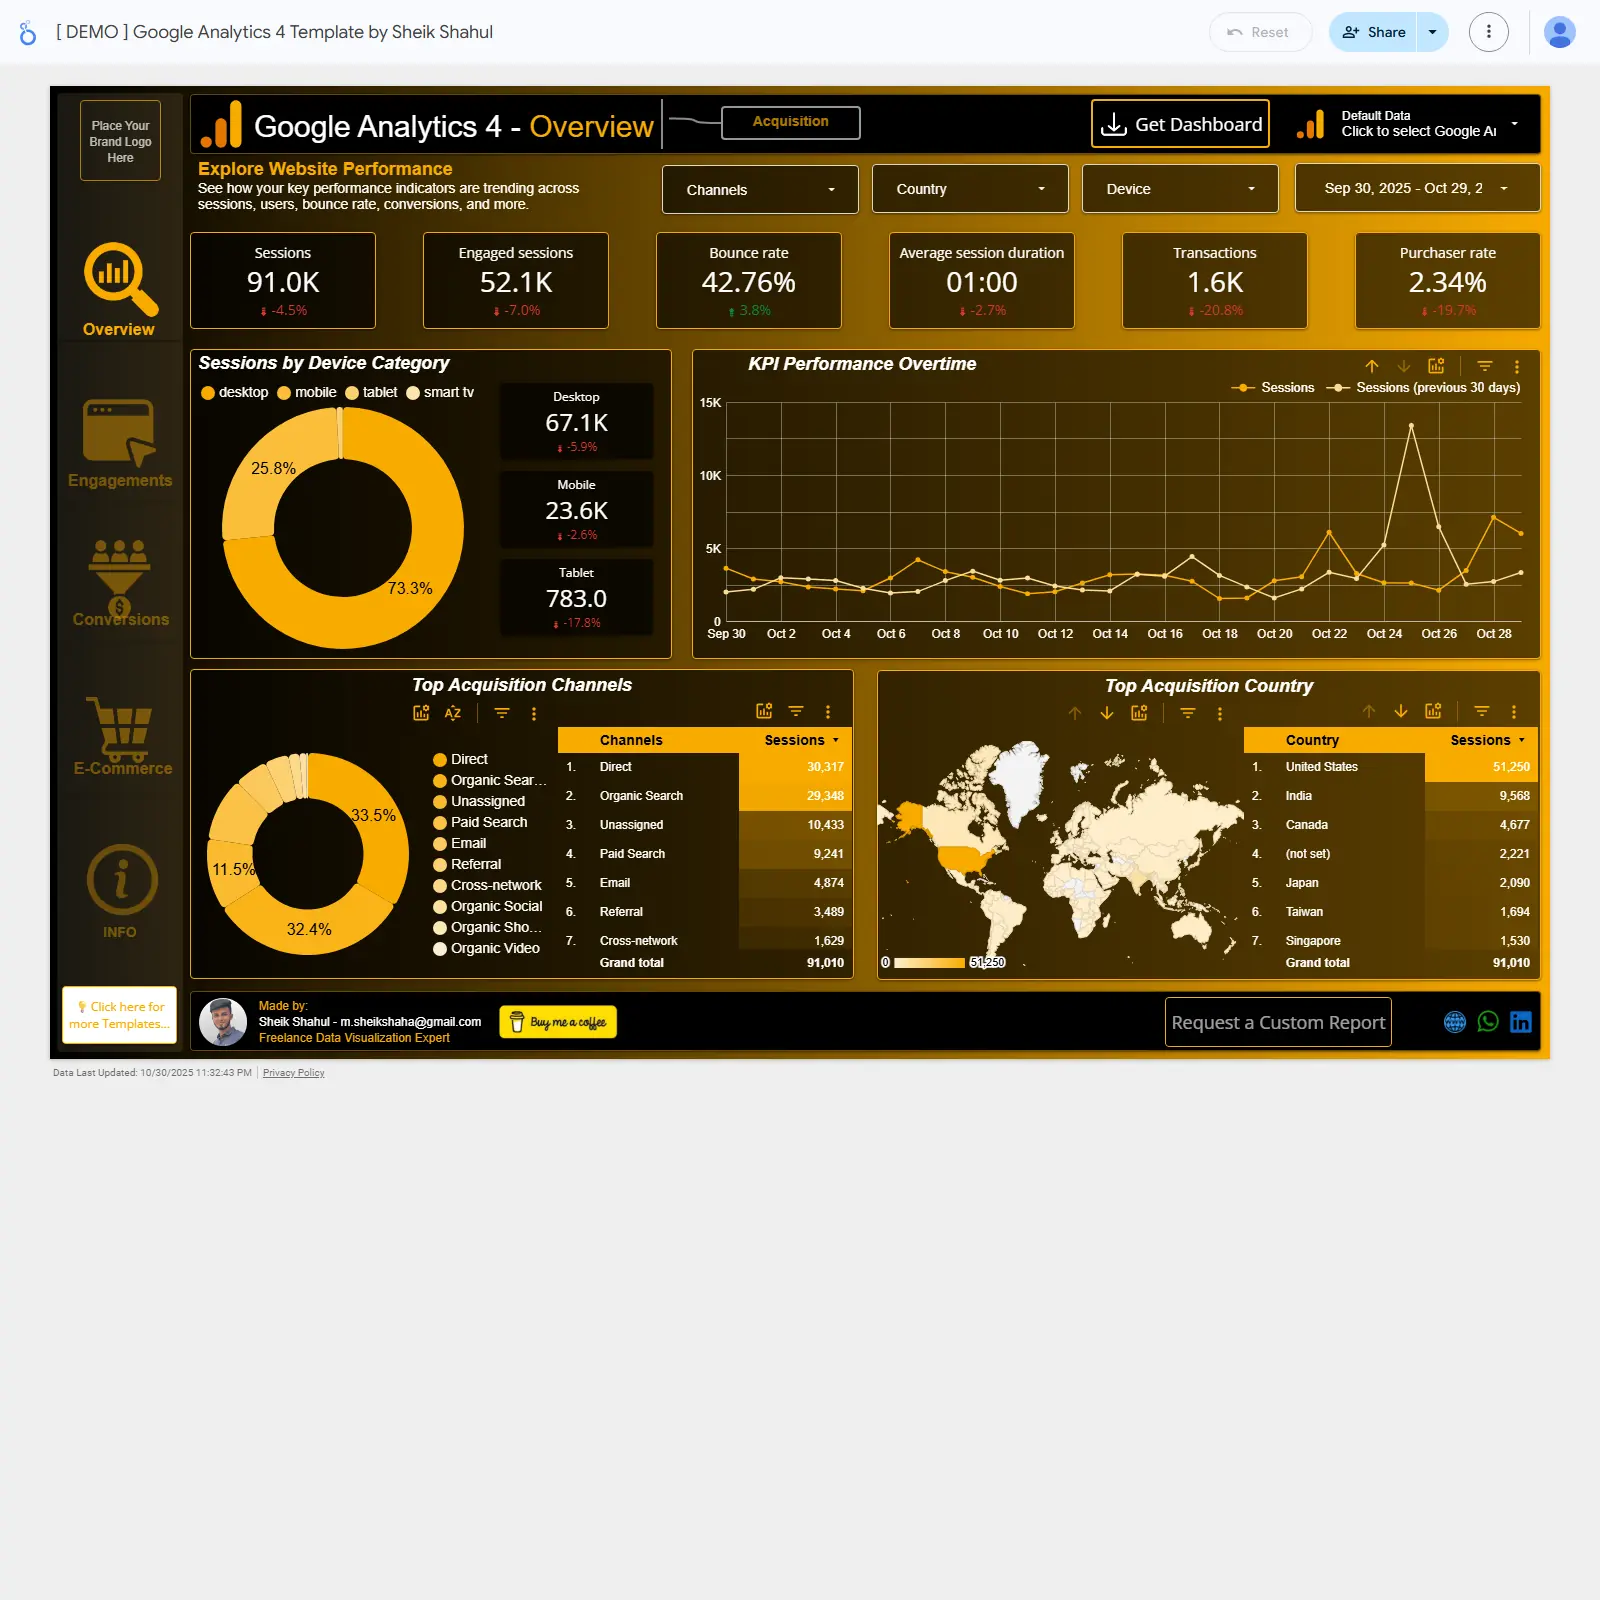
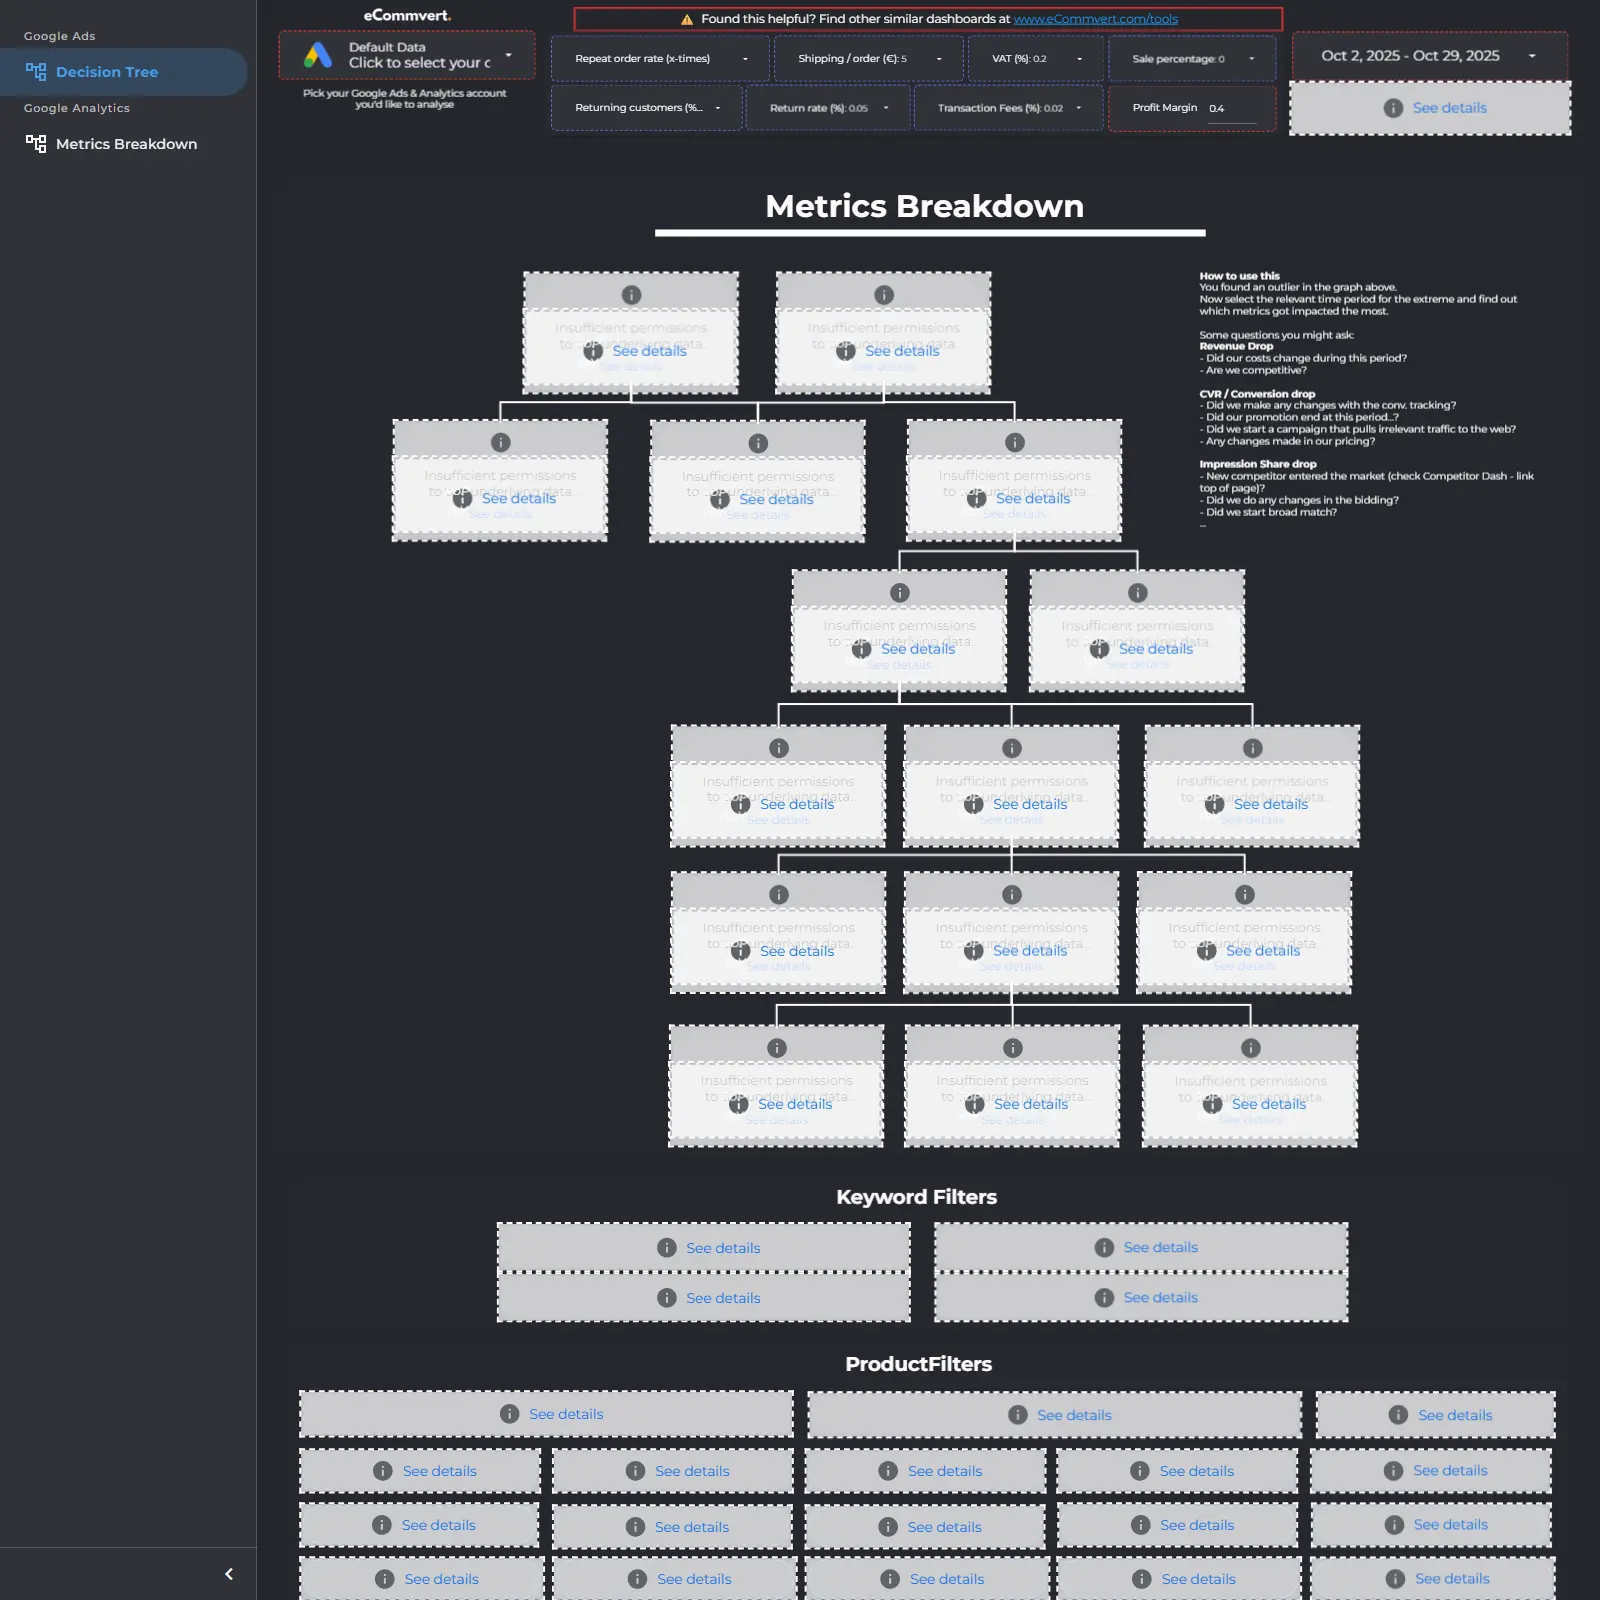
Multi-channel PPC dashboard for Looker Studio to monitor CTR, CPC, ROAS, and conversions across Google, Meta, LinkedIn, TikTok, and Twitter with GA4 insights.

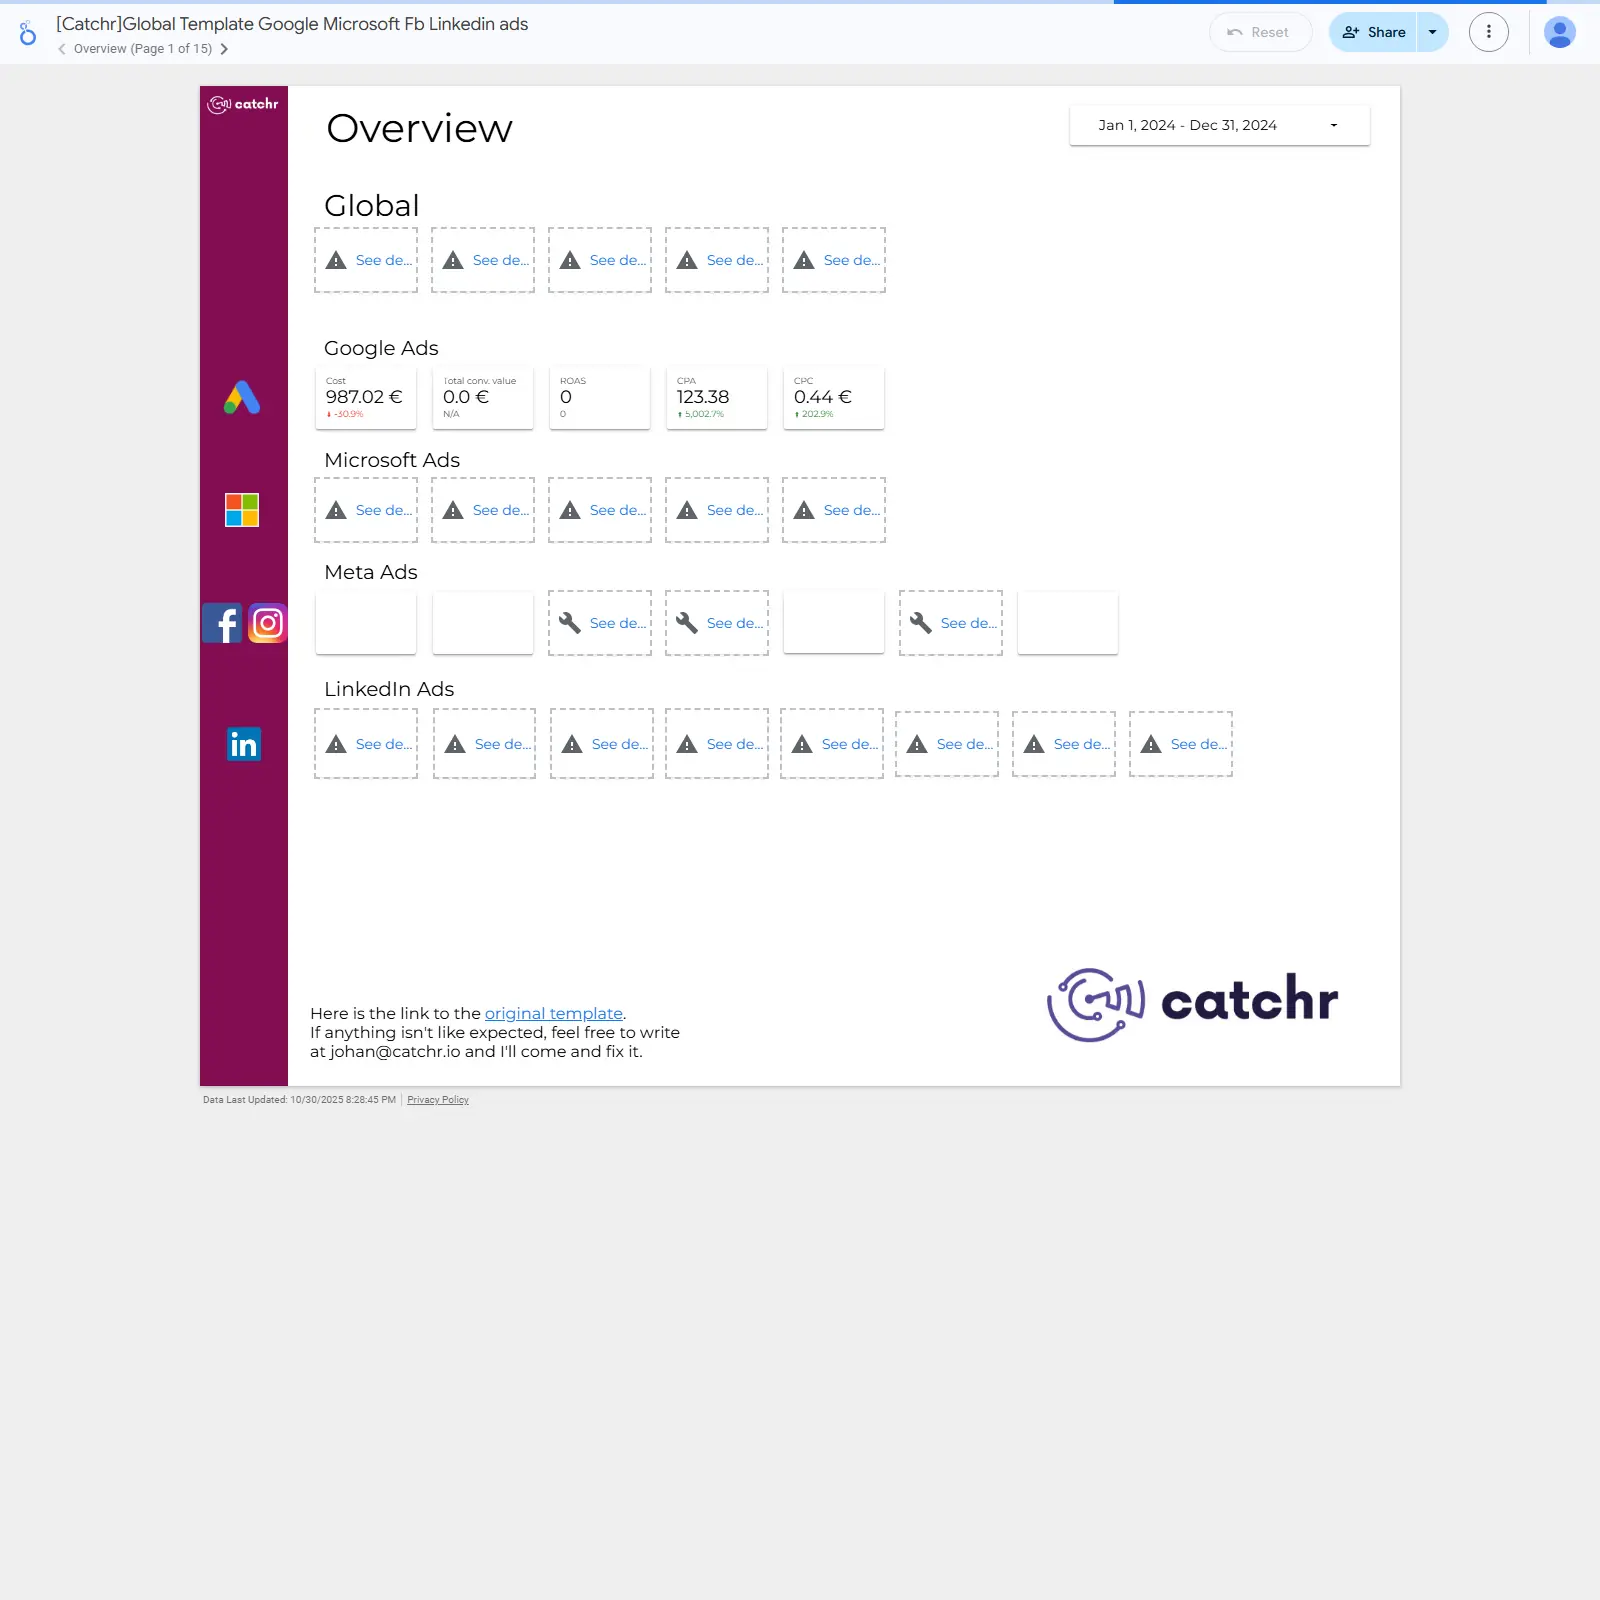
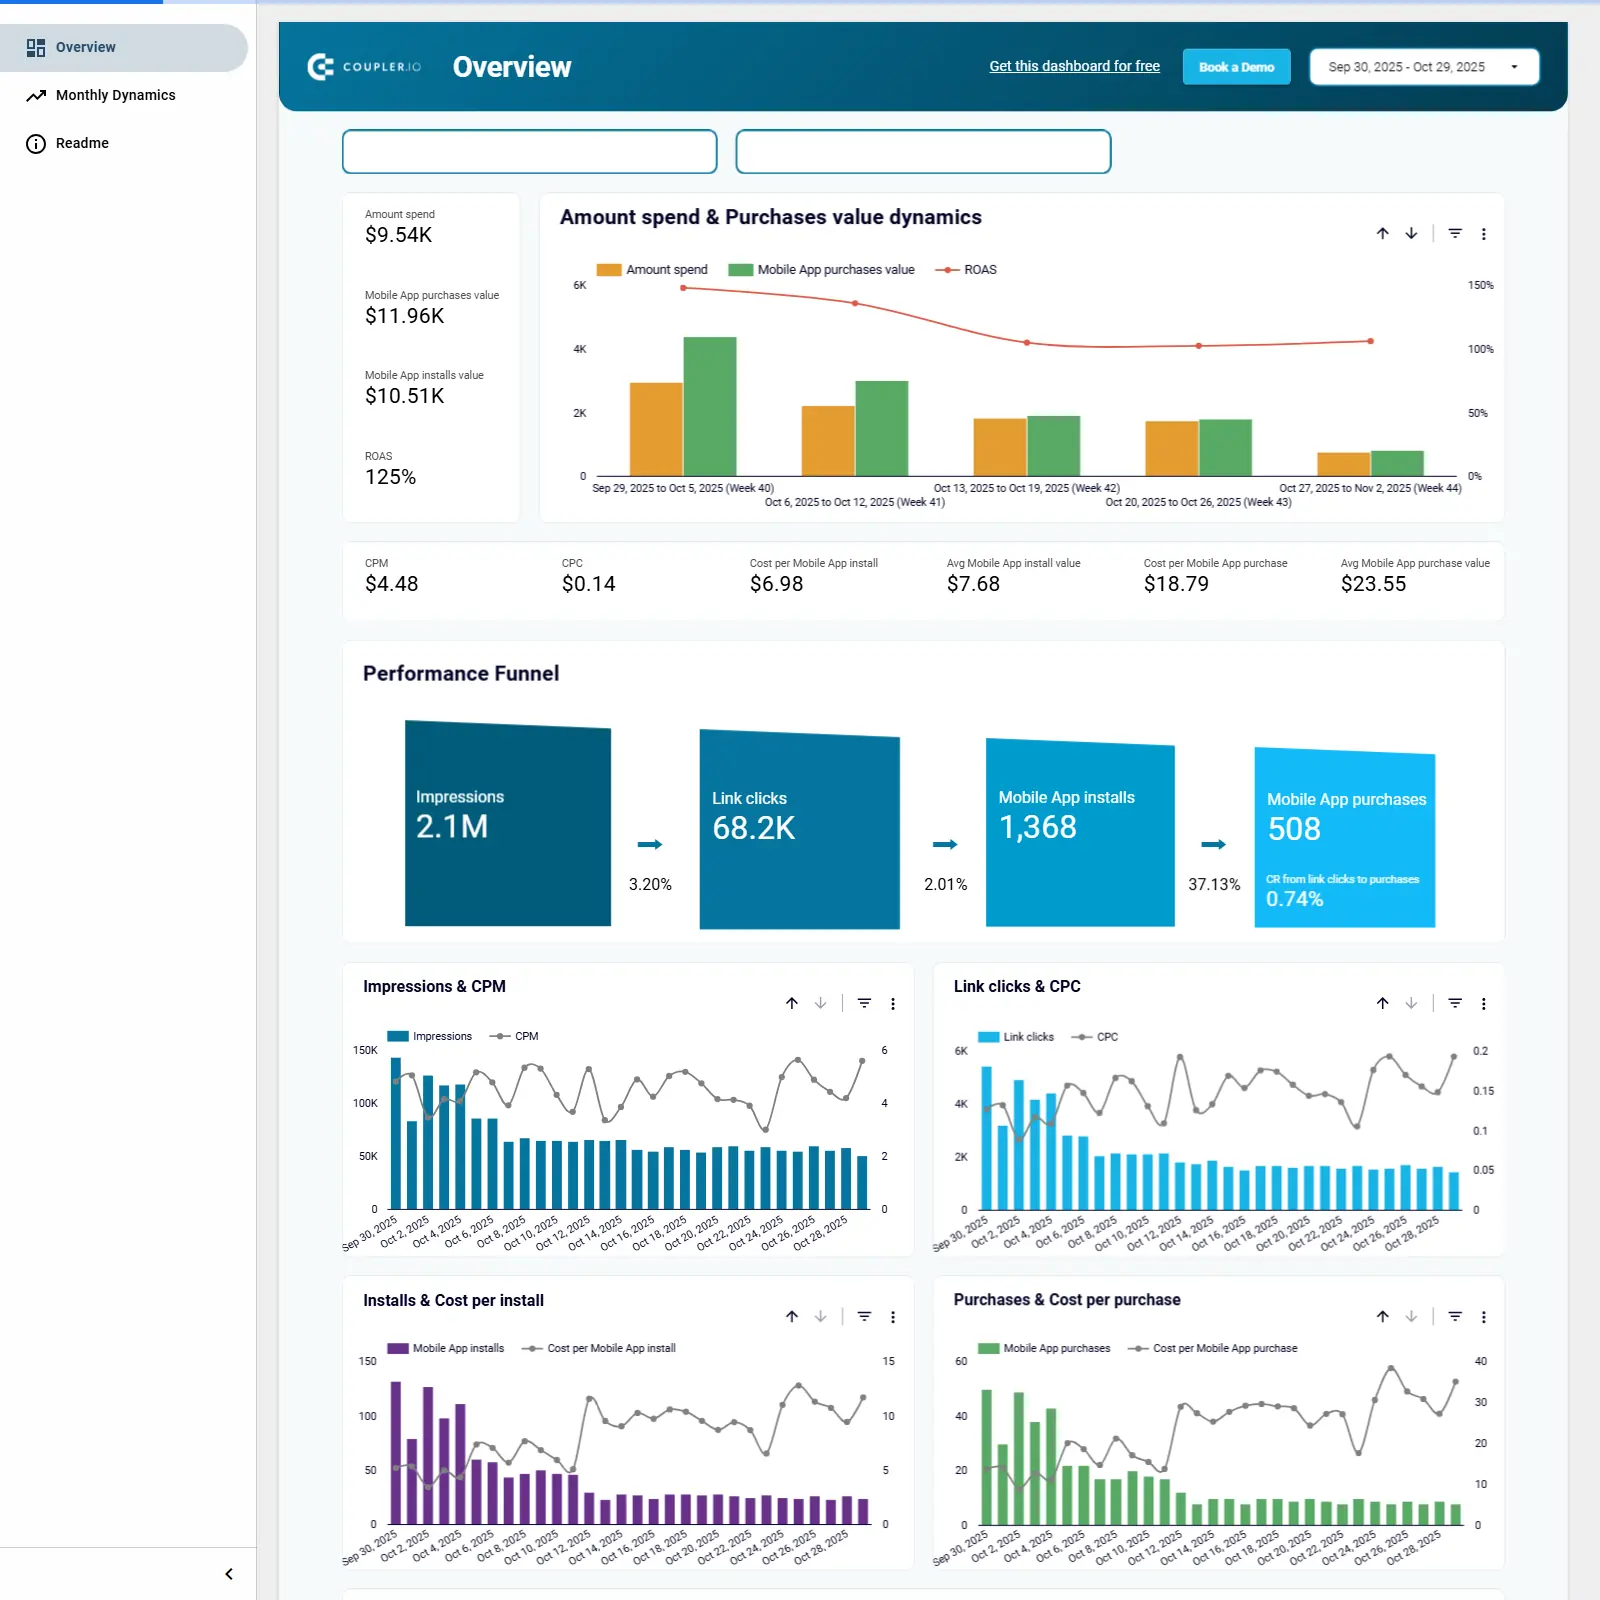
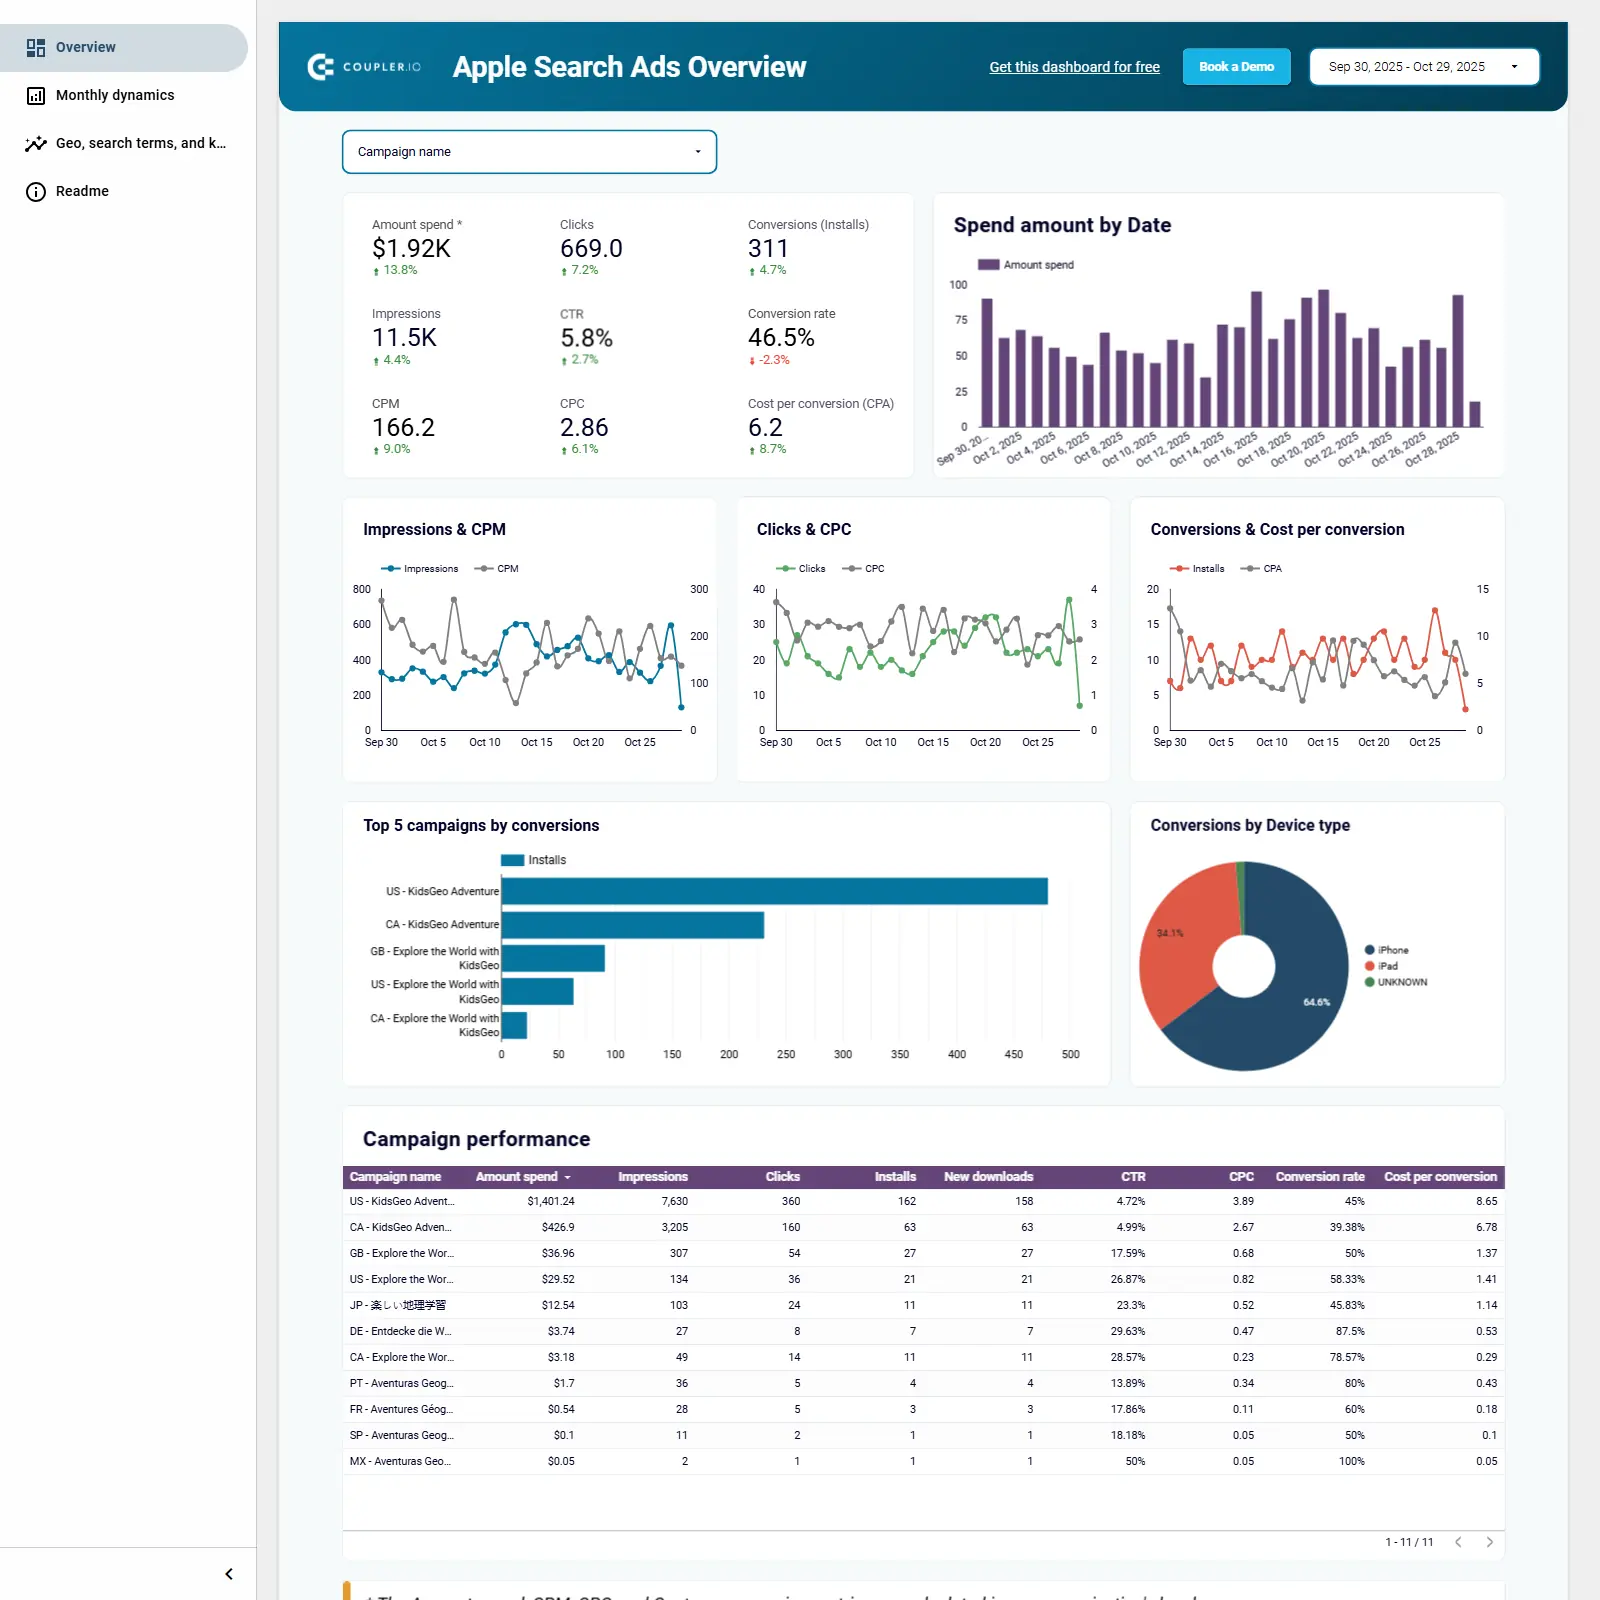
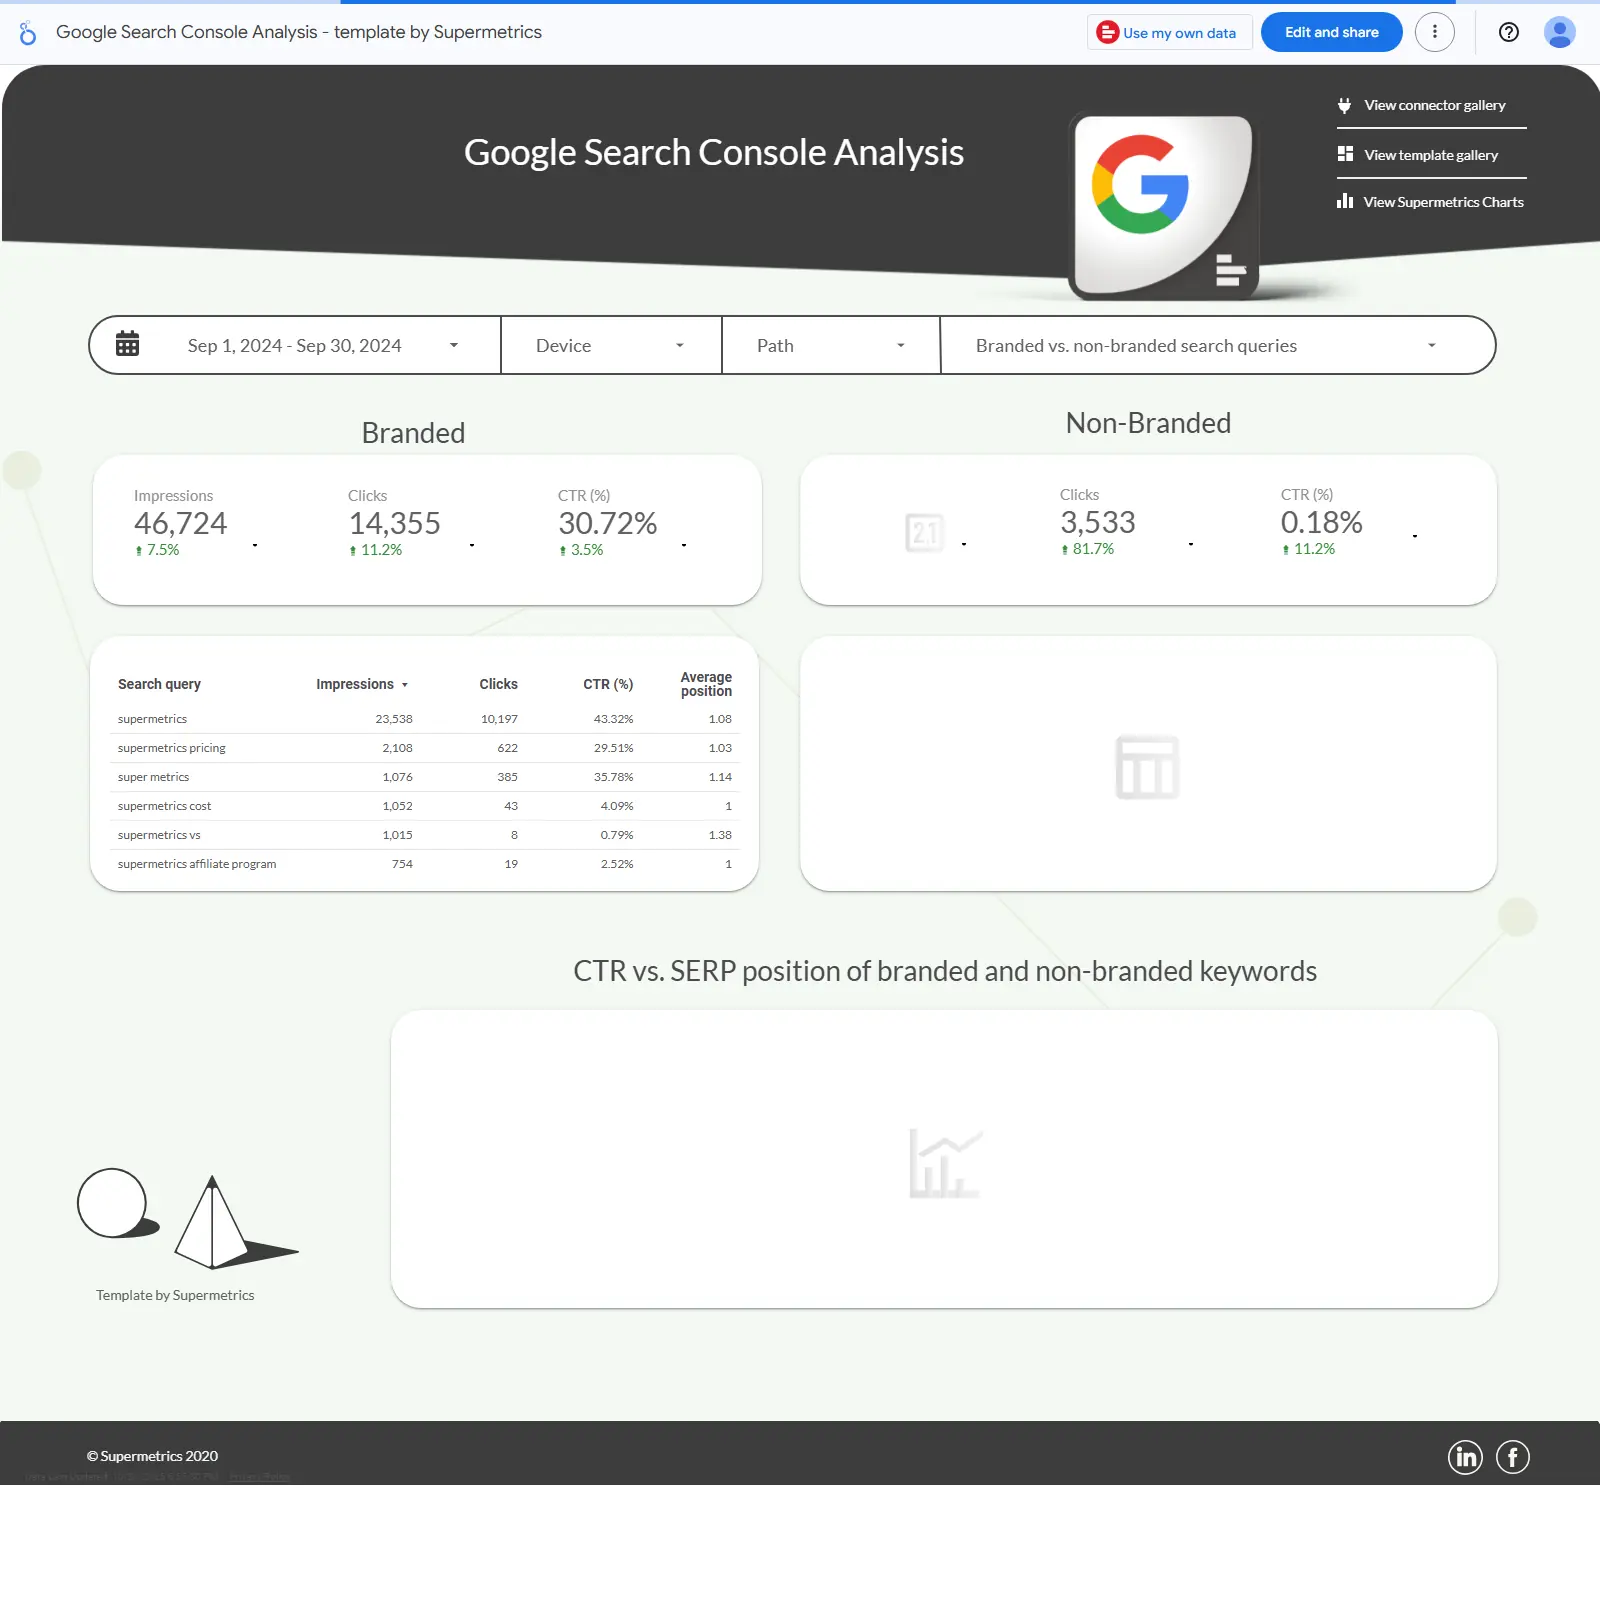
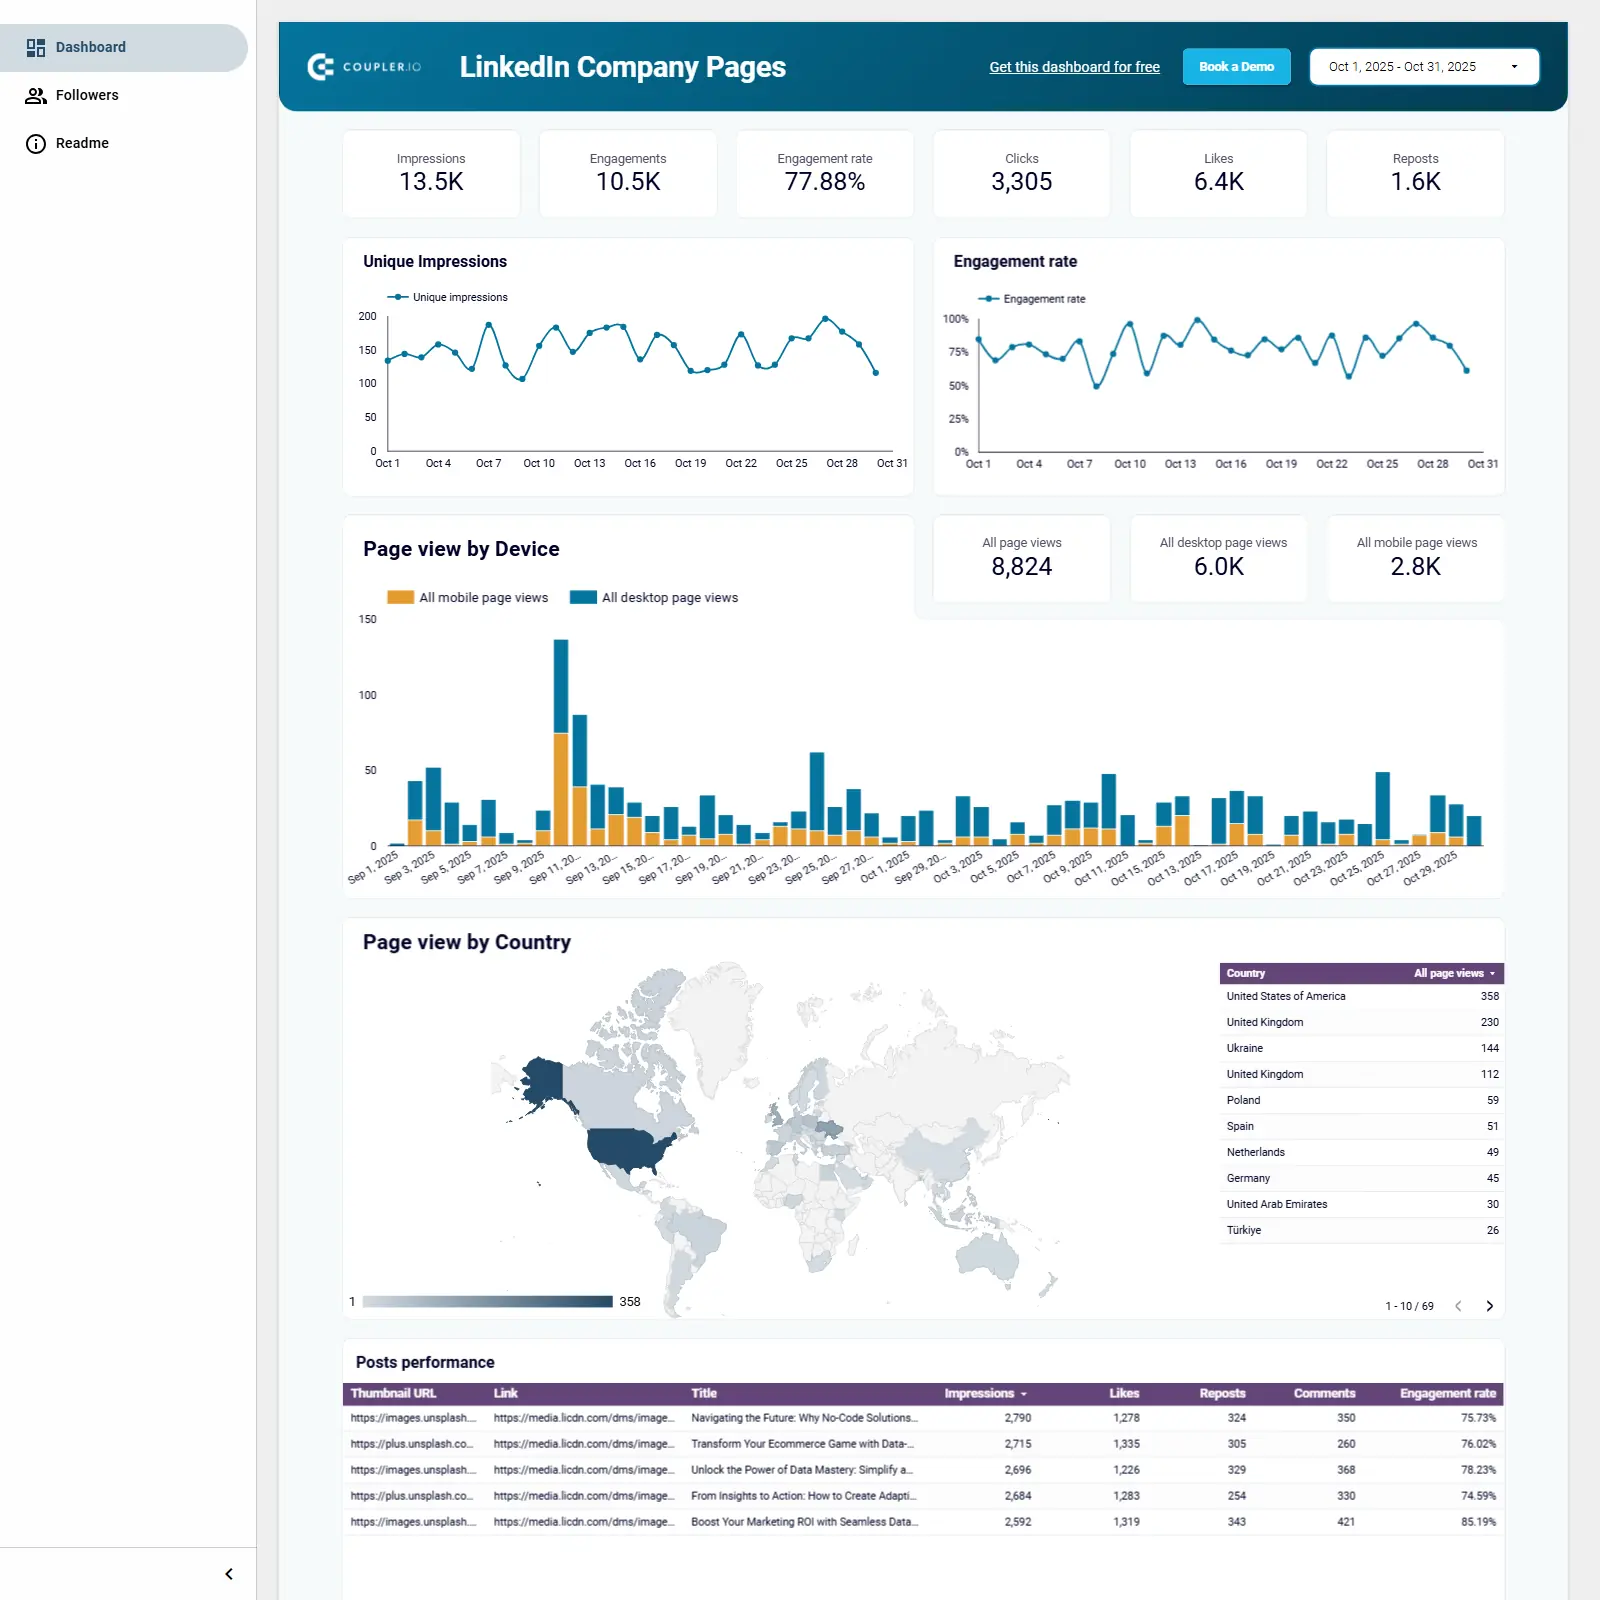
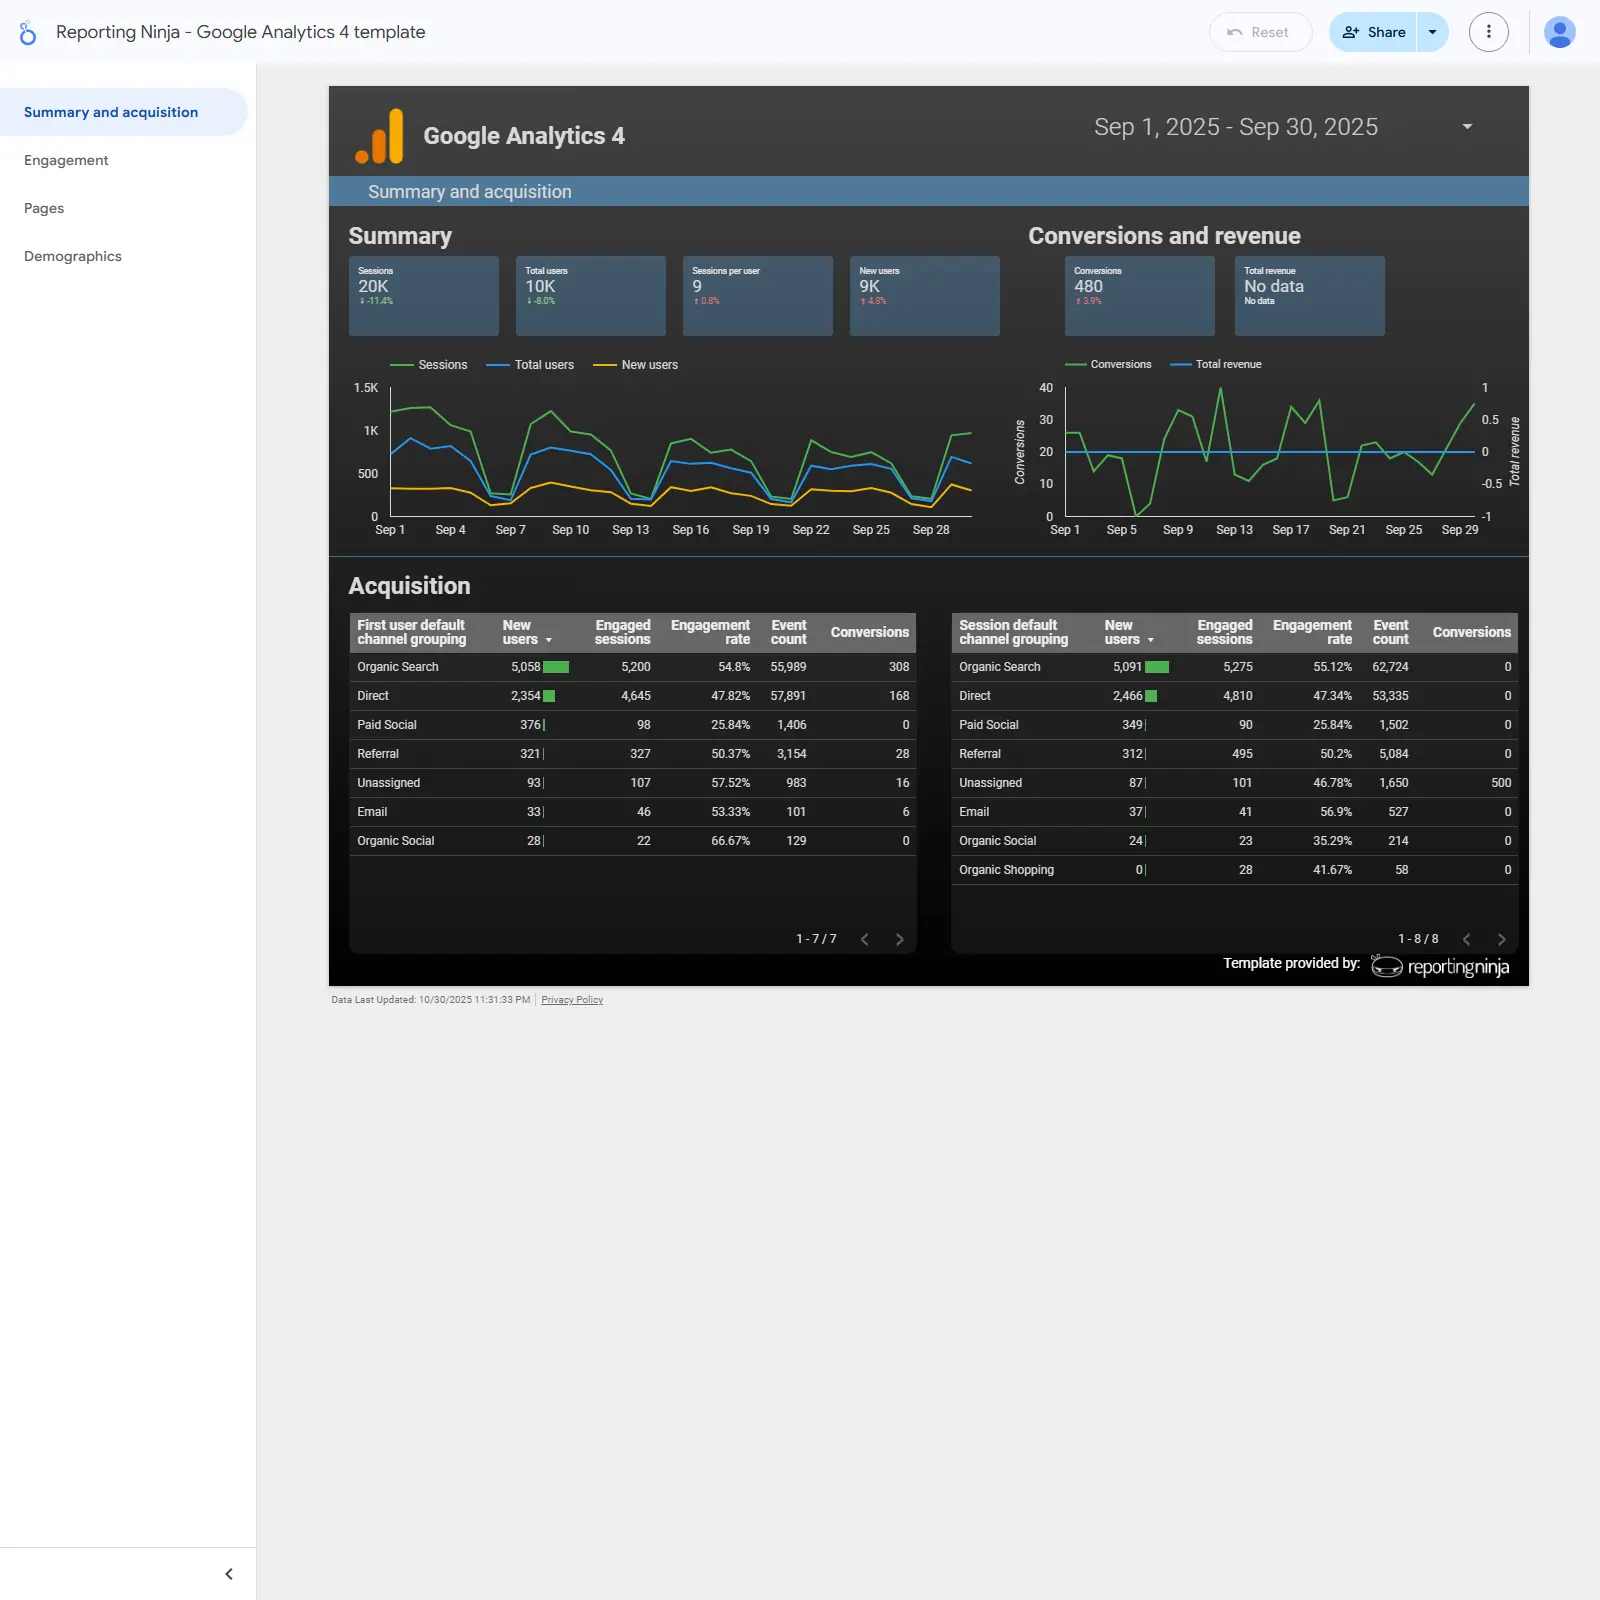
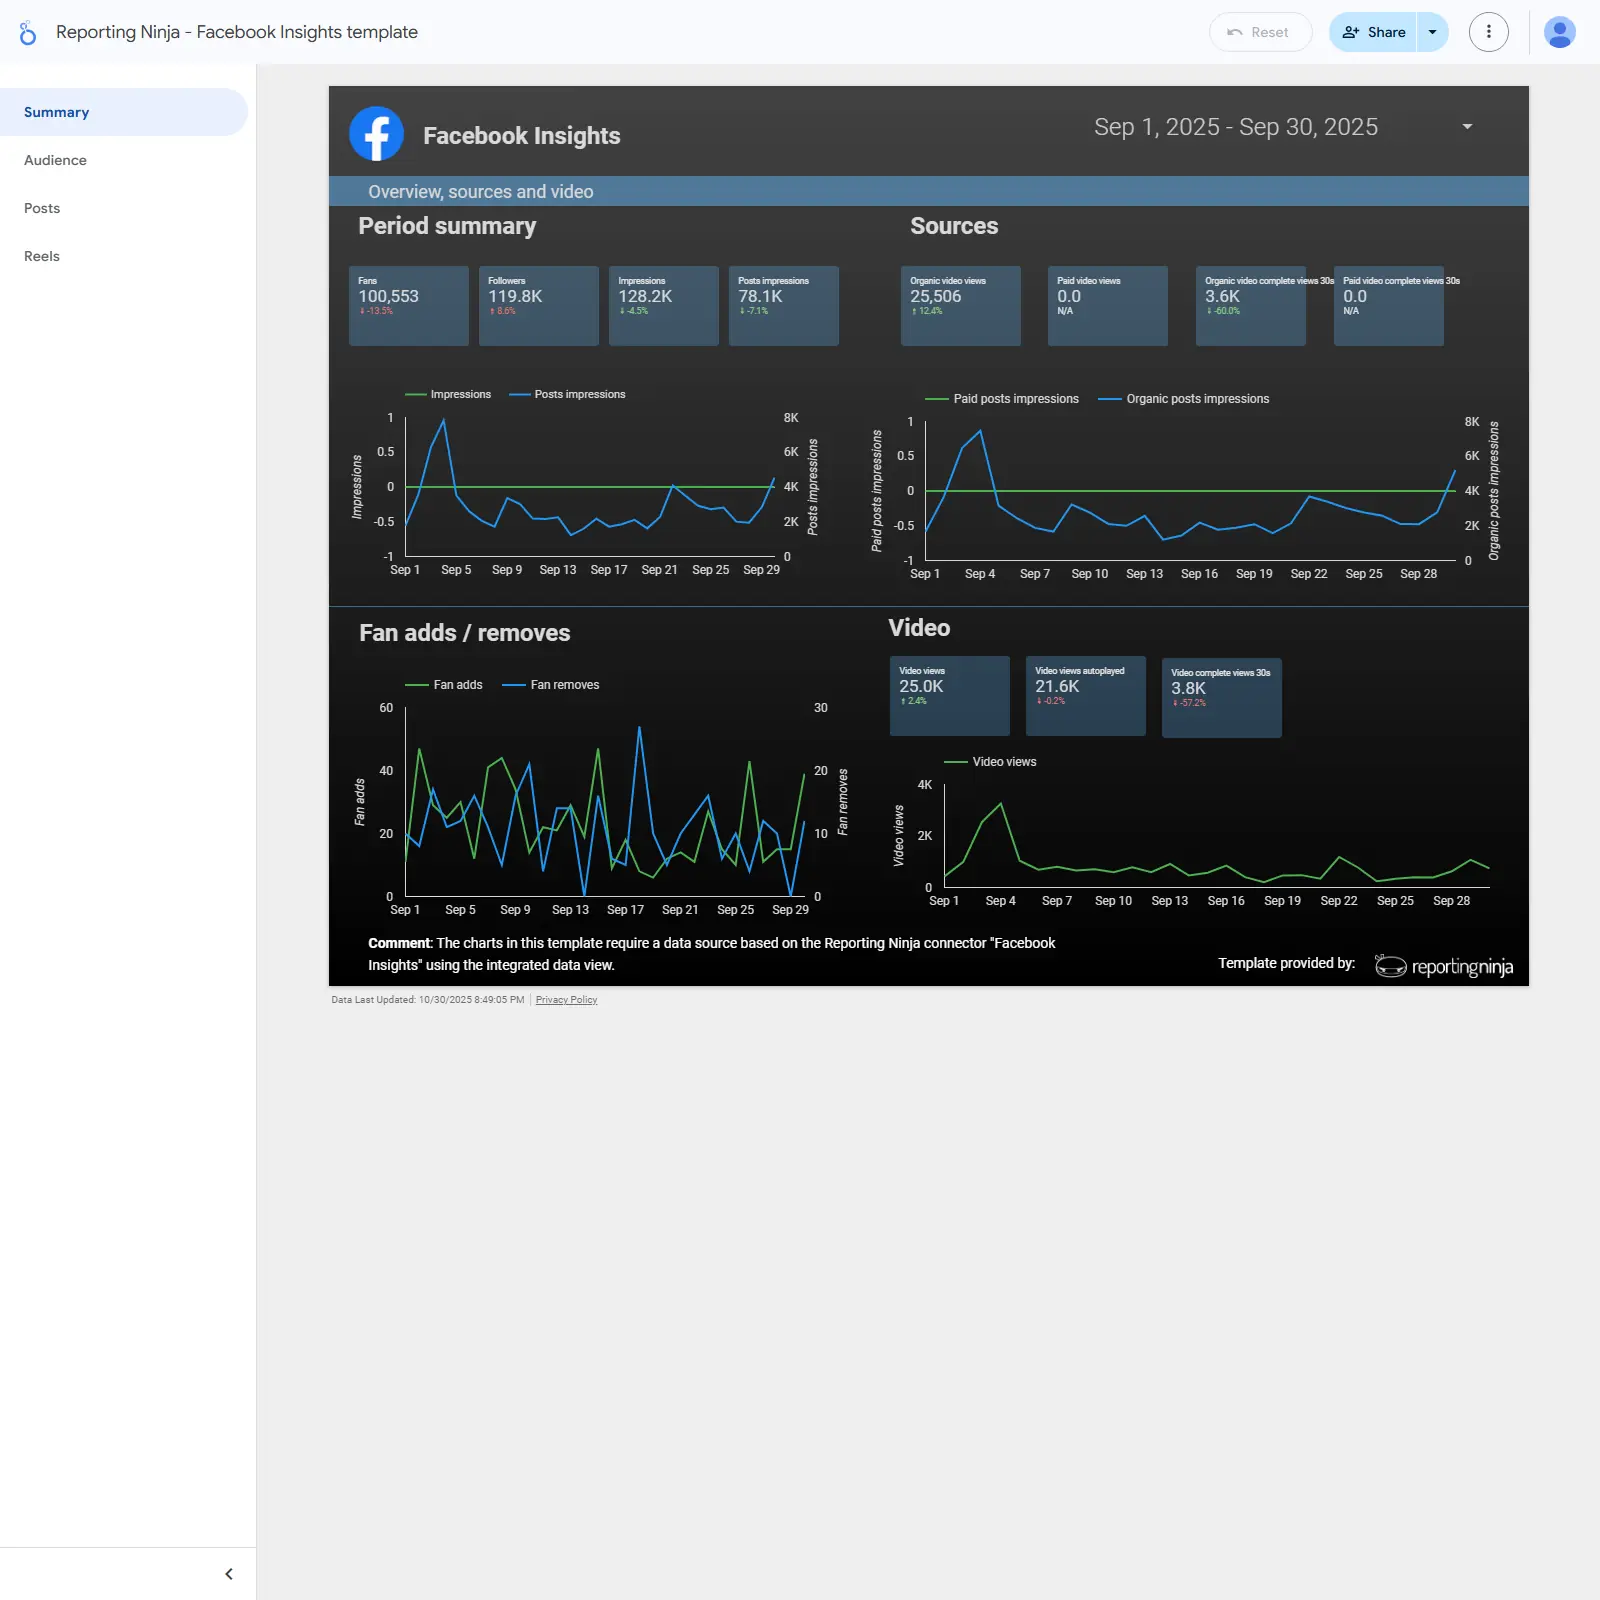
Multi-channel paid media template for Looker Studio that unifies PPC performance across Google Ads, Facebook/Instagram, LinkedIn, TikTok, and Twitter. Tracks CTR, CPC, conversions, conversion rate, ROAS, spend, impressions, and engagement to surface winning channels, campaigns, and audiences. Adds GA4 website metrics like sessions, views, and bounce rate for full‑funnel insight from ad spend to on‑site outcomes. Includes white‑label styling, historical data, data blending, and scheduled email summaries for clients and stakeholders.
Free
Facebook Ads performance for mobile apps dashboard cover image
Facebook Ads performance for mobile apps dashboard

Mobile app UA dashboard tracking spend, ROAS, CPM/CPC/CPI, and funnel from impressions to purchases with weekly trends.

Looker Studio template for tracking mobile app user acquisition across paid campaigns, from impression to purchase. Highlights spend vs. purchase value with ROAS, plus CPM, CPC, CPI, average install value, and average purchase value. A funnel summarizes conversion at each stage (impressions, link clicks, installs, purchases) while weekly trend charts reveal changes in costs and volume. Ideal for spotting bottlenecks, optimizing budgets and creatives, and quantifying revenue impact of marketing efforts.
Free
Apple Search Ads Overall Performance cover image
Apple Search Ads Overall Performance

Apple Search Ads performance tracking for spend, taps, installs, CPT/CPA/CPM, LAT impact, and campaign/ad group rollups over time.

Apple Search Ads analytics in Looker Studio focused on campaign, ad group, and ad performance. Track spend, impressions, taps, TTR, installs, new downloads vs re‑downloads, and costs such as CPT, CPA, and CPM with time‑series comparisons to previous periods. Understand attribution gaps with Limited Ad Tracking (LAT) insights on installs and off‑installs. Use performance tables with budgets, statuses, and results to pinpoint winners, reduce waste, and guide bid and budget moves.
Free
Apple Search Ads dashboard cover image
Apple Search Ads dashboard

Apple Search Ads dashboard template to analyze campaigns, keywords, and device performance and optimize installs and spend.

Apple Search Ads analytics template for Looker Studio that brings all campaign data into one view to guide smarter app growth decisions. Track spend, impressions, clicks, installs, CTR, CPC, CPA, conversion rate, and new downloads with device split for iPhone vs. iPad. Compare campaigns and keywords, identify top converters, and analyze actual search terms to refine targeting. Review daily and month‑over‑month trends to spot seasonality, budget efficiency, and performance shifts. Turn insights into actions by reallocating spend, adjusting bids, and improving creatives to drive more quality installs.
Free
Google Search Console reporting template cover image
Google Search Console reporting template

Branded vs non‑branded SEO performance from Google Search Console with impressions, clicks, CTR, and ranking insights.

Google Search Console analysis focused on branded vs non‑branded search performance. Highlights impressions, clicks, CTR, and average position, with a keyword table to surface top queries. Visualizes CTR against SERP position to spot opportunities to improve rankings and click‑through rates. Helps compare brand demand to generic SEO traffic and prioritize high‑impact keywords across devices and site paths.
Free
Google Search Console Looker Studio Template cover image
Google Search Console Looker Studio Template

Google Search Console SEO tracker with keyword, device, country, and page‑ranking insights.

Optimize organic search performance by turning Google Search Console data into clear, actionable insights. Track impressions, clicks, CTR, and average position to spot trends and growth opportunities. Compare branded vs generic terms, evaluate short‑tail vs long‑tail keywords, and see which countries, devices, and pages drive results. Surface low‑ranking pages, monitor ranking changes, and quantify first‑page visibility to prioritize SEO fixes and content updates.
£149
Pinterest Organic report template for Looker Studio cover image
Pinterest Organic report template for Looker Studio

A Pinterest analytics template that highlights profile, pin, and video performance, traffic sources, and top pins to grow engagement and clicks.

Pinterest Organic Looker Studio template tracks how your content performs across impressions, engagements, saves, pin clicks, and outbound clicks. Surface follower growth, active boards and pins, and pinpoint top-performing pins and formats (standard, product, video, story). Analyze video performance with views, starts, average play duration, and 95% completion to understand what holds attention. Break down traffic sources and devices to see where visibility and clicks come from. Turn trend insights into actions to refine creative, boost engagement, and drive more site traffic.
Free
LinkedIn company page performance dashboard cover image
LinkedIn company page performance dashboard

LinkedIn Company Pages analytics for tracking engagement, audience sources, and post performance.

LinkedIn Company Pages analytics focused on content and audience performance. Track impressions, engagements, engagement rate, clicks, likes, and reposts with clear trend lines. See where traffic comes from with page views split by device and a country map. Surface top and underperforming posts with a detailed table showing impressions, likes, reposts, comments, and engagement rate. Built for marketers and social teams to spot growth drivers and refine posting strategy.
Free
Google Analytics 4 Template cover image
Google Analytics 4 Template

GA4 template to track acquisition, engagement, conversions, and e‑commerce with clear KPIs, channel and country insights.

Google Analytics 4 template focused on website performance and acquisition. Key KPIs include sessions, engaged sessions, bounce rate, average session duration, transactions, and purchase rate with period comparisons. Visuals highlight device mix, top acquisition channels, and top countries, plus a time-series of KPI trends. Dedicated sections cover Overview, Engagement, Conversions, and E‑commerce for a full funnel view from traffic to revenue.
Free
Google Analytics 4 report template for Looker Studio cover image
Google Analytics 4 report template for Looker Studio

GA4 Looker Studio template to analyze traffic, engagement, conversions, and audience insights for smarter marketing and content decisions.

Google Analytics 4 Looker Studio template for tracking website performance across traffic, engagement, conversions, and revenue. Compare acquisition channels like organic, direct, paid, and referral to see which sources drive new users and results. Surface user behavior with page-level views, events, session quality, and trends over time. Explore demographics by country, city, gender, and interests to refine targeting and content. Turn GA4 data into actionable insights to grow traffic and improve conversion rates.
Free
Metrics Breakdown Tree cover image
Metrics Breakdown Tree

Ecommerce decision‑tree template that surfaces profit drivers from Google Ads and Google Analytics with a clear metrics breakdown.

Ecommerce analytics template that turns Google Ads and Google Analytics data into a decision tree to pinpoint the biggest levers for growth and profitability. Highlights metrics such as repeat order rate, return rate, shipping per order, transaction fees, sale percentage, and profit margin to prioritize fixes and quick wins. Includes a detailed metrics breakdown plus keyword and product filters to compare performance across campaigns and SKUs. Built to reveal where money is made or lost across the funnel and guide next steps.
Free
Facebook Organic report template for Looker Studio cover image
Facebook Organic report template for Looker Studio

All‑in‑one Facebook Insights template to track growth, engagement, content performance, and Reels/video impact—split by organic vs paid.

Facebook marketing analytics focused on growth, reach, impressions, engagement, and video performance. Compare organic vs paid results, track fan adds/removes, and surface top posts and Reels by likes, comments, shares, and interactions. Understand audience locations and languages to tailor content and pinpoint the best days and times to post. Monitor video views, 30‑second completions, and completion rate to refine creative and improve retention.
Free
YouTube report template for Looker Studio cover image
YouTube report template for Looker Studio

Looker Studio template to analyze YouTube views, watch time, engagement, subscribers, traffic sources, audience, retention, and playlists.

YouTube performance dashboard for Looker Studio focused on channel growth and engagement. Track views, watch time, average view duration, subscriber gains/losses, likes, comments, shares, and top videos with retention. See where viewers come from (search, suggested, external) and which sources drive the most watch time. Understand audience demographics and geography, playback locations and devices, and how playlists contribute to overall engagement. Use the insights to refine content, improve retention, and expand reach.
Free
YouTube Channel Report cover image
YouTube Channel Report

YouTube Analytics dashboard for tracking channel trends, top videos, engagement, and geographic reach.

YouTube channel analytics focused on what matters: views, average watch time, and shares trended over time. Pinpoint top-performing videos with side‑by‑side metrics for views and engagement. Track audience sentiment with likes, dislikes, subscriptions added/removed, and comments. See where viewers come from with country and U.S. state maps. Designed for creators and marketers who want quick, actionable insight into channel performance.
Free
Report X Organic Twitter top menu Metricool cover image
Report X Organic Twitter top menu Metricool

Twitter (X) organic analytics template powered by Metricool, focused on growth, engagement, and top posts.

Purpose-built Looker Studio template for analyzing organic Twitter (X) performance via the Metricool connector. Tracks growth, engagement, impressions, and content outcomes with month-over-month and year-over-year comparisons. Three pages—Summary, Community, and Post—cover follower evolution (daily and last 12 months), follows/unfollows, best days to grow, and overall account performance. Post analytics include daily engagement, impressions, interactions, mentions, and a full post table plus top 5 posts by reach and engagement. Ideal for agencies and social media managers who need client-ready visuals and fast insights into what drives follower growth and engagement.
$40.47
TikTok Organic report template for Looker Studio cover image
TikTok Organic report template for Looker Studio

Track TikTok Organic performance, identify top videos, and analyze audience demographics to refine your content strategy.

TikTok Organic performance tracking focused on views, likes, shares, comments, follower growth, and profile views. Surfaces top-performing videos with engagement, full‑watch rates, and trend lines to spot what’s working over time. Breaks down audience by gender and country to guide targeting and content planning. Highlights correlations between views and interactions to refine posting cadence and creative. Designed to optimize content strategy, boost visibility, and improve retention with clear, comparative insights.
Free
Organic TikTok 4 pages Metricool cover image
Organic TikTok 4 pages Metricool

Four-page TikTok organic analytics template covering growth trends, daily activity, detailed video performance, and audience demographics via Metricool data.

TikTok organic analytics focused on growth, engagement, and reach, with clear month‑over‑month and year‑over‑year comparisons. Uncover 12‑month trends and daily patterns for followers, views, profile views, and interactions to spot what drives spikes. Deep‑dive into video performance with views, reach, engagement, likes, comments, shares, impression sources, average watch time, and a sortable table of your top videos. Evaluate account output and efficiency across published videos and key engagement ratios. Guide content and market decisions with follower demographics by gender and country.
$57.96
Snapchat Ads report template for Looker Studio cover image
Snapchat Ads report template for Looker Studio

Comprehensive Snapchat Ads analytics in Looker Studio to track costs, conversions, ROAS, and audience performance.

Snapchat Ads performance template for Looker Studio focused on campaign, ad group, and creative analysis. Track impressions, clicks, CTR, CPC, eCPM, conversions, CPA, ROAS, and spend to evaluate efficiency and ROI. Compare results by ad format and placement, and identify winning segments by country, device (iOS vs Android), age, and gender. Turn trends and breakdowns into clear actions to optimize budgets, boost engagement, and scale profitable campaigns.
Free
Snapchat Ads dashboard cover image
Snapchat Ads dashboard

Snapchat Ads analytics with KPIs, trends, and campaign comparisons to optimize spend and conversions.

Snapchat Ads performance dashboard focused on spend, reach, impressions, views, swipe ups, purchases, and cost efficiency metrics like eCPM, eCPV, and eCPSU. Visualizes daily trends and spend dynamics to catch rising costs or underperforming periods. Highlights top campaigns by swipe ups and provides a detailed campaign table for fast comparisons of status, costs, rates, and outcomes. Helps optimize budgets and creative strategy to drive more conversions at lower costs.
Free
Display Video 360 Account Summary V2 0 cover image
Display Video 360 Account Summary V2 0

DV360 Looker Studio template summarizing campaign-to-line item performance with device, environment, exchange, creative, and inventory QA views.

DV360 Account Summary for Looker Studio focused on Display & Video 360 performance across advertisers, campaigns, insertion orders, and line items. View revenue and CPM with breakdowns by device, environment, and exchange to spot where spend and results concentrate. Tabs extend into DV360 hierarchy, creative performance, and URL/exchange analysis, with an additional QA section for inventory and DMP checks. Filters for advertiser, campaign, device, line item status, exchange, and creative type keep analysis targeted. Built for media buyers and analysts who need a quick, consistent read on core DV360 KPIs.
Free
Pinterest Ads report template for Looker Studio cover image
Pinterest Ads report template for Looker Studio

Track Pinterest Ads ROI with CTR, conversions, CPA/ROAS, and spend across campaigns, ad groups, and ads.

Pinterest Ads performance template for Looker Studio that tracks impressions, pin clicks, CTR, engagements, conversions, CPA, ROAS, CPC, CPM, and spend. Compare campaigns, ad groups, and creatives to spot winners and fix underperformers. Visualize conversions vs. spend and total order value to guide budget and bidding decisions. Evaluate cost efficiency and ad formats (video, carousel, standard) to improve targeting and creative strategy. Powered by the Pinterest Ads connector from Reporting Ninja.
Free
Microsoft Advertising report template for Looker Studio cover image
Microsoft Advertising report template for Looker Studio

Analyze Microsoft Advertising performance by campaign, keyword, audience, device, location, and time to boost ROAS.

Microsoft Advertising (Bing Ads) template for Looker Studio that tracks impressions, clicks, CTR, conversions, CPC/CPA, spend, and ROAS across campaigns, ads, and keywords. Compare performance by network, match type, device, location, and demographics to find high-ROI segments. Spot time-of-day and day-of-week trends, monitor cost efficiency, and quickly identify top campaigns and search queries. Ideal for optimizing budgets and improving return from Bing Ads.
Free
Bing Ads Looker Studio Template cover image
Bing Ads Looker Studio Template

Microsoft Ads performance tracking across campaigns, keywords, devices, locations, and networks to boost conversions and ROI.

Analyze Microsoft Ads (formerly Bing Ads) performance across campaigns, keywords, locations, devices, and networks to improve ROI. Track spend, impressions, clicks, average CPC, and conversions over time to pinpoint what drives results. Compare conversion efficiency by device and network, evaluate geolocation performance, and surface high‑performing search keywords. Use clear trend views and breakdowns to identify waste, reallocate budgets, and scale winning campaigns.
€99
Mailchimp Google Looker Studio Template cover image
Mailchimp Google Looker Studio Template

Mailchimp analytics dashboard for Looker Studio to track campaign KPIs, engagement patterns, and subscriber growth for better email performance.

Mailchimp email marketing analytics for Looker Studio focused on campaign performance and audience insights. Track CTR, unsubscribes, bounces, sign-ups, and overall list health to gauge impact. Uncover engagement by time and day, location, device, and email client to refine send timing and content. Highlight top-performing campaigns and monitor subscriber growth to guide strategy. Data connects from Mailchimp via Google Sheets.
£69