Category: Marketing

The best free & paid Looker Studio templates, curated and quality-ranked for data reporting.

Clear All

Showing 161 - 200 of 367

GA4 EVENT AUDIT cover image
GA4 EVENT AUDIT

GA4 event and ecommerce audit dashboard to validate tracking, monitor key metrics, and spotlight issues fast.

GA4 Event Audit by Vision Labs helps audit and monitor your Google Analytics 4 setup, highlighting account creation date, unique events, hostnames, countries, conversion events, custom audiences, and data streams. Visualizes traffic and event trends across sources to quickly spot anomalies and gaps. Includes dedicated sections for Event Audit and Ecommerce to validate tagging, track conversions, and evaluate revenue performance. Offers customization options and a built‑in tutorial for faster onboarding. Ideal for marketers and analysts who need to confirm GA4 data quality and turn insights into fixes.
Free
GA4 Hour of Day Day of Week Dashboard cover image
GA4 Hour of Day Day of Week Dashboard

Analyze GA4 KPIs by hour, day, and weekend vs. weekday to uncover actionable timing patterns across users, conversions, and revenue.

GA4 time analysis template that compares users, sessions, conversions, transactions, and revenue by hour of day, day of week, and week type (weekday vs. weekend). Uncovers when performance spikes or drops so you can time campaigns, content, and offers more effectively. Drill into segments like region, marketing channel, and technology to understand patterns by audience and source. Ideal for spotting trends and prioritizing actions without building reports from scratch.
Free
Google Analytics 4 GA4 Looker Studio Data Visualization Charts cover image
Google Analytics 4 GA4 Looker Studio Data Visualization Charts

GA4 chart pack for Looker Studio covering core, advanced, content, e-commerce, geo, and goal visuals for clearer, faster insights.

A curated pack of GA4 visualization charts for Looker Studio that helps teams turn analytics into clear, persuasive stories. Includes foundational charts for sessions, revenue, devices, and channels, plus enhanced views for user journeys, campaigns, and engagement. Adds focused sections for content performance, e-commerce trends and product insights, geographic breakdowns, and progress vs. goals. Designed to surface key trends fast, backed by a friendly user guide and accessibility support. Ideal for marketers, analysts, and leaders who want sharper GA4 reporting without starting from scratch.
$79
Facebook Ads Funnel report template cover image
Facebook Ads Funnel report template

Analyze the Facebook Ads funnel with CTR, CPA, ROAS, and conversion insights by audience, placement, device, and time.

Track the full Facebook and Instagram ads funnel in Looker Studio, from impressions to conversions. See CTR, conversion rate, CPA, ROAS, spend, and impressions by campaign, ad set, placement, device, demographic, and time of day to pinpoint what drives performance. Compare acquisition costs and returns across segments to guide budget and creative decisions. Share insights with stakeholders via link, PDF, or email to align on actions and scale winning ads.
Free
Facebook Ads Report Template cover image
Facebook Ads Report Template

Facebook Ads analytics template for Looker Studio focused on ROAS, performance trends, and campaign, ad set, and demographic breakdowns.

Facebook Ads performance template for Looker Studio that consolidates campaign metrics and ROI in one view. Track spend, clicks, impressions, conversions, CTR, and ROAS over time with an at‑a‑glance ROAS gauge and trend charts. Compare campaigns, ad sets, and ads to identify top contributors, analyze cost versus performance, and break results down by country, age, and gender. Review monthly or yearly spend and conversion trends to guide budget allocation and creative strategy.
£149
Youtube Insights - Video Performance and Insights cover image
Youtube Insights - Video Performance and Insights

YouTube video performance and subscriber impact in one Looker Studio view, covering engagement, watch time, and key video metadata.

Analyze individual YouTube videos end to end in Looker Studio—views, likes, comments, shares, watch time, average view rate, and subscribers gained or lost. Get channel-level KPIs (subscribers, videos, total views) alongside a ranked table with video thumbnails for quick comparison. Review upload and privacy status, embeddability, video length, and audience watch rate to manage your content pipeline. Spot breakout clips, diagnose retention drops, and prioritize what to publish next based on what drives subscribers. Built for creators, agencies, and brands that need clear, actionable video insights.
Free
Free Snapchat Ads Dashboard Template on Looker Studio cover image
Free Snapchat Ads Dashboard Template on Looker Studio

Snapchat Ads analytics in Looker Studio with funnel, demographics, and campaign performance insights to optimize spend and conversions.

A focused Snapchat Ads analytics template for Looker Studio that brings campaign performance, spend, swipes, reach, and purchases into one view. Visualizes the full conversion funnel—add to cart, start checkout, and purchases—so you can spot drop-offs and improve conversion rates. Highlights audience demographics alongside video views and screen time to sharpen targeting. Trend charts and campaign comparisons help you evaluate results over time and optimize budgets with confidence.
Free
Organic social media mix dashboard cover image
Organic social media mix dashboard

Unified organic social media mix tracking across Facebook, Instagram, Pinterest, TikTok, X, and LinkedIn with impressions, followers, and engagement KPIs.

Cross-channel organic social media performance template by Supermetrics for Looker Studio. Consolidates Facebook, Instagram, Pinterest, TikTok, X (Twitter), and LinkedIn to track impressions, followers, engagements, and engagement rate. Surfaces total volume (paid and organic), growth deltas, and platform-level KPIs to spot what’s driving reach and where engagement drops. Helps prioritize channels and content types by comparing results side‑by‑side. Built for teams that need a quick, unified view of brand presence across networks.
Free
Looker Studio LinkedIn Pages Overview Report cover image
Looker Studio LinkedIn Pages Overview Report

Looker Studio template for tracking LinkedIn Pages visitors, followers, and update performance.

LinkedIn Pages performance template for Looker Studio that centralizes page insights from LinkedIn Page Analytics. Track visitor analytics, all and unique page views, follower count, and trends over time. Evaluate update-level metrics to see which posts drive engagement and reach. Built for marketers and social teams who need quick, actionable visibility into page growth and content impact.
Free
LinkedIn Pages Overall Performance cover image
LinkedIn Pages Overall Performance

LinkedIn Pages performance tracking for KPIs, page views, posts, and audience demographics in Looker Studio.

Comprehensive LinkedIn Pages analytics focused on the metrics that matter—clicks, engagements, impressions, reach, shares, and likes—with clear period-over-period comparisons. Break down page-view trends for key sections like About, Careers, Jobs, and Products, including desktop vs. mobile. Spot winners and underperformers fast with post performance, button clicks, and page analysis tables enhanced by bars and heatmaps. Understand your audience with demographics by job function, seniority, industry, follower country, and company size. Purpose-built for Looker Studio to centralize LinkedIn Page reporting for teams and stakeholders.
Free
Organic LinkedIn Report 3 pages side menu Metricool cover image
Organic LinkedIn Report 3 pages side menu Metricool

LinkedIn organic reporting with Metricool data covering growth trends, engagement, and top post performance across three pages.

LinkedIn analytics template powered by Metricool data to track your company page’s organic results across three focused pages: Summary, Growth, and Posts. See month-over-month and year-over-year comparisons for followers, engagement, interactions, and impressions, plus 12‑month follower trends and daily new followers. Identify the best days for growth and impressions, spotlight top posts by reach and engagement, and review a detailed post table with reactions, clicks, shares, views, and watch time. Built for client-ready reporting so teams can quickly spot what’s working and improve content and publishing cadence. Includes a 30‑day Metricool trial code and a connection tutorial.
$53.30
LinkedIn Leads Campaign Funnel Engagement Report cover image
LinkedIn Leads Campaign Funnel Engagement Report

Full‑funnel LinkedIn Ads lead‑gen tracking with geo, demographics, and top creative insights.

LinkedIn Ads Leads Campaign Funnel & Engagement highlights lead‑generation performance across campaigns in a single QBR view. It visualizes the full funnel—awareness, consideration, and lead gen—with KPIs like reach, impressions, frequency, CTR, CPC, lead form opens, completion rate, leads, and cost per lead. A geo map shows where results come from, and demographics reveal clicks by job title, seniority, company size, and top companies. See total campaigns, investment, and top‑performing creatives to spot what’s working and where to optimize budget.
Free
HubSpot cross-portal performance overview template cover image
HubSpot cross-portal performance overview template

Cross-portal HubSpot performance tracker for sessions, conversion to contacts, lifecycle funnel stages, page views, contacts, and customers.

HubSpot Cross-Portal Performance tracks marketing performance across multiple HubSpot portals in one view. Monitor traffic sessions, session-to-contact conversion, and average page views to understand engagement. Follow a full contact lifecycle funnel—from new visitor to contacts, MQLs, SQLs, opportunities, and customers—to find drop‑offs and growth opportunities. Trend charts for contacts and customers help highlight what’s working across domains.
Free
Google Analytics 4 GA4 Looker Studio Template cover image
Google Analytics 4 GA4 Looker Studio Template

Comprehensive GA4 Looker Studio template covering traffic, engagement, conversions, and ecommerce insights.

All‑in‑one GA4 dashboard for tracking website and app performance across traffic, engagement, conversions, and ecommerce. Break down visitor sources by marketing channel, location, and device to see where growth comes from. Spot winning content and understand user behavior with interaction and session metrics. Measure revenue, average order value, product performance, and shopping behavior to optimize sales. Compare time periods to uncover trends and seasonality for smarter planning.
£149
GA4 Audit cover image
GA4 Audit

GA4 attribution audit to spot misclassified traffic, “not set” issues, consent mode impacts, and inflated Direct.

GA4 self-audit focused on attribution integrity and data quality. Identifies spikes in Unassigned and (not set) sessions, highlights landing pages affected by missing parameters, and quantifies conversions tied to unknown sources. Evaluates how Consent Mode impacts Google/CPC attribution and detects over-attribution to Direct. Uses concise tables and trend lines to pinpoint misclassified traffic and measurement gaps. Ideal for marketers and analysts validating channel grouping and event parameter completeness.
Free
GA4 SEO Looker Studio Dashboard cover image
GA4 SEO Looker Studio Dashboard

GA4 SEO template highlighting traffic, organic performance, events, and purchases to reveal what drives growth.

Turns GA4 data into clear SEO insights across traffic, sources, and organic performance. Track sessions, users, engagement, and events with month‑over‑month and year‑over‑year trends to spot growth and issues quickly. Compare channels and page paths to see which content and acquisition paths drive sessions and conversions. Explore organic by country/region, events, and purchases to connect search behavior to outcomes. Ideal for marketers and business owners who want a clean view of what’s working in search and where to optimize.
$25
Google Ads VS Facebook Ads cover image
Google Ads VS Facebook Ads

Compare Google Ads vs Facebook Ads performance across CTR, CPC, CPA, spend, and conversions with geo and device insights.

Side-by-side comparison of Google Ads and Facebook Ads to pinpoint which channel delivers better results. Tracks CTR, CPC, cost per conversion, spend, impressions, clicks, and conversions with clear visual comparisons. Highlights top campaigns and ads with key metrics to spot quick wins and underperformers. Includes geo insights for where clicks come from and a device-level breakdown to guide budget shifts and targeting tweaks.
Free
Google Ads report template cover image
Google Ads report template

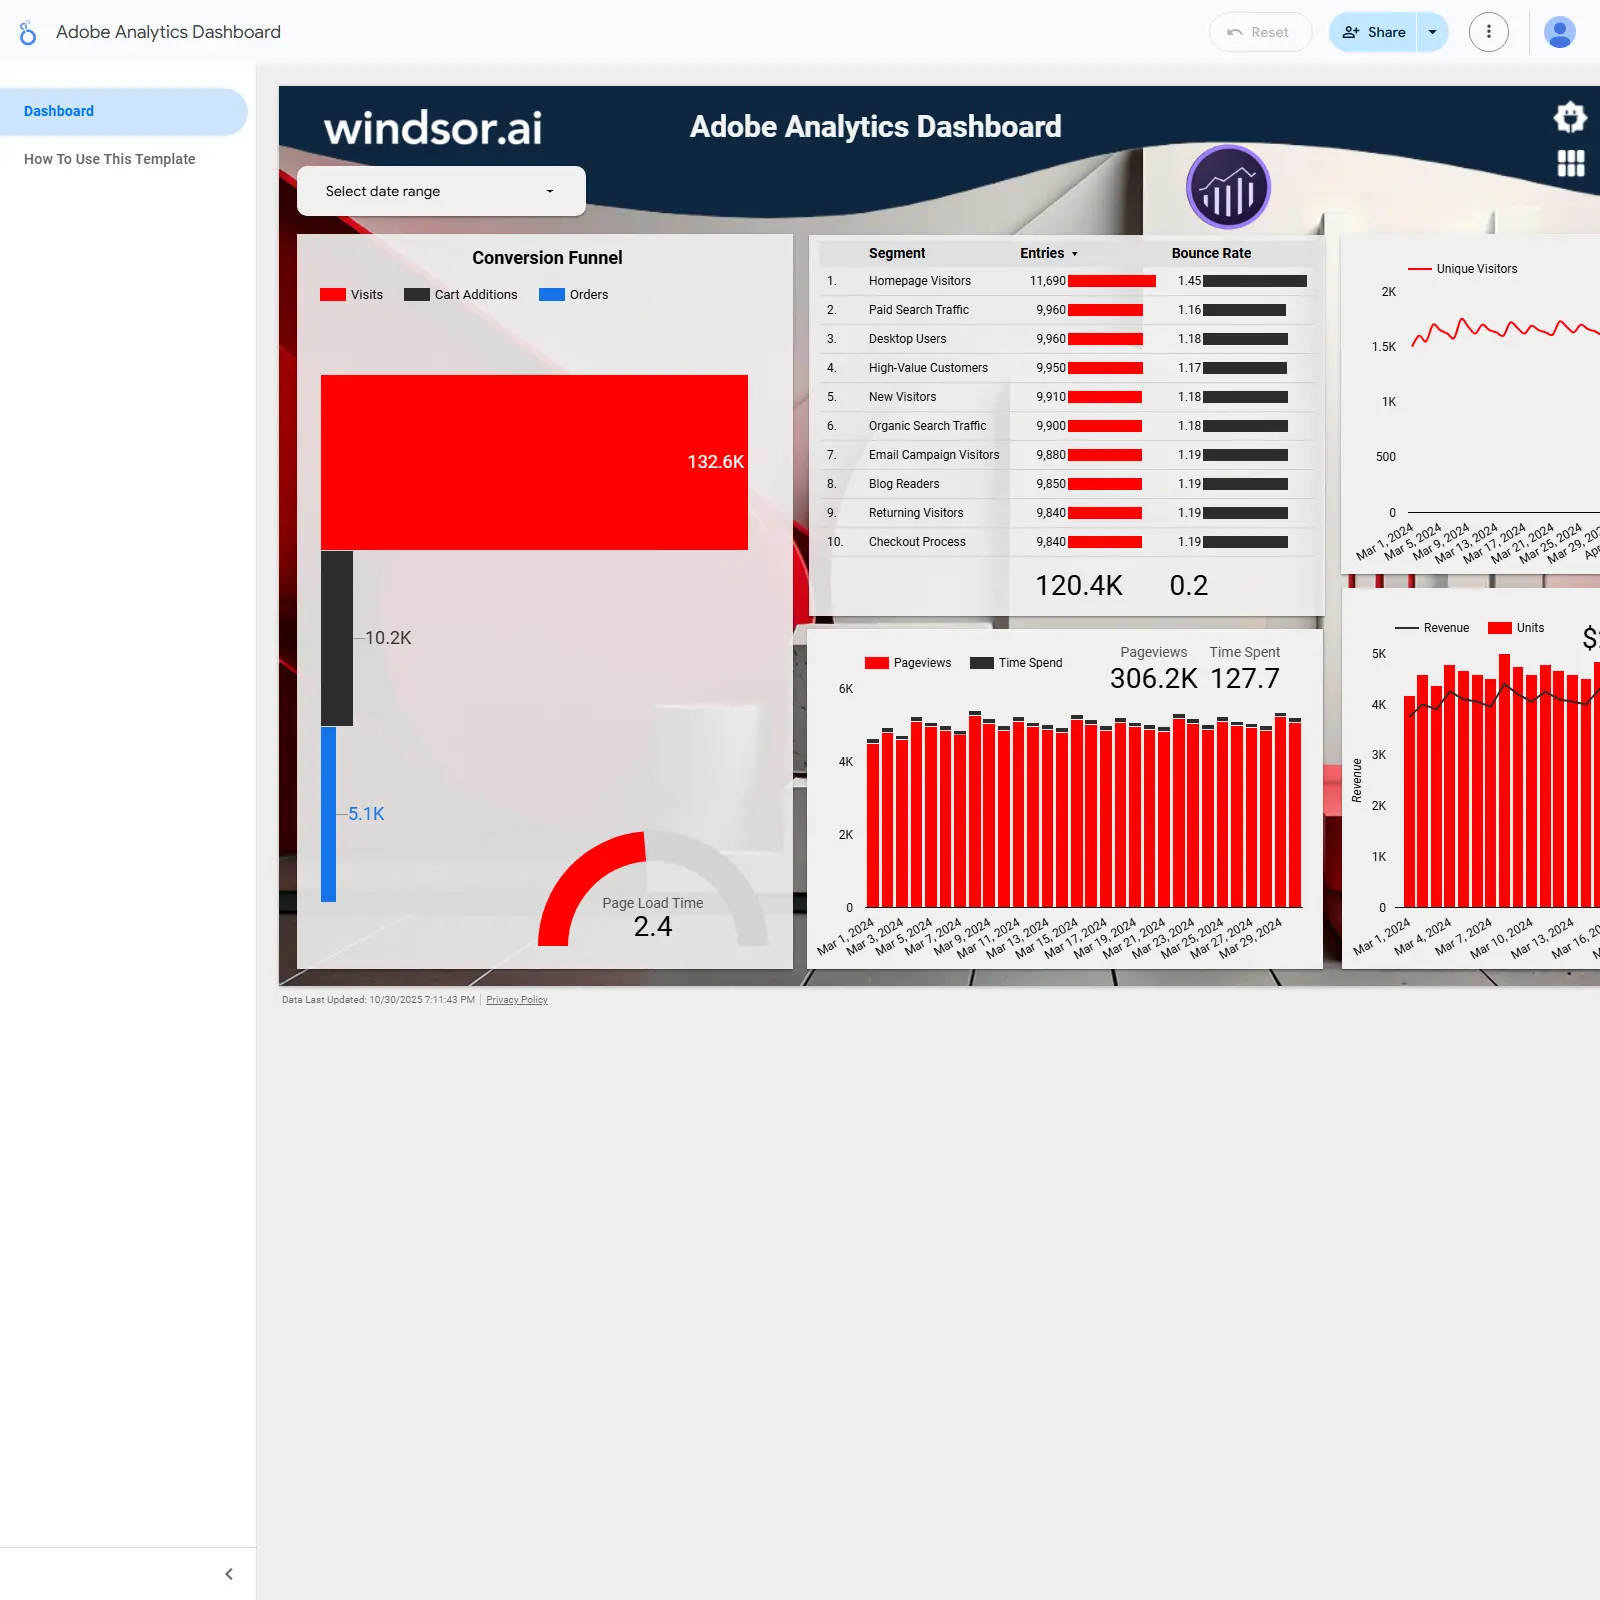
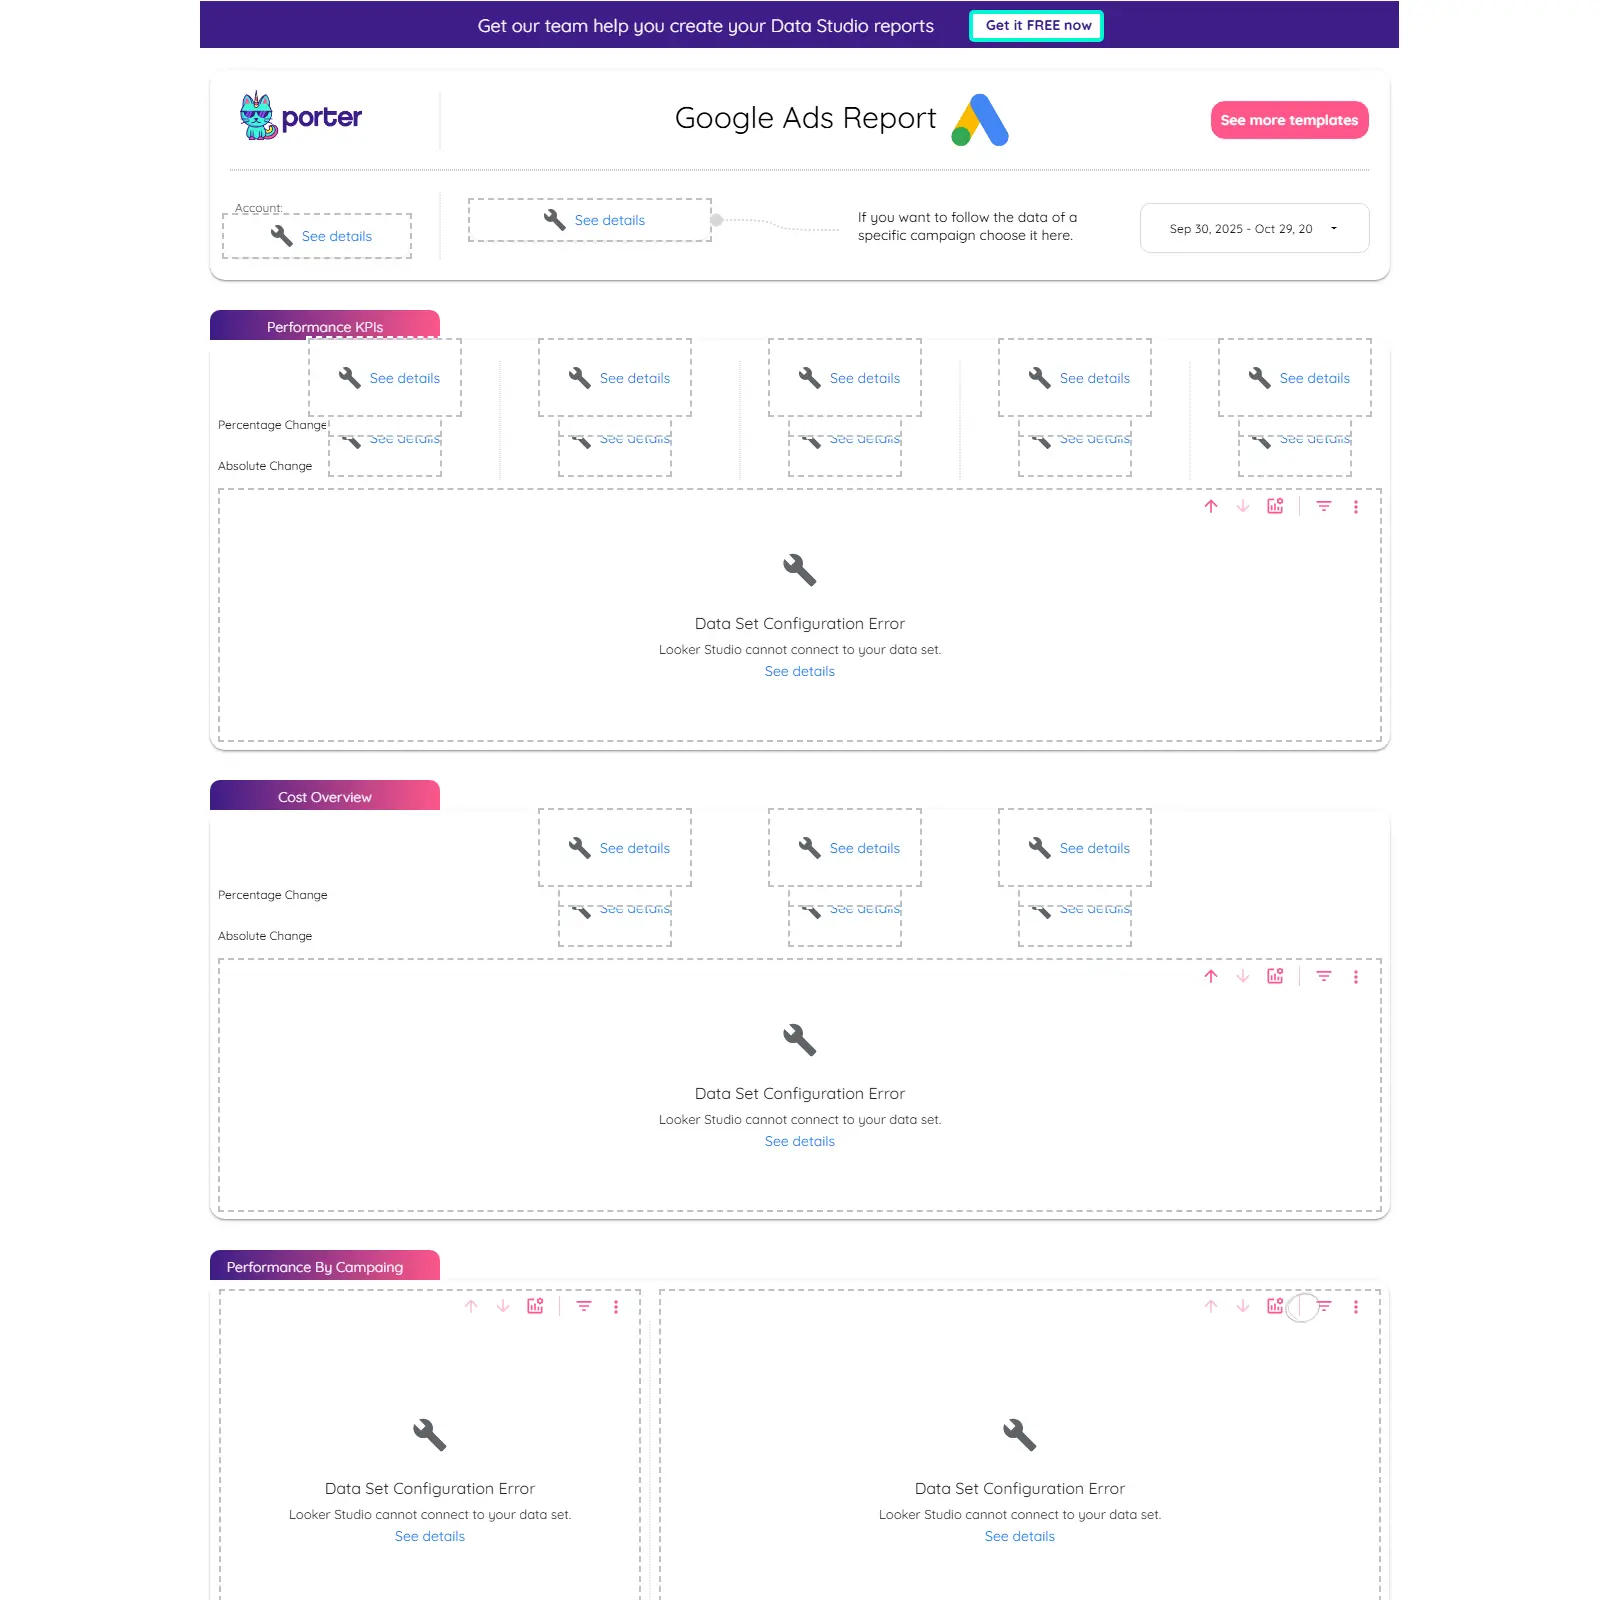
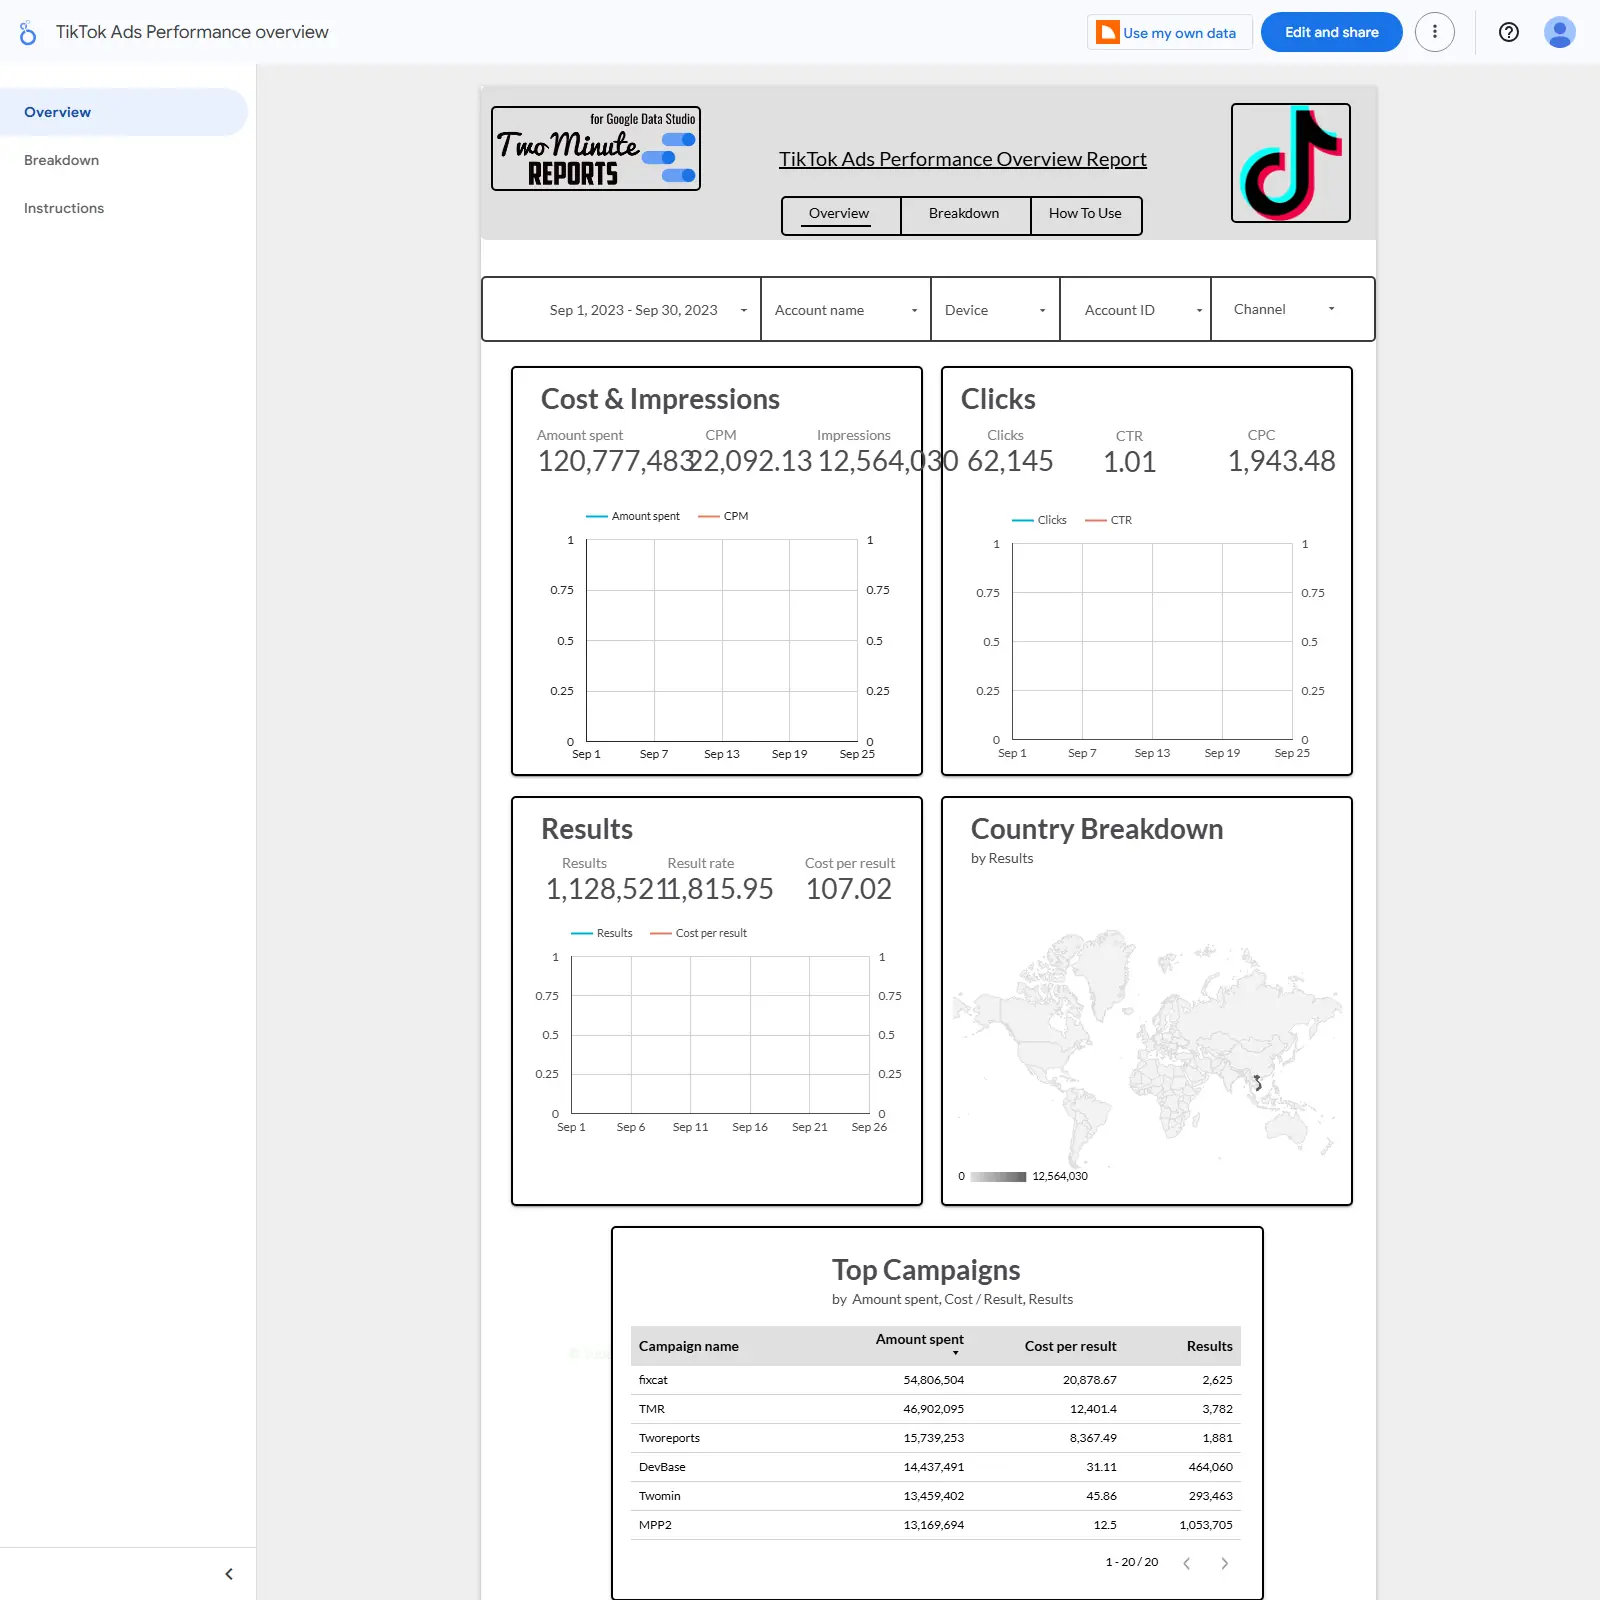
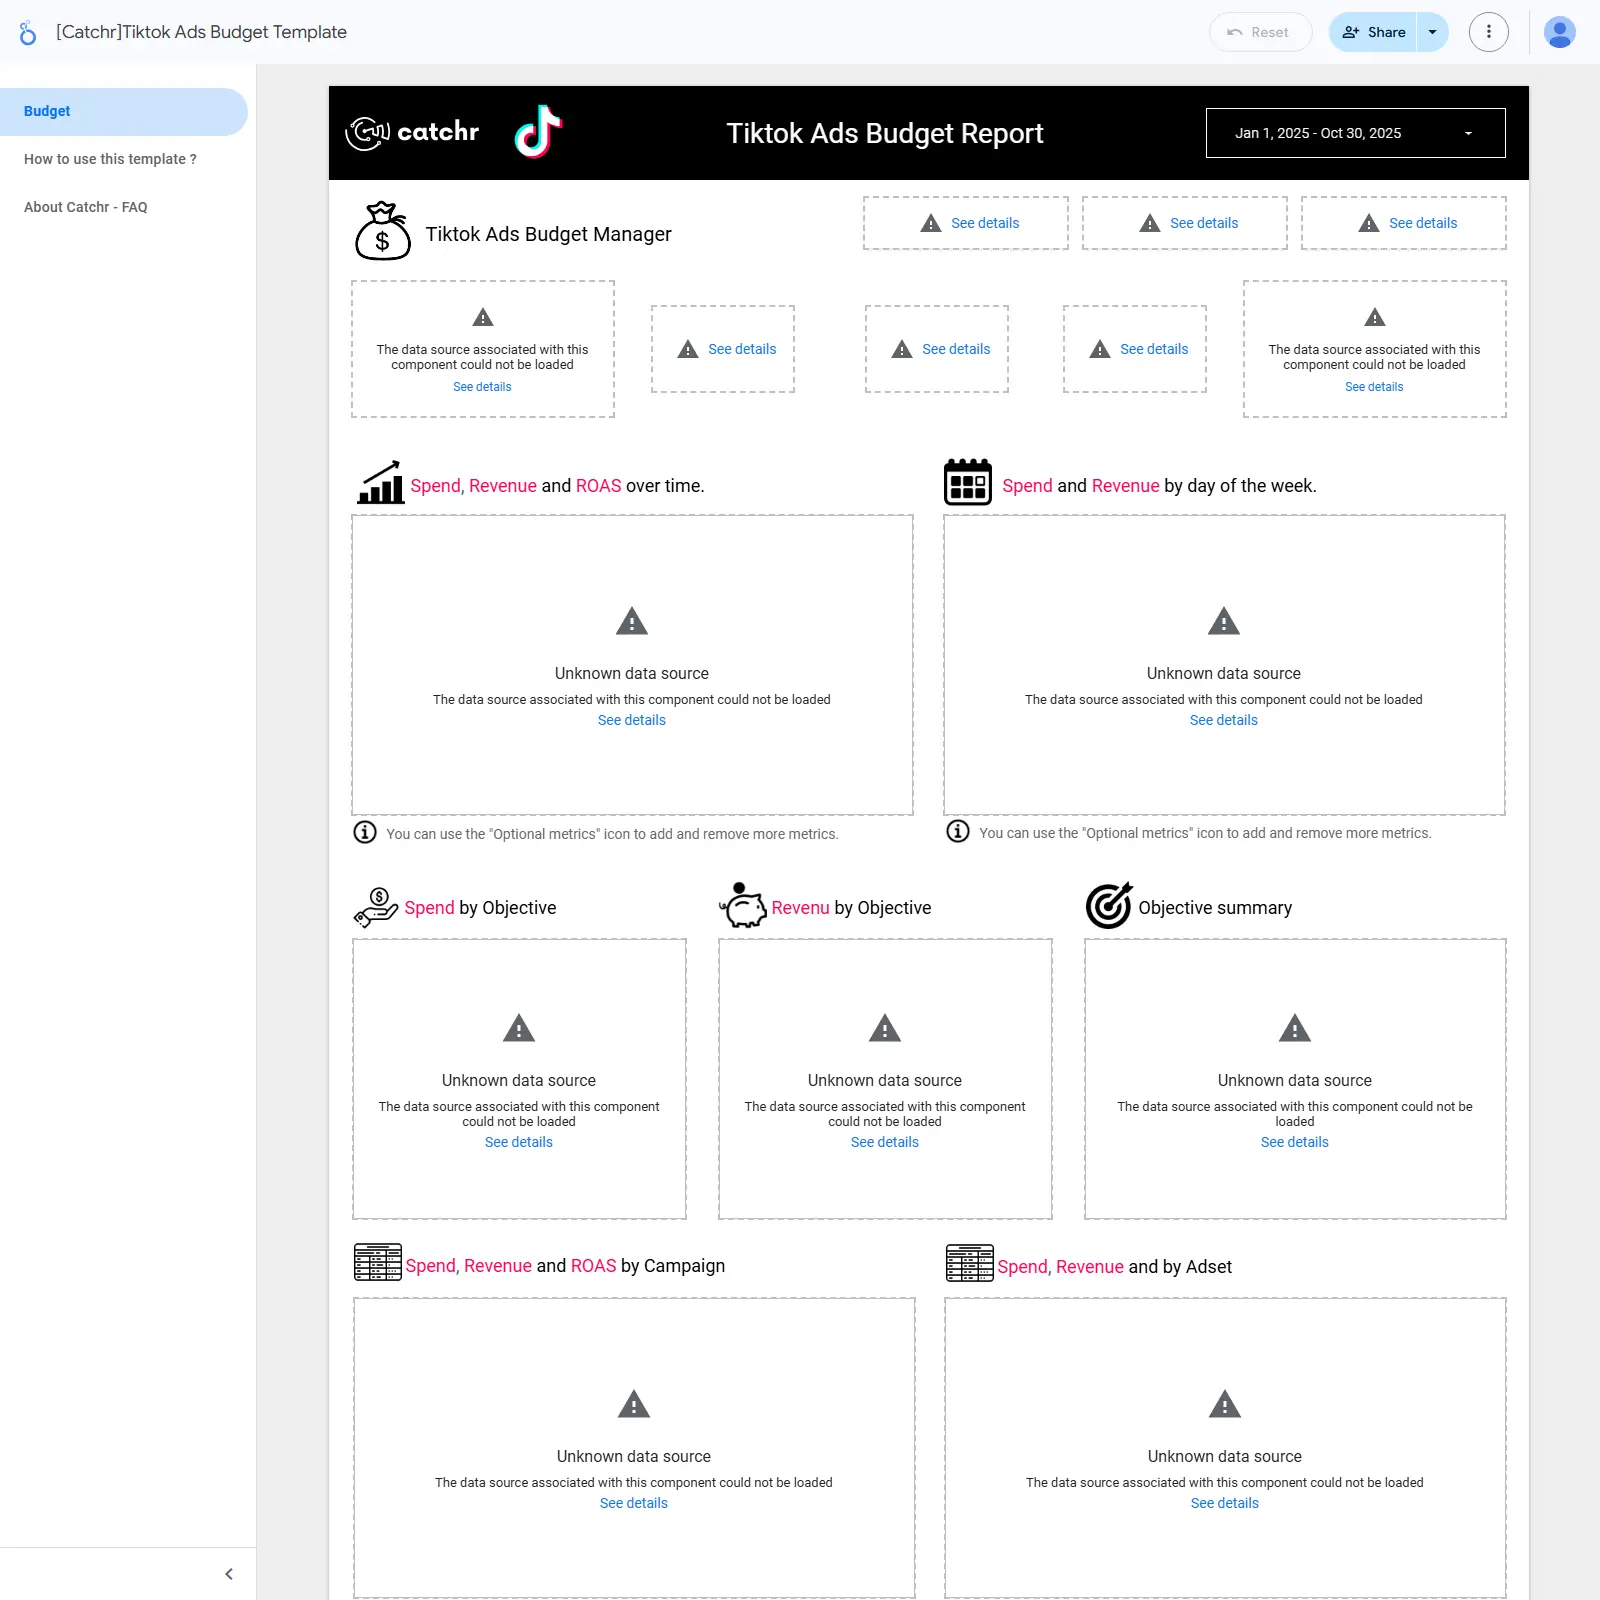
Google Ads PPC dashboard for Looker Studio to track spend, CTR, CPC, ROAS, and conversions by campaign, keyword, device, and location.

Google Ads performance template for Looker Studio focused on PPC visibility, clicks, and conversions. Track key metrics like impressions, CTR, CPC, CPM, ROAS, spend, and conversions to spot winners and waste. Break down results by campaign, ad group, keyword, device, and location to understand where performance comes from. Evaluate trends and answer practical questions such as which campaign converts best and how mobile CPC compares. Ideal for marketers and agencies needing a clear view of acquisition efficiency and return on ad spend.
Free
Google Ads Display Performance cover image
Google Ads Display Performance

Google Ads Display performance tracker with core KPIs, period comparisons, and breakdowns by demographics, geography, device, and campaign levels.

Tracks Google Ads Display campaign performance at the account, campaign, and ad group levels. Highlights key metrics like impressions, average CPM, and display impression share with daily trends versus the previous period. Breaks results down by demographics, audience targeting, geography, and device to reveal where reach and engagement are strongest. Surfaces top and lagging performers to guide bid, budget, and creative decisions. Ideal for marketers seeking quick, actionable visibility into display outcomes.
Free
Google Ads Impression Share Insights cover image
Google Ads Impression Share Insights

Google Ads impression share insights with YoY changes, daily trends, and breakdowns by slot, type, and keywords.

Google Ads Impression Share Insights focused on measuring how often ads appear versus total opportunities. Highlights visibility and reach with year‑over‑year change, plus daily trends for cost and search impression share against the previous period. Breaks performance down by ad slot, ad type, and keywords to spot where coverage is gained or lost. Helps diagnose gaps from budget or rank and prioritize optimizations to grow exposure and efficiency.
Free
Google Ads Account Health cover image
Google Ads Account Health

Google Ads account health overview with spend trends, performance snapshots, and channel views for Search, Display, Video, Shopping, and App.

Google Ads account health template focused on fast diagnosis of performance and spend. Provides a daily spend trend, a performance snapshot, and an account performance overview to quickly spot shifts. Includes dedicated views for Search, Display, Video, Shopping, and App campaigns to compare channels. Useful for catching anomalies, pacing issues, and reporting wins in weekly reviews. A notes section helps capture insights and actions.
Free
Google Ads Budget Depletion Insights cover image
Google Ads Budget Depletion Insights

Daily and hourly Google Ads budget depletion insights to prevent budget‑limited downtime and optimize spend.

Google Ads Budget Depletion Insights focuses on spotting when campaign budgets run out and where spend is constrained. Daily and hourly summaries surface budget pacing and depletion patterns so you can reallocate budgets and protect performance. Ideal for monitoring budget‑limited campaigns and identifying the times of day when coverage drops. Not intended for Shopping campaigns.
Free
Facebook Funnel Template cover image
Facebook Funnel Template

Funnel-focused Facebook Pages dashboard that measures reach, engagement, clicks, comments, and reactions by post.

Facebook Pages funnel analytics focused on how audiences move from seeing a post to engaging with it. Tracks post views, unique reach, and average views per person, then quantifies engagement rate across clicks, comments, and reactions. Breaks out click and comment rates plus the share each contributes to overall engagement. Includes a reactions breakdown (Like, Love, Haha, Wow, Anger, Sorry) and a performance-by-post view to spot drop‑offs and winning content. Built for social teams to optimize content and prove impact quickly.
Free
Facebook Ads Google Ads report template cover image
Facebook Ads Google Ads report template

Unified Facebook Ads + Google Ads template for tracking PPC metrics, blended spend, and ROI across channels.

Blends Facebook (Meta) Ads and Google Ads into one PPC performance view in Looker Studio. Track CTR, CPC, conversions, CPA, ROAS, impressions, and spend with comparisons by campaign, ad group/ad set, device, location, and demographics. See blended ad spend and daily results to compare channels, spot trends, and shift budgets with confidence. Ideal for marketers and agencies needing quick cross-platform insights and ROI tracking.
Free
CallRail call tracking dashboard cover image
CallRail call tracking dashboard

CallRail analytics covering call and lead trends, timing patterns, sources, and agent answer performance.

CallRail performance tracking focused on calls, leads, and answer quality. Monitor month‑over‑month trends for calls vs. leads and answer rate vs. lead rate. Identify peak times with calls by day of week and hour and see how many are first‑time callers. Attribute conversions with a breakdown by traffic source. Evaluate team responsiveness with answer rates by agent email to optimize campaigns and staffing.
Free
Free Adobe Analytics Dashboard Template on Looker Studio cover image
Free Adobe Analytics Dashboard Template on Looker Studio

Adobe Analytics KPIs in Looker Studio with conversion funnel, segments, engagement, speed, and revenue tracking.

Adobe Analytics data visualized in Looker Studio to track website performance, customer behavior, and marketing outcomes. Covers core KPIs including unique visitors, pageviews, time on site, bounce rate, page load time, revenue, units, and orders. Features a conversion funnel from visits to cart additions to orders, plus segment-level views with entries and bounce rate. Includes time-series charts for engagement and revenue to spot trends and campaign impact. Helps identify bottlenecks and high-value segments to optimize content, UX, and acquisition channels.
Free
SEM report template cover image
SEM report template

SEM/Google Ads template that pinpoints PPC ROI with KPIs, cost insights, and campaign comparisons across devices and locations.

An SEM/Google Ads performance template built to track PPC efficiency and ROI across campaigns, ad groups, keywords, devices, and locations. Highlights core metrics such as impressions, clicks, ad spend, CTR, CPC, CPM, conversions, and ROAS to surface what’s working and what’s wasting budget. Provides KPI and cost overviews plus campaign-level comparisons to uncover high-ROI campaigns, weak segments, and optimization opportunities. Ideal for paid media teams and agencies needing quick, actionable insights from Google Ads data.
Free
Youtube Channel Dashboard Looker Studio Template cover image
Youtube Channel Dashboard Looker Studio Template

Looker Studio template for YouTube analytics with channel overview, video-level performance, retention, and revenue insights.

YouTube Channel Dashboard for Looker Studio that consolidates views, watch time, subscriber growth, audience demographics, traffic sources, engagement rate, and revenue. Includes an Overview for channel health and a Video Explorer to compare individual videos by views, likes/dislikes, comments, and audience retention. Surfaces top performers, themes, and trends to refine content strategy and boost audience engagement. Built on the YouTube Analytics connector with a clean, executive‑friendly layout for creators, marketers, and analysts.
£139
Report X Organic Twitter 3 pages Metricool cover image
Report X Organic Twitter 3 pages Metricool

3-page X (Twitter) organic analytics template that tracks growth, engagement, and top posts with MoM/YoY comparisons from Metricool data.

Three-page Looker Studio template for X (Twitter) organic analytics powered by Metricool. Tracks month-over-month and year-over-year performance for followers, engagement, impressions, likes, reposts, and interactions. Covers community growth with daily follows/unfollows, new followers by month, and the best days to gain followers. Evaluates posting with daily engagement, impressions, interactions, mentions, a full post table, and the top 5 posts by reach and engagement. Client-ready visuals and a quick setup, plus a 30‑day Metricool trial code included.
$40.47
X Ads Twitter dashboard template cover image
X Ads Twitter dashboard template

Monitor X Ads (Twitter) performance across CTR, CPC/CPM, conversions, CPA, top campaigns, and platform breakdowns.

X Ads (Twitter) Overview tracks paid social performance with clear views of impressions, clicks, CTR, and spend. Monitor conversion rate, CPC, CPM, and CPA to understand efficiency and ROI. Compare top campaigns to quickly see what’s working and what isn’t. Break down results by platform to pinpoint where clicks, cost, and conversions come from. Built for marketers and decision‑makers who need fast, actionable insight into X Ads performance.
Free
TikTok Ads Overview cover image
TikTok Ads Overview

Monthly TikTok Ads overview highlighting spend, efficiency metrics, top 10 campaigns, and country/objective breakdowns.

Monthly TikTok Ads performance summary focused on a rolling 30‑day period. Tracks spend, impressions, CPM, clicks, CTR, CPC, results, result rate, and cost per result to gauge efficiency. Surfaces the top 10 high‑performing ads and campaigns with a clear table of results and costs. Adds geographic insight with a country breakdown and compares metrics by campaign objective to reveal where conversions and costs differ. Built to quickly spot winning campaigns and redirect budget to what works.
Free
TikTok Ads Overview - Campaign and audience info cover image
TikTok Ads Overview - Campaign and audience info

End-to-end TikTok Ads analytics covering campaign performance, costs, and audience demographics.

Get a complete view of TikTok ad campaigns and audience impact across any date range. Track spend, clicks, CPM, conversions, and cost per conversion with scorecards, time series, and a detailed campaign table covering name, type, objective, status, creation date, budget, and amount spent. Compare cost distribution by campaign objective and monitor performance trends over time. Break down impressions by country, gender, age group, device, and ad name to see where reach and results come from.
Free
Tiktok Ads Budget Report cover image
Tiktok Ads Budget Report

A TikTok Ads budget tracker with spend, revenue, ROAS, and breakdowns by objective, campaign, ad set, and day of week.

Track TikTok Ads budget, revenue, and ROAS to keep spend on target and protect profit. Visualize trends over time and by day of week to spot pacing and seasonality. Drill into objective, campaign, and ad set to find what converts and shift budget to top performers. A budget manager and objective summary put the key KPIs front and center. Connects to live TikTok Ads data via Catchr for up‑to‑date numbers.
Free
StackAdapt report cover image
StackAdapt report

StackAdapt campaign performance dashboard covering CTR, conversions, CPC/CPM, ROAS, and top campaigns.

StackAdapt advertising performance template focused on analyzing programmatic campaigns. Tracks CTR and impressions alongside clicks, conversions, conversion rate, and cost per conversion. Highlights CPC and CPM with total spend to monitor efficiency. Surfaces ROAS and top campaigns plus a clicks breakdown by campaign type for quick optimization priorities.
Free
Spotify Ads overview performance dashboard cover image
Spotify Ads overview performance dashboard

Analyze Spotify Ads with trends, country spend, platform split, and campaign details.

Looker Studio template for Spotify Ads performance tracking. Visualizes performance trends over time, spend by country, platform split, and campaign-level details. Highlights where budget goes and which geographies or platforms drive results. Helps marketers quickly spot spikes, compare campaigns, and optimize spend. Built with a clean Supermetrics layout for fast insight discovery.
Free
Snapchat Ads - 32 Days Performance Overview cover image
Snapchat Ads - 32 Days Performance Overview

Snapchat Ads 32‑day performance overview with KPIs, trends, geo and demographic breakdowns, plus top campaigns and ads.

A focused Snapchat Ads Looker Studio template for tracking the last 32 days of performance across purchases, swipes, impressions, swipe‑up rate, eCPV, and eCPM. Visualizes impressions and video views over time to spot trends. Breaks down reach by country, gender, and age for quick audience insights. Surfaces top campaigns and top ads with key engagement and conversion signals to pinpoint winners. Ideal for fast optimization and client reporting on Snap Ads.
Free
Snapchat overview performance dashboard cover image
Snapchat overview performance dashboard

Snapchat Ads dashboard for tracking impressions, video views, demographics, and top-performing campaigns/ads.

Snapchat Marketing analytics template focused on Snapchat Ads performance. Tracks totals, impressions, and video views over time, with breakdowns by country, age, and gender. Highlights top campaigns and top ads to surface what’s driving reach and engagement. Helps marketers refine targeting, compare creatives, and reallocate spend based on winners.
Free
Template Pinterest Overview V2 cover image
Template Pinterest Overview V2

Pinterest Ads dashboard to monitor spend, video engagement, conversions, and revenue in one place.

Pinterest Ads performance template focused on measuring delivery, engagement, and outcomes across campaigns. Track investment, video views, cost per view (including 100% views), average watch time, clicks by campaign, and weekly performance to understand what’s driving results. Breakdowns across three pages—Diffusion, Video Views, and Results—highlight how widely ads were served, how deeply they were watched, and how well they converted into revenue. Ideal for quickly spotting winning creatives and optimizing spend with real-time Pinterest Ads KPIs.
Free
SEO report template cover image
SEO report template

SEO Looker Studio template that visualizes Google Search Console metrics—queries, pages, CTR, position, and trends by country and device.

SEO performance template focused on Google Search Console data to track impressions, clicks, CTR, average position, and top queries and pages. Break down results by country and device to spot growth opportunities and content gaps, and blend data to relate traffic with conversions and goals. Identify winning keywords, declining pages, and the impact of mobile vs. desktop on engagement. Includes white‑label styling, custom charts, historical trends, filters, and optional email alerts for stakeholders.
Free
Facebook Ads Brand Awareness Template cover image
Facebook Ads Brand Awareness Template

Track Facebook/Instagram brand awareness with impressions, clicks, spend, branded metrics, and branded search lift in Looker Studio.

A Looker Studio template for tracking Facebook and Instagram brand awareness in one place. Monitor core KPIs—ad impressions, clicks, spend, branded impressions, and branded clicks—with weekly trends. Link ad activity to outcomes by comparing spend with branded engagement to judge ROI on awareness campaigns. Adds branded search context from Google Search Console to show how ads influence search interest. Built for marketers and agencies who need a clear view of brand reach and lift across Meta ads.
Free