Price: Free Templates

The best free & paid Looker Studio templates, curated and quality-ranked for data reporting.

Clear All

Showing 201 - 240 of 443

HubSpot cross-portal performance overview template cover image
HubSpot cross-portal performance overview template

Cross-portal HubSpot performance tracker for sessions, conversion to contacts, lifecycle funnel stages, page views, contacts, and customers.

HubSpot Cross-Portal Performance tracks marketing performance across multiple HubSpot portals in one view. Monitor traffic sessions, session-to-contact conversion, and average page views to understand engagement. Follow a full contact lifecycle funnel—from new visitor to contacts, MQLs, SQLs, opportunities, and customers—to find drop‑offs and growth opportunities. Trend charts for contacts and customers help highlight what’s working across domains.
Free
Time tracking dashboard for Harvest cover image
Time tracking dashboard for Harvest

Harvest time‑tracking and billing overview with hours, billable amounts, active users, and client/project insights.

Harvest time tracking and billing analytics to monitor team utilization and revenue. Highlights total hours, billable hours, billable amount, and active users with clear month‑over‑month changes. Breaks down time and billings by client, project, user, and task to pinpoint top contributors and bottlenecks. Includes charts for hours and billable amount by client and project plus a calendar view for daily patterns. Ideal for agencies and services teams looking to align workload with billings.
Free
Ultimate Ecommerce Google Analytics 4 GA4 cover image
Ultimate Ecommerce Google Analytics 4 GA4

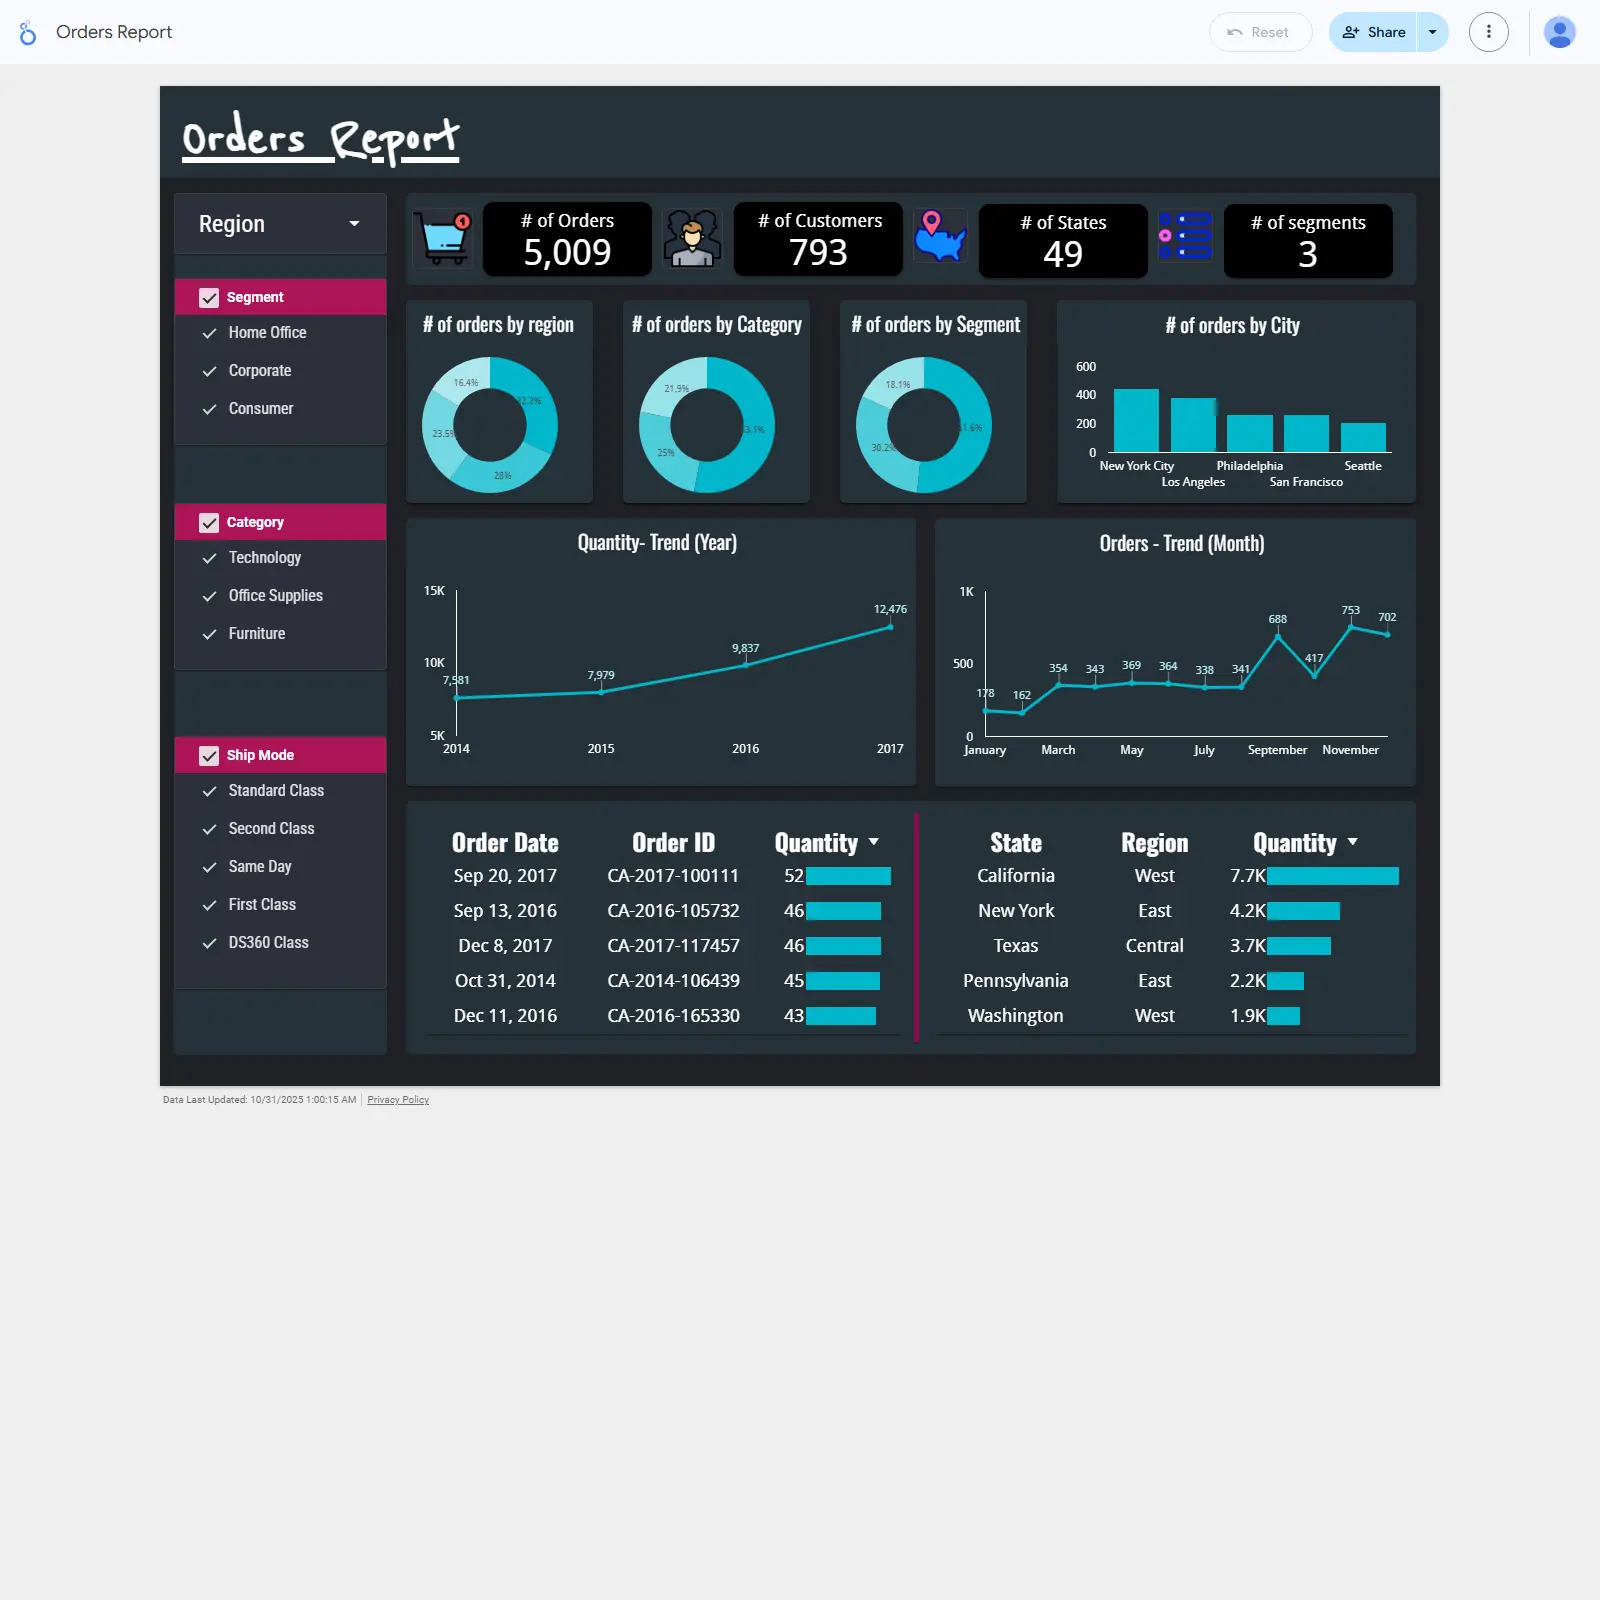
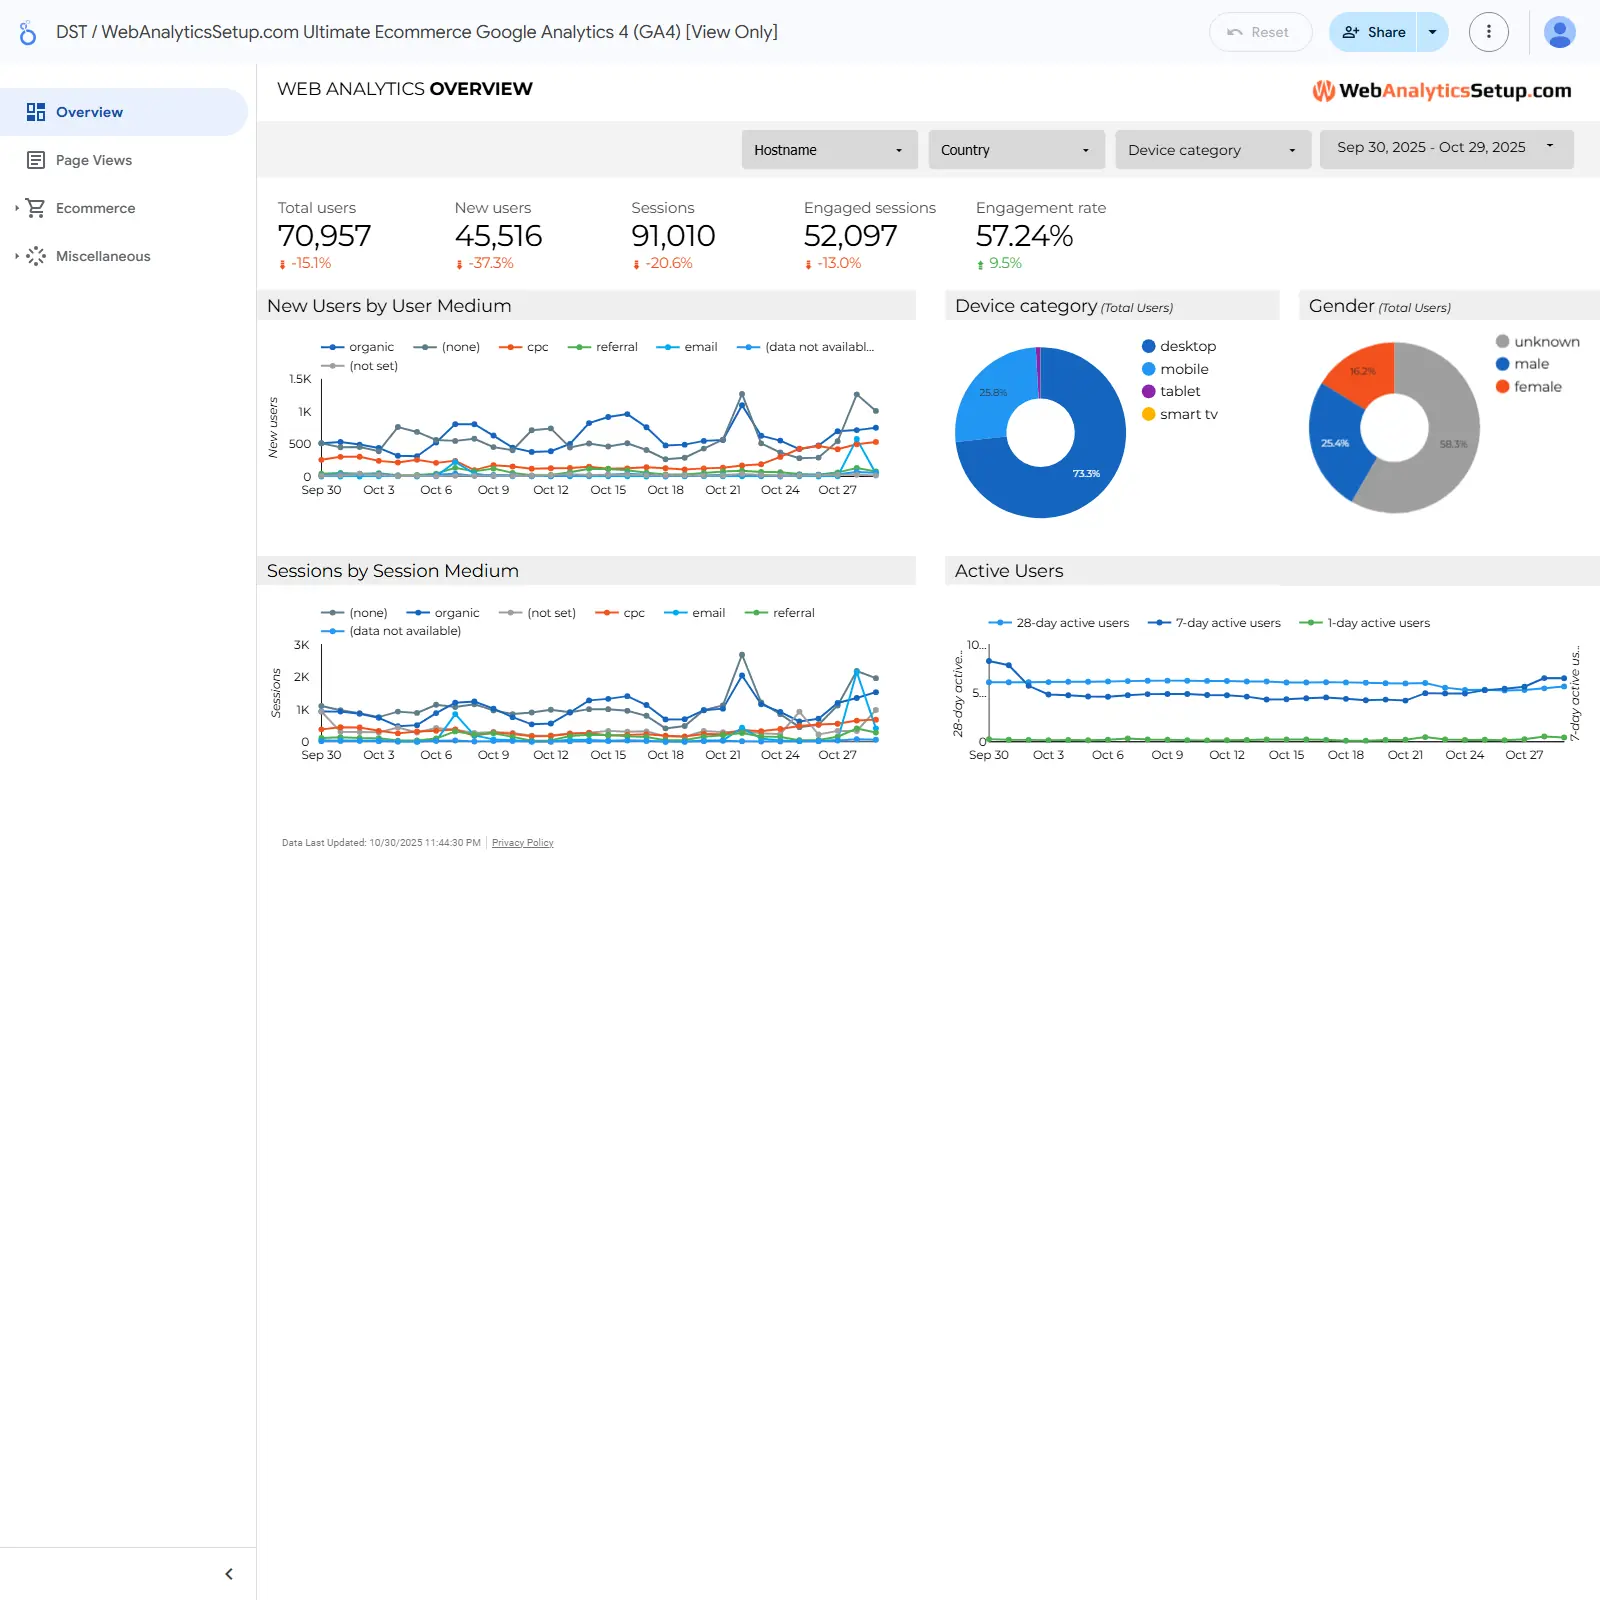
GA4 ecommerce dashboard for tracking acquisition, engagement, devices, demographics, and active users.

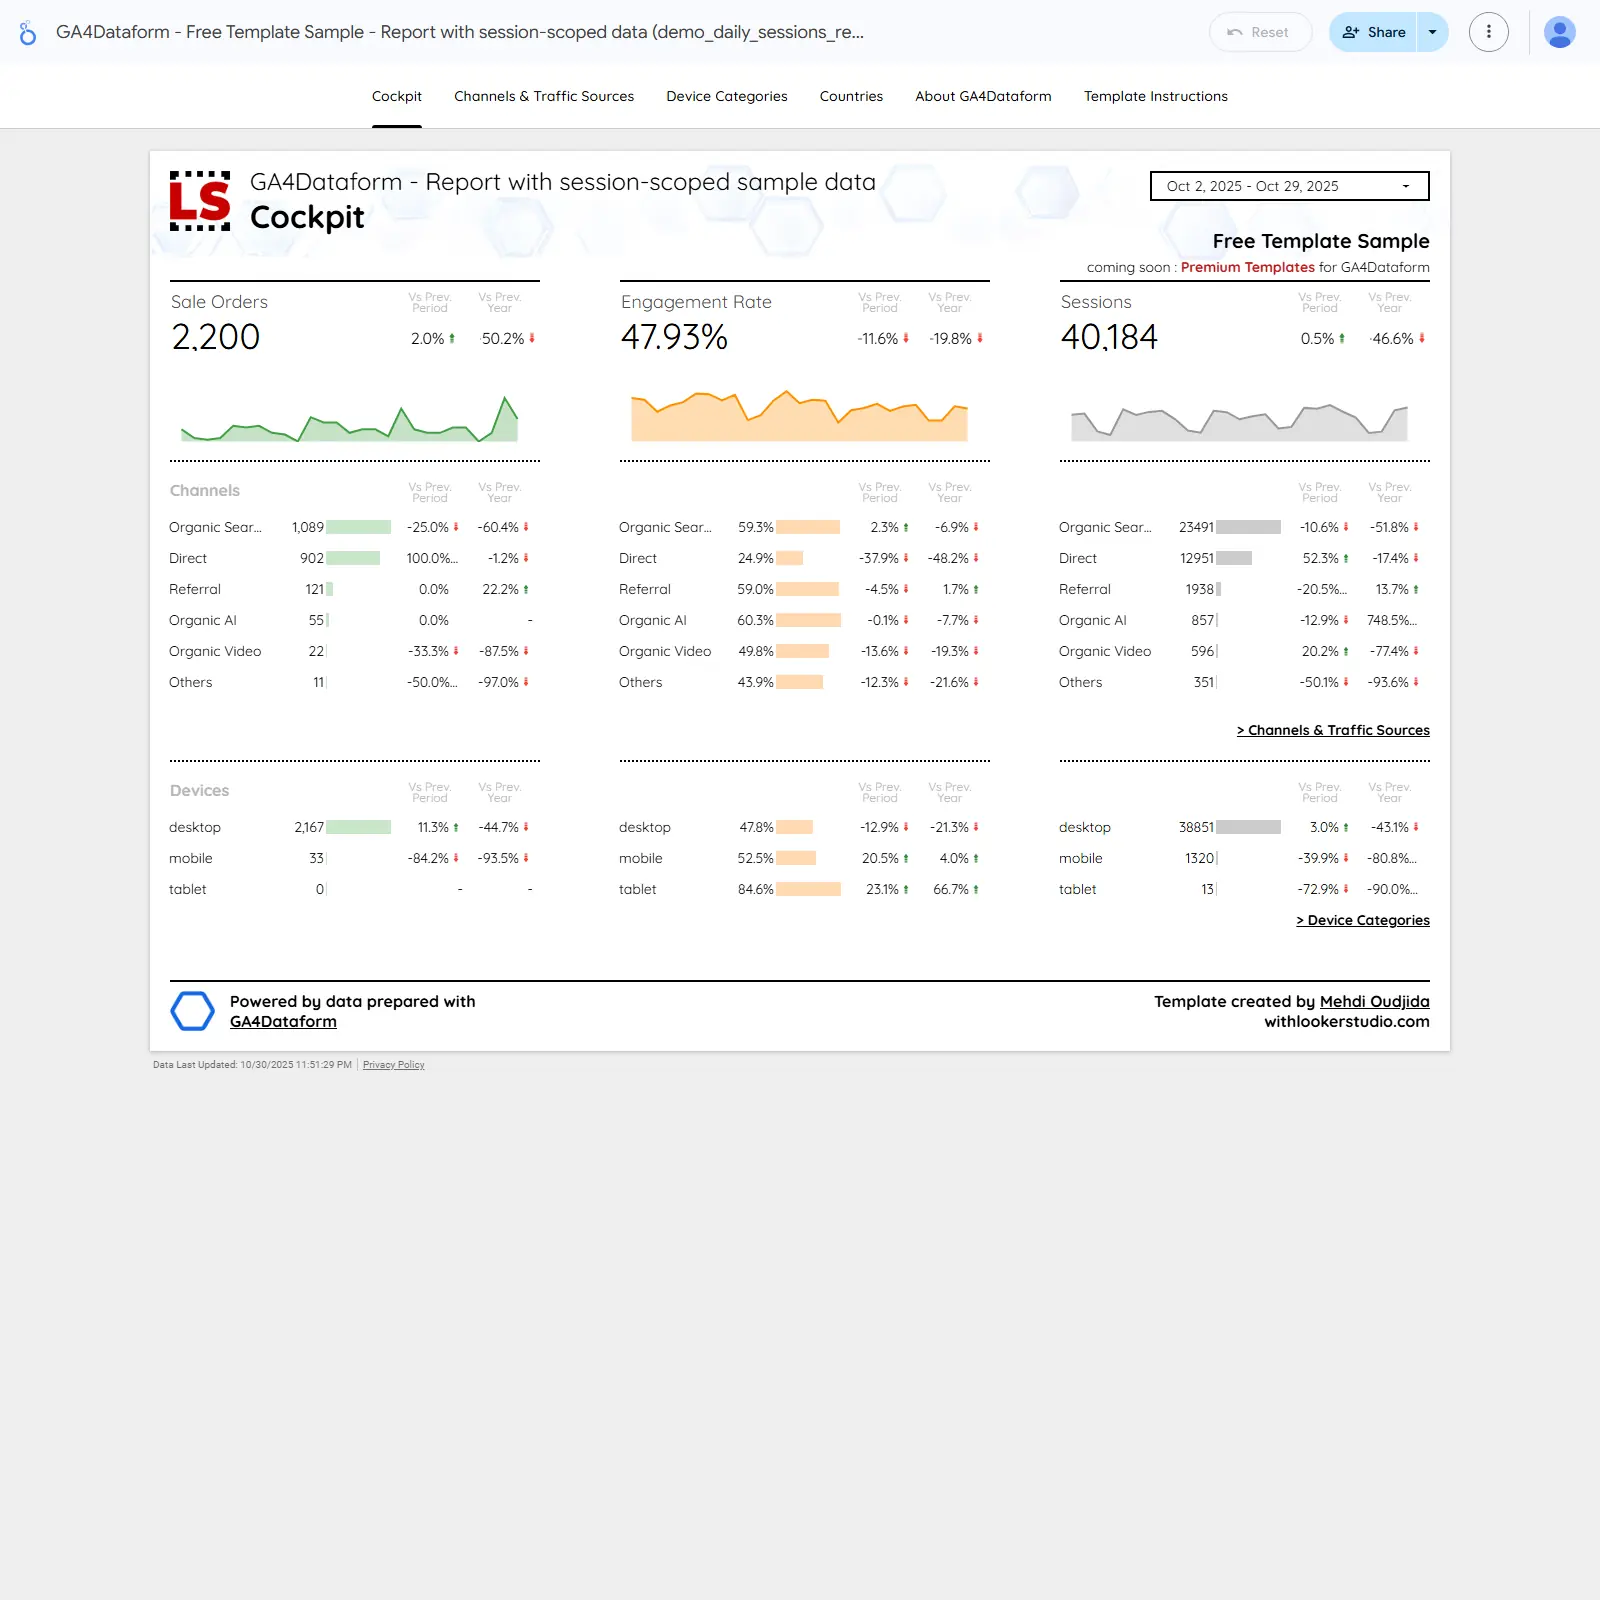
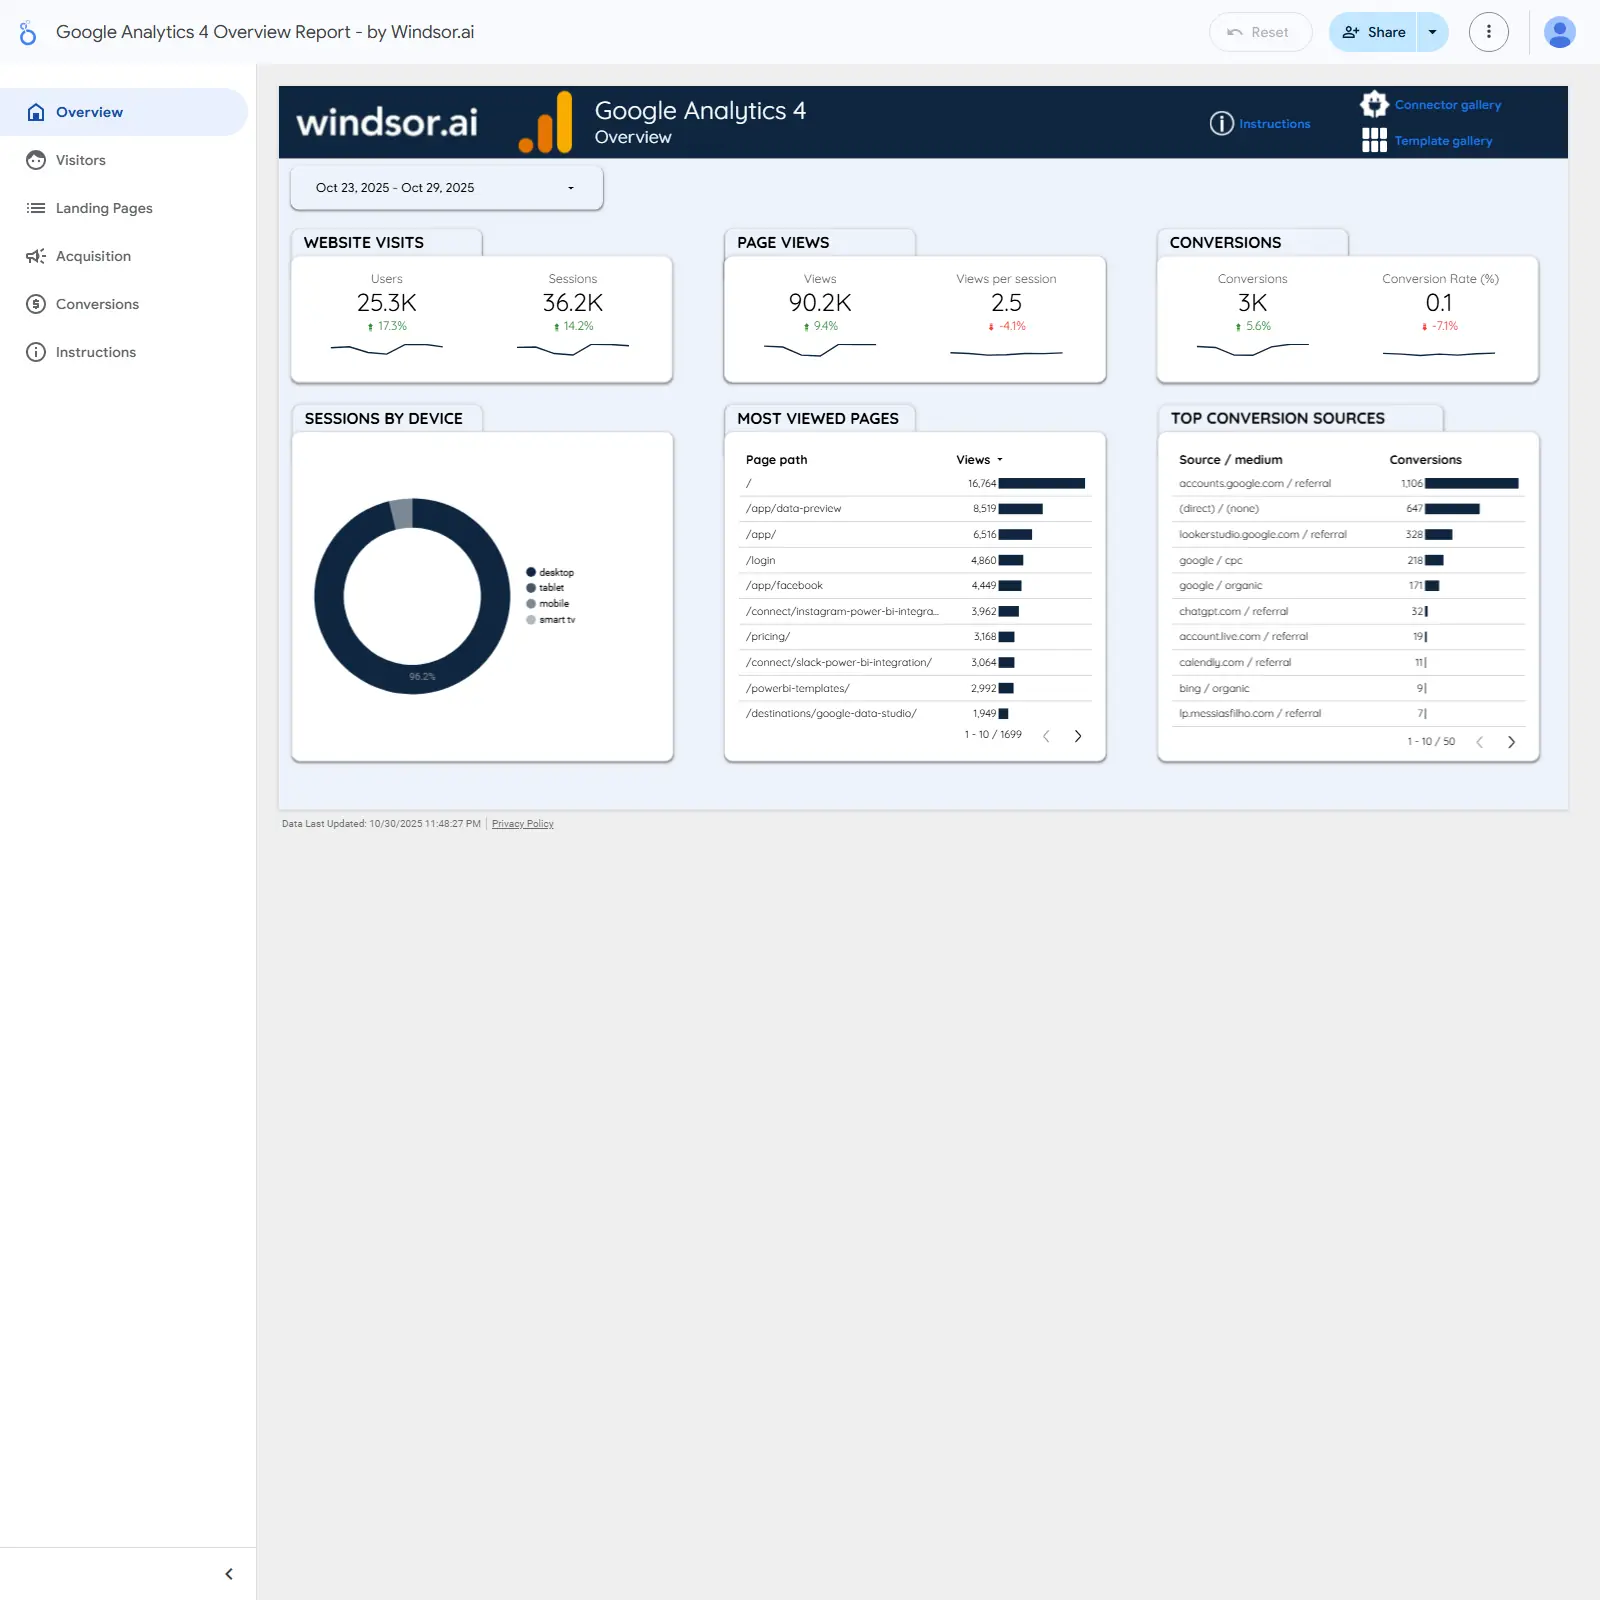
GA4 ecommerce template that brings together acquisition, engagement, and audience insights for online stores. Track users, new users, sessions, engaged sessions, and engagement rate with filters for hostname, country, device, and date. Visualize trends by traffic medium, device category share, gender mix, and 1/7/28‑day active users. Sections for Overview, Page Views, Ecommerce, and Miscellaneous help move from traffic to revenue analysis. Useful for spotting winning channels, device optimization opportunities, and audience shifts fast.
Free
GA4 Audit cover image
GA4 Audit

GA4 attribution audit to spot misclassified traffic, “not set” issues, consent mode impacts, and inflated Direct.

GA4 self-audit focused on attribution integrity and data quality. Identifies spikes in Unassigned and (not set) sessions, highlights landing pages affected by missing parameters, and quantifies conversions tied to unknown sources. Evaluates how Consent Mode impacts Google/CPC attribution and detects over-attribution to Direct. Uses concise tables and trend lines to pinpoint misclassified traffic and measurement gaps. Ideal for marketers and analysts validating channel grouping and event parameter completeness.
Free
GA4 File Download Report Legacy cover image
GA4 File Download Report Legacy

GA4 Looker Studio template focused on file_download events to reveal top files, trends, and channel/device sources for smarter content and promotion decisions.

GA4 File Download Event Analysis template for Looker Studio that turns the file_download event into clear, actionable insights. Identify top downloaded files, extensions, and filenames, track trends over time, and see distribution by device, marketing channel, and traffic source. Pinpoint which assets drive engagement and where downloads originate to guide content, promotion, and UX decisions. Supports both the native GA4 connector (with registered event parameters) and a BigQuery workflow. Includes overview and detail views to investigate spikes, anomalies, and high-performing assets.
Free
Google Ads VS Facebook Ads cover image
Google Ads VS Facebook Ads

Compare Google Ads vs Facebook Ads performance across CTR, CPC, CPA, spend, and conversions with geo and device insights.

Side-by-side comparison of Google Ads and Facebook Ads to pinpoint which channel delivers better results. Tracks CTR, CPC, cost per conversion, spend, impressions, clicks, and conversions with clear visual comparisons. Highlights top campaigns and ads with key metrics to spot quick wins and underperformers. Includes geo insights for where clicks come from and a device-level breakdown to guide budget shifts and targeting tweaks.
Free
Google Ads report template cover image
Google Ads report template

Google Ads PPC dashboard for Looker Studio to track spend, CTR, CPC, ROAS, and conversions by campaign, keyword, device, and location.

Google Ads performance template for Looker Studio focused on PPC visibility, clicks, and conversions. Track key metrics like impressions, CTR, CPC, CPM, ROAS, spend, and conversions to spot winners and waste. Break down results by campaign, ad group, keyword, device, and location to understand where performance comes from. Evaluate trends and answer practical questions such as which campaign converts best and how mobile CPC compares. Ideal for marketers and agencies needing a clear view of acquisition efficiency and return on ad spend.
Free
Google Ads Display Performance cover image
Google Ads Display Performance

Google Ads Display performance tracker with core KPIs, period comparisons, and breakdowns by demographics, geography, device, and campaign levels.

Tracks Google Ads Display campaign performance at the account, campaign, and ad group levels. Highlights key metrics like impressions, average CPM, and display impression share with daily trends versus the previous period. Breaks results down by demographics, audience targeting, geography, and device to reveal where reach and engagement are strongest. Surfaces top and lagging performers to guide bid, budget, and creative decisions. Ideal for marketers seeking quick, actionable visibility into display outcomes.
Free
Google Ads Impression Share Insights cover image
Google Ads Impression Share Insights

Google Ads impression share insights with YoY changes, daily trends, and breakdowns by slot, type, and keywords.

Google Ads Impression Share Insights focused on measuring how often ads appear versus total opportunities. Highlights visibility and reach with year‑over‑year change, plus daily trends for cost and search impression share against the previous period. Breaks performance down by ad slot, ad type, and keywords to spot where coverage is gained or lost. Helps diagnose gaps from budget or rank and prioritize optimizations to grow exposure and efficiency.
Free
Google Ads Account Health cover image
Google Ads Account Health

Google Ads account health overview with spend trends, performance snapshots, and channel views for Search, Display, Video, Shopping, and App.

Google Ads account health template focused on fast diagnosis of performance and spend. Provides a daily spend trend, a performance snapshot, and an account performance overview to quickly spot shifts. Includes dedicated views for Search, Display, Video, Shopping, and App campaigns to compare channels. Useful for catching anomalies, pacing issues, and reporting wins in weekly reviews. A notes section helps capture insights and actions.
Free
Google Ads Budget Depletion Insights cover image
Google Ads Budget Depletion Insights

Daily and hourly Google Ads budget depletion insights to prevent budget‑limited downtime and optimize spend.

Google Ads Budget Depletion Insights focuses on spotting when campaign budgets run out and where spend is constrained. Daily and hourly summaries surface budget pacing and depletion patterns so you can reallocate budgets and protect performance. Ideal for monitoring budget‑limited campaigns and identifying the times of day when coverage drops. Not intended for Shopping campaigns.
Free
Google Ads Shopping Auction Insights cover image
Google Ads Shopping Auction Insights

Google Ads Shopping Auction Insights tracking for impression share, overlap, and outranking by day, campaign, ad group, and device.

Track Google Ads Shopping Auction Insights to benchmark Shopping campaign visibility against competitors. Monitor impression share, overlap rate, and outranking share to see who appears with you and who outranks you. Break down trends by day, campaign, ad group, and device to find where competitive pressure is strongest. Compare periods to flag gains or losses in visibility and competitiveness. Use insights to prioritize bids, budgets, and product coverage where share is slipping.
Free
Facebook Funnel Template cover image
Facebook Funnel Template

Funnel-focused Facebook Pages dashboard that measures reach, engagement, clicks, comments, and reactions by post.

Facebook Pages funnel analytics focused on how audiences move from seeing a post to engaging with it. Tracks post views, unique reach, and average views per person, then quantifies engagement rate across clicks, comments, and reactions. Breaks out click and comment rates plus the share each contributes to overall engagement. Includes a reactions breakdown (Like, Love, Haha, Wow, Anger, Sorry) and a performance-by-post view to spot drop‑offs and winning content. Built for social teams to optimize content and prove impact quickly.
Free
Facebook Ads Google Ads report template cover image
Facebook Ads Google Ads report template

Unified Facebook Ads + Google Ads template for tracking PPC metrics, blended spend, and ROI across channels.

Blends Facebook (Meta) Ads and Google Ads into one PPC performance view in Looker Studio. Track CTR, CPC, conversions, CPA, ROAS, impressions, and spend with comparisons by campaign, ad group/ad set, device, location, and demographics. See blended ad spend and daily results to compare channels, spot trends, and shift budgets with confidence. Ideal for marketers and agencies needing quick cross-platform insights and ROI tracking.
Free
Free Facebook Ads Funnel Dashboard Template for Looker Studio cover image
Free Facebook Ads Funnel Dashboard Template for Looker Studio

Funnel-focused Looker Studio template for Facebook Ads that tracks spend, ROAS, CTR, and stages from impressions to payments to boost performance.

Facebook Ads Funnel Dashboard for Looker Studio visualizes your Meta/Facebook Ads performance across the funnel—from impressions and reach to add-to-wishlist, add-to-cart, payments, and conversions. It surfaces spend, ROAS, and CTR trends so you can pinpoint which campaigns and audiences drive purchases. Clear charts reveal bottlenecks by stage, helping you reallocate budget and refine creatives for higher efficiency. Ideal for e‑commerce and performance teams aiming to grow revenue while cutting wasted ad spend.
Free
CallRail call tracking dashboard cover image
CallRail call tracking dashboard

CallRail analytics covering call and lead trends, timing patterns, sources, and agent answer performance.

CallRail performance tracking focused on calls, leads, and answer quality. Monitor month‑over‑month trends for calls vs. leads and answer rate vs. lead rate. Identify peak times with calls by day of week and hour and see how many are first‑time callers. Attribute conversions with a breakdown by traffic source. Evaluate team responsiveness with answer rates by agent email to optimize campaigns and staffing.
Free
Calendly event dashboard cover image
Calendly event dashboard

Team-wide Calendly analytics for event volume, duration, status, and peak time slots by user and team.

Calendly analytics focused on team performance and scheduling efficiency. Tracks total users, event volume, and event duration with views by user, team, and week. Highlights active vs. canceled status and calendar type, plus most popular time slots to spot peak demand. Includes heatmaps and bar charts for events and duration by user to balance workloads and identify top performers. Ideal for understanding meeting load and optimizing availability across teams.
Free
Free Adobe Analytics Dashboard Template on Looker Studio cover image
Free Adobe Analytics Dashboard Template on Looker Studio

Adobe Analytics KPIs in Looker Studio with conversion funnel, segments, engagement, speed, and revenue tracking.

Adobe Analytics data visualized in Looker Studio to track website performance, customer behavior, and marketing outcomes. Covers core KPIs including unique visitors, pageviews, time on site, bounce rate, page load time, revenue, units, and orders. Features a conversion funnel from visits to cart additions to orders, plus segment-level views with entries and bounce rate. Includes time-series charts for engagement and revenue to spot trends and campaign impact. Helps identify bottlenecks and high-value segments to optimize content, UX, and acquisition channels.
Free
Google Search Console - Query Insight cover image
Google Search Console - Query Insight

Keyword and query performance from Google Search Console with trends, day‑of‑week, search type, and country insights to guide SEO.

Google Search Console – Query Insight focuses on the keywords that drive your organic traffic, highlighting impressions, clicks, CTR, and average position with clear trends. See which queries win or lag, compare performance by day of week, and track changes over time to spot opportunities. Break down results by search type (web, image, video, news) to refine content strategy. Country maps surface where you’re gaining visibility and engagement so you can target high‑potential markets. Ideal for quickly prioritizing SEO actions based on real user search behavior.
Free
Looker Studio Google Business Profile Dashboard Template cover image
Looker Studio Google Business Profile Dashboard Template

Track Google My Business visibility and customer actions—impressions, calls, messages, bookings, directions, website clicks, and location performance—in Looker Studio.

Monitor how customers discover and interact with your business on Google Search and Maps. View trends for impressions, reviews, calls, messages, bookings, direction requests, and website clicks, with breakouts by device (desktop vs mobile) and search type. Drill into location-level performance to spot high- and low-performing listings and timing patterns. Use the insights to improve local visibility, respond to demand faster, and drive more visits and calls.
Free
SEM report template cover image
SEM report template

SEM/Google Ads template that pinpoints PPC ROI with KPIs, cost insights, and campaign comparisons across devices and locations.

An SEM/Google Ads performance template built to track PPC efficiency and ROI across campaigns, ad groups, keywords, devices, and locations. Highlights core metrics such as impressions, clicks, ad spend, CTR, CPC, CPM, conversions, and ROAS to surface what’s working and what’s wasting budget. Provides KPI and cost overviews plus campaign-level comparisons to uncover high-ROI campaigns, weak segments, and optimization opportunities. Ideal for paid media teams and agencies needing quick, actionable insights from Google Ads data.
Free
Google Search Console report template for Looker Studio cover image
Google Search Console report template for Looker Studio

Google Search Console SEO dashboard that monitors clicks, impressions, CTR, and positions by queries, pages, countries, devices, and search appearance.

Google Search Console SEO dashboard for Looker Studio that tracks clicks, impressions, CTR, and average position over time. Break down performance by queries, pages, countries, and devices to find winning keywords and fix underperforming content. Evaluate the impact of search appearance features (like rich results) on visibility and CTR. Turn these insights into targeted content and technical SEO improvements that drive organic growth.
Free
X Ads Twitter dashboard template cover image
X Ads Twitter dashboard template

Monitor X Ads (Twitter) performance across CTR, CPC/CPM, conversions, CPA, top campaigns, and platform breakdowns.

X Ads (Twitter) Overview tracks paid social performance with clear views of impressions, clicks, CTR, and spend. Monitor conversion rate, CPC, CPM, and CPA to understand efficiency and ROI. Compare top campaigns to quickly see what’s working and what isn’t. Break down results by platform to pinpoint where clicks, cost, and conversions come from. Built for marketers and decision‑makers who need fast, actionable insight into X Ads performance.
Free
TikTok Ads Overview cover image
TikTok Ads Overview

Monthly TikTok Ads overview highlighting spend, efficiency metrics, top 10 campaigns, and country/objective breakdowns.

Monthly TikTok Ads performance summary focused on a rolling 30‑day period. Tracks spend, impressions, CPM, clicks, CTR, CPC, results, result rate, and cost per result to gauge efficiency. Surfaces the top 10 high‑performing ads and campaigns with a clear table of results and costs. Adds geographic insight with a country breakdown and compares metrics by campaign objective to reveal where conversions and costs differ. Built to quickly spot winning campaigns and redirect budget to what works.
Free
TikTok Ads Overview - Campaign and audience info cover image
TikTok Ads Overview - Campaign and audience info

End-to-end TikTok Ads analytics covering campaign performance, costs, and audience demographics.

Get a complete view of TikTok ad campaigns and audience impact across any date range. Track spend, clicks, CPM, conversions, and cost per conversion with scorecards, time series, and a detailed campaign table covering name, type, objective, status, creation date, budget, and amount spent. Compare cost distribution by campaign objective and monitor performance trends over time. Break down impressions by country, gender, age group, device, and ad name to see where reach and results come from.
Free
Tiktok Ads Budget Report cover image
Tiktok Ads Budget Report

A TikTok Ads budget tracker with spend, revenue, ROAS, and breakdowns by objective, campaign, ad set, and day of week.

Track TikTok Ads budget, revenue, and ROAS to keep spend on target and protect profit. Visualize trends over time and by day of week to spot pacing and seasonality. Drill into objective, campaign, and ad set to find what converts and shift budget to top performers. A budget manager and objective summary put the key KPIs front and center. Connects to live TikTok Ads data via Catchr for up‑to‑date numbers.
Free
StackAdapt report cover image
StackAdapt report

StackAdapt campaign performance dashboard covering CTR, conversions, CPC/CPM, ROAS, and top campaigns.

StackAdapt advertising performance template focused on analyzing programmatic campaigns. Tracks CTR and impressions alongside clicks, conversions, conversion rate, and cost per conversion. Highlights CPC and CPM with total spend to monitor efficiency. Surfaces ROAS and top campaigns plus a clicks breakdown by campaign type for quick optimization priorities.
Free
Spotify Ads overview performance dashboard cover image
Spotify Ads overview performance dashboard

Analyze Spotify Ads with trends, country spend, platform split, and campaign details.

Looker Studio template for Spotify Ads performance tracking. Visualizes performance trends over time, spend by country, platform split, and campaign-level details. Highlights where budget goes and which geographies or platforms drive results. Helps marketers quickly spot spikes, compare campaigns, and optimize spend. Built with a clean Supermetrics layout for fast insight discovery.
Free
Snapchat Ads - 32 Days Performance Overview cover image
Snapchat Ads - 32 Days Performance Overview

Snapchat Ads 32‑day performance overview with KPIs, trends, geo and demographic breakdowns, plus top campaigns and ads.

A focused Snapchat Ads Looker Studio template for tracking the last 32 days of performance across purchases, swipes, impressions, swipe‑up rate, eCPV, and eCPM. Visualizes impressions and video views over time to spot trends. Breaks down reach by country, gender, and age for quick audience insights. Surfaces top campaigns and top ads with key engagement and conversion signals to pinpoint winners. Ideal for fast optimization and client reporting on Snap Ads.
Free
Snapchat overview performance dashboard cover image
Snapchat overview performance dashboard

Snapchat Ads dashboard for tracking impressions, video views, demographics, and top-performing campaigns/ads.

Snapchat Marketing analytics template focused on Snapchat Ads performance. Tracks totals, impressions, and video views over time, with breakdowns by country, age, and gender. Highlights top campaigns and top ads to surface what’s driving reach and engagement. Helps marketers refine targeting, compare creatives, and reallocate spend based on winners.
Free
Looker Studio Shopify Dashboard Template cover image
Looker Studio Shopify Dashboard Template

Shopify Looker Studio template tracking sales, customers, products, and inventory to spotlight revenue drivers.

Shopify performance template for Looker Studio that consolidates sales, orders, AOV, and distinct customer metrics in one view. Surfaces top customers and best‑selling products, with breakdowns by vendor, product, and variant to reveal revenue drivers. Includes dedicated customers and inventory views to help plan promotions, retention, and stocking. Ideal for quickly understanding store health and spotting growth opportunities. Powered by the Windsor.ai Shopify connector for data integration.
Free
Template Pinterest Overview V2 cover image
Template Pinterest Overview V2

Pinterest Ads dashboard to monitor spend, video engagement, conversions, and revenue in one place.

Pinterest Ads performance template focused on measuring delivery, engagement, and outcomes across campaigns. Track investment, video views, cost per view (including 100% views), average watch time, clicks by campaign, and weekly performance to understand what’s driving results. Breakdowns across three pages—Diffusion, Video Views, and Results—highlight how widely ads were served, how deeply they were watched, and how well they converted into revenue. Ideal for quickly spotting winning creatives and optimizing spend with real-time Pinterest Ads KPIs.
Free
Klaviyo Looker Studio Dashboard cover image
Klaviyo Looker Studio Dashboard

Klaviyo email analytics in Looker Studio covering engagement, subscriber trends, and revenue impact for e‑commerce.

Klaviyo email marketing analytics for e‑commerce teams, built in Looker Studio to link campaign activity to revenue. Tracks sends, deliveries, opens, clicks, click‑through rate, unsubscribes, and subscriber growth trends. Highlights best and worst campaigns with time‑series views of engagement. Connects email performance to sales with revenue, orders, conversion rate, and average order value. Helps pinpoint what drives conversions and where to optimize targeting, content, and cadence.
Free
Orders Report cover image
Orders Report

Order performance dashboard with KPIs, geographic and category breakdowns, and year/month trends.

Order analytics focused on tracking demand and fulfillment across customers, regions, and product categories. Key KPIs spotlight total orders, customers, states served, and active segments for quick health checks. Visual breakdowns reveal which regions, cities, segments, and categories drive the most orders. Yearly and monthly trend lines surface growth and seasonality to guide planning. Detail tables list recent orders and state-level quantities to support prioritization and follow‑up.
Free
Order Report cover image
Order Report

Orders analytics template tracking totals, trends, and top performers across regions, categories, segments, and cities.

Orders Report template focused on sales performance across regions, categories, segments, and cities. Highlights core KPIs such as total orders, number of customers, and geographic coverage, with trends by year and month. Visuals rank top states, customers, and orders by quantity to surface best performers and opportunities. Ideal for spotting seasonal peaks, regional demand shifts, and product category contribution in a clean dark theme.
Free
SEO report template cover image
SEO report template

SEO Looker Studio template that visualizes Google Search Console metrics—queries, pages, CTR, position, and trends by country and device.

SEO performance template focused on Google Search Console data to track impressions, clicks, CTR, average position, and top queries and pages. Break down results by country and device to spot growth opportunities and content gaps, and blend data to relate traffic with conversions and goals. Identify winning keywords, declining pages, and the impact of mobile vs. desktop on engagement. Includes white‑label styling, custom charts, historical trends, filters, and optional email alerts for stakeholders.
Free
Facebook Ads Brand Awareness Template cover image
Facebook Ads Brand Awareness Template

Track Facebook/Instagram brand awareness with impressions, clicks, spend, branded metrics, and branded search lift in Looker Studio.

A Looker Studio template for tracking Facebook and Instagram brand awareness in one place. Monitor core KPIs—ad impressions, clicks, spend, branded impressions, and branded clicks—with weekly trends. Link ad activity to outcomes by comparing spend with branded engagement to judge ROI on awareness campaigns. Adds branded search context from Google Search Console to show how ads influence search interest. Built for marketers and agencies who need a clear view of brand reach and lift across Meta ads.
Free
Google Merchant Center Template cover image
Google Merchant Center Template

Monitor Google Merchant Center performance, product issues, trends, and top products in Looker Studio.

Google Merchant Center performance and feed health at a glance for ecommerce teams. Track impressions and clicks, surface item-level issues, and spot trends over time to fix problems fast. Compare performance by product category and highlight best-performing products to guide inventory and bidding decisions. Includes dedicated views for products, issues, and competitive analysis to keep your catalog compliant and profitable. Built to pull real-time GMC metrics and dimensions into Looker Studio for clear, actionable insights.
Free
GA4Datatform - Free Template Sample - Report with session-scoped data cover image
GA4Datatform - Free Template Sample - Report with session-scoped data

Session-scoped GA4 dashboard tracking sale orders, engagement, and sessions with channel and device insights.

GA4Dataform Cockpit centers on session-scoped GA4 data to assess ecommerce and acquisition performance. It highlights Sale Orders, Engagement Rate, and Sessions with trendlines plus period and year-over-year comparisons. Breakdowns by Channels & Traffic Sources and Device Categories reveal where traffic and orders originate and how engagement shifts by source. Additional views for countries and channel details help pinpoint growth opportunities and optimize marketing spend.
Free
Looker Studio Google Analytics 4 Dashboard Template cover image
Looker Studio Google Analytics 4 Dashboard Template

GA4 Looker Studio template to analyze users, traffic sources, landing pages, and conversions for faster growth decisions.

Google Analytics 4 Looker Studio template for tracking website performance, engagement, and conversions in one view. Monitor key GA4 metrics like users, sessions, page views, views per session, conversions, and conversion rate, plus device and country breakdowns. Explore dedicated pages for Visitors, Landing Pages, Acquisition, and Conversions to find top-performing content, channels, and campaigns. Ideal for marketers and analysts who need fast insights to optimize traffic, campaigns, and conversion funnels.
Free