

€199
€399
Lifetime


 support)
By proceeding with your purchase, you acknowledge that you have read and agree to our Template License Agreement.
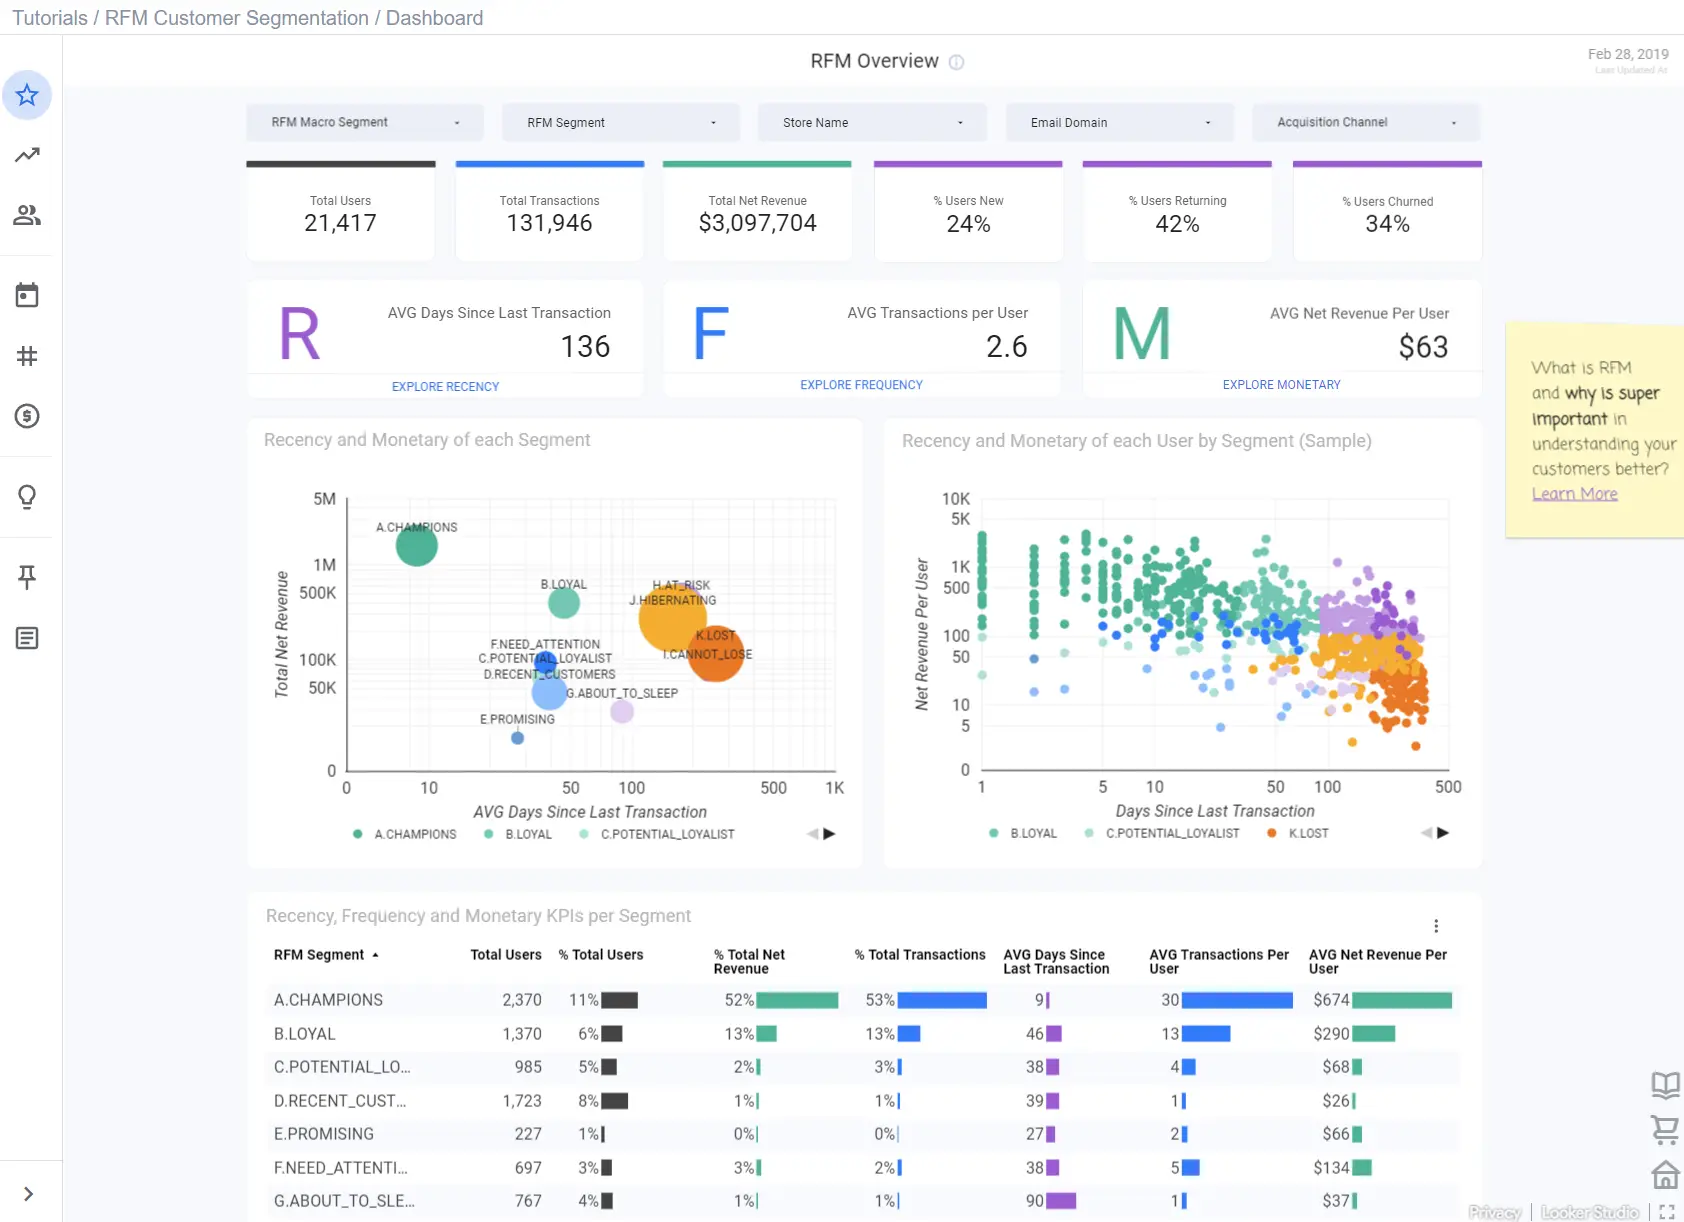
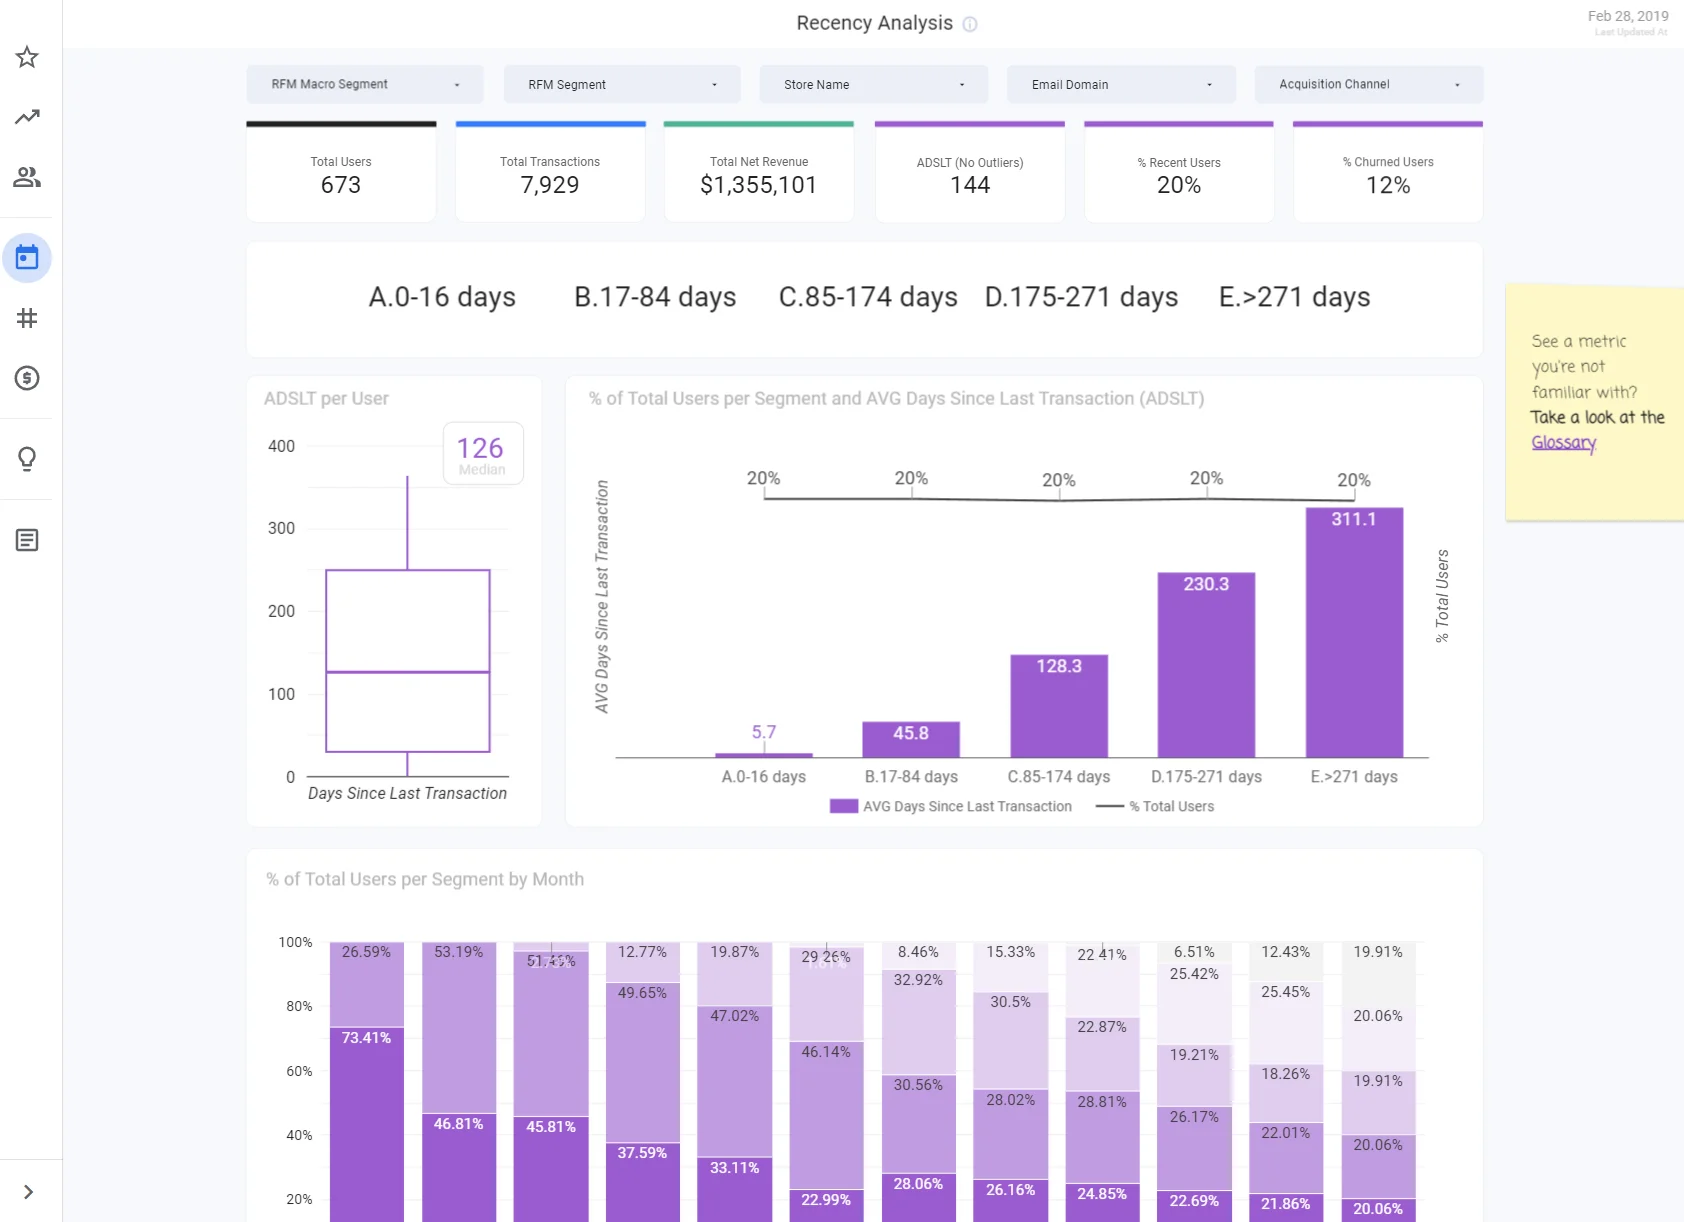
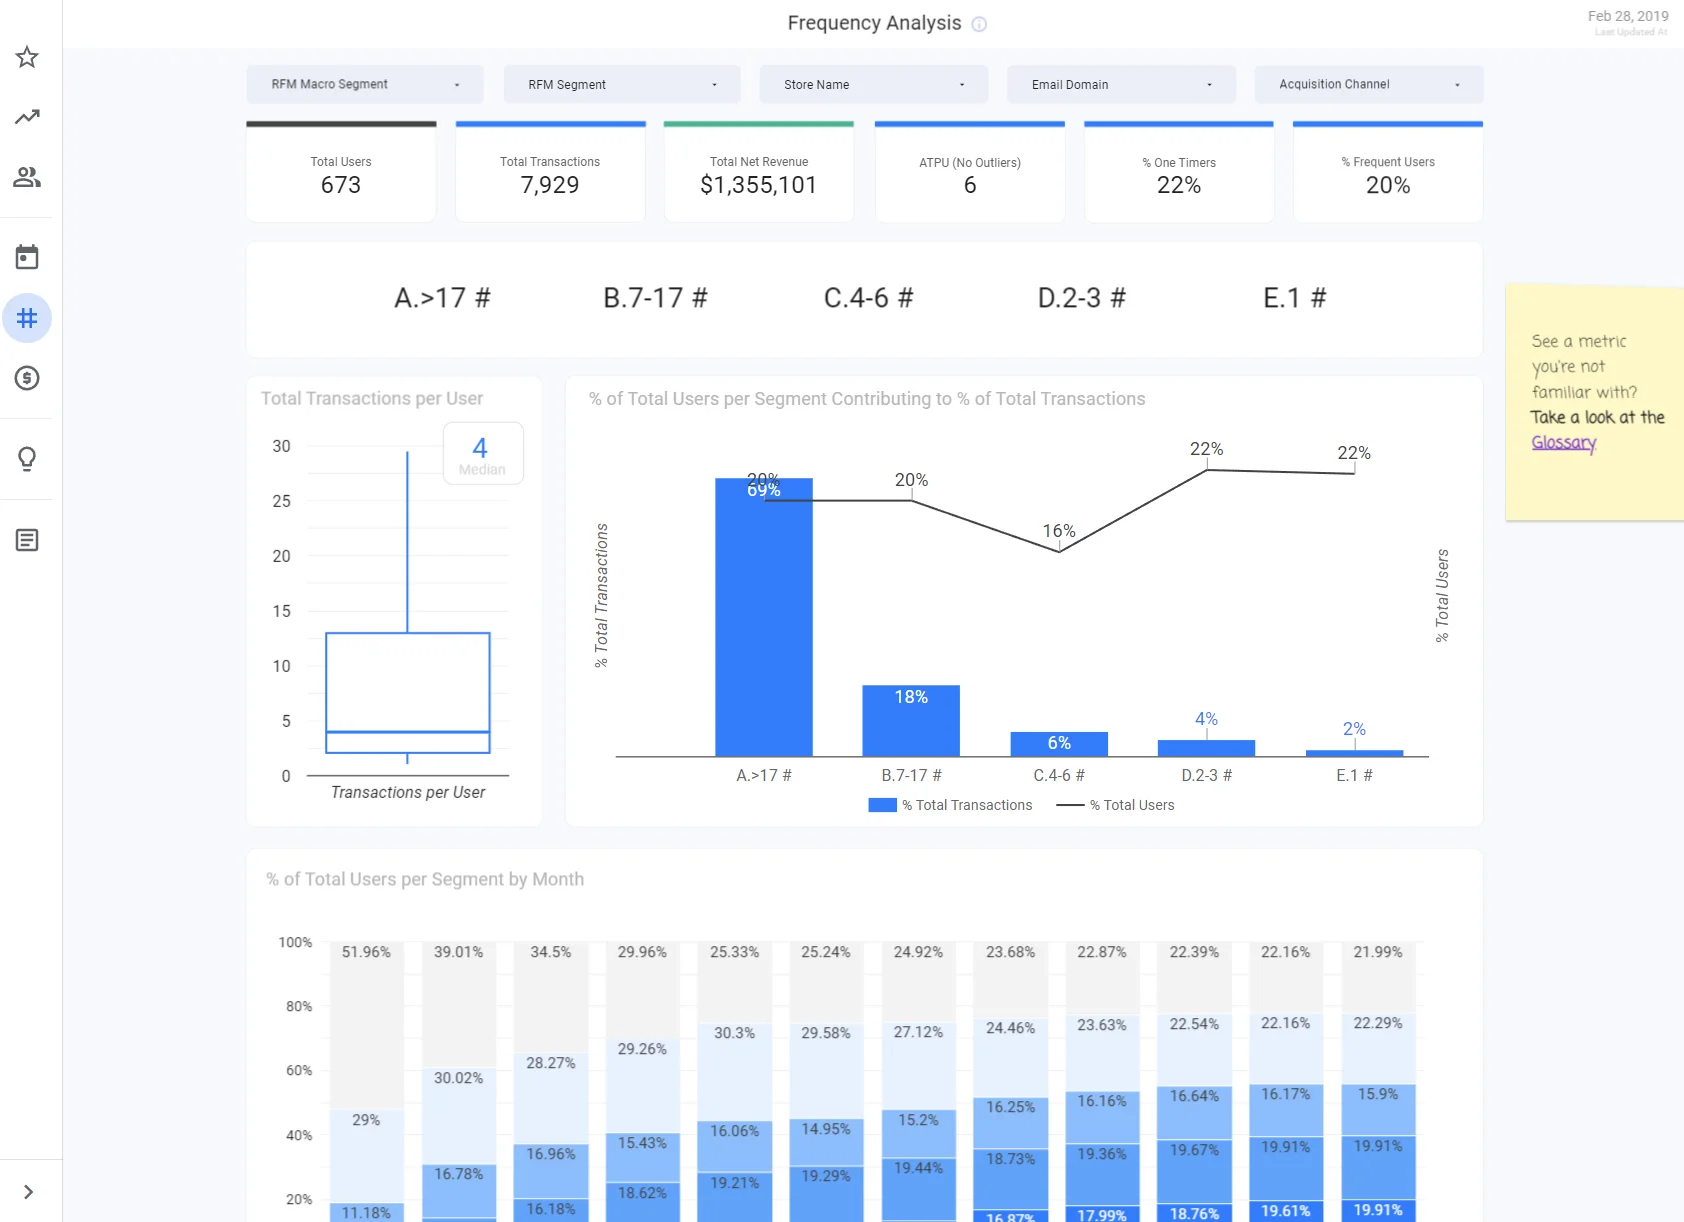
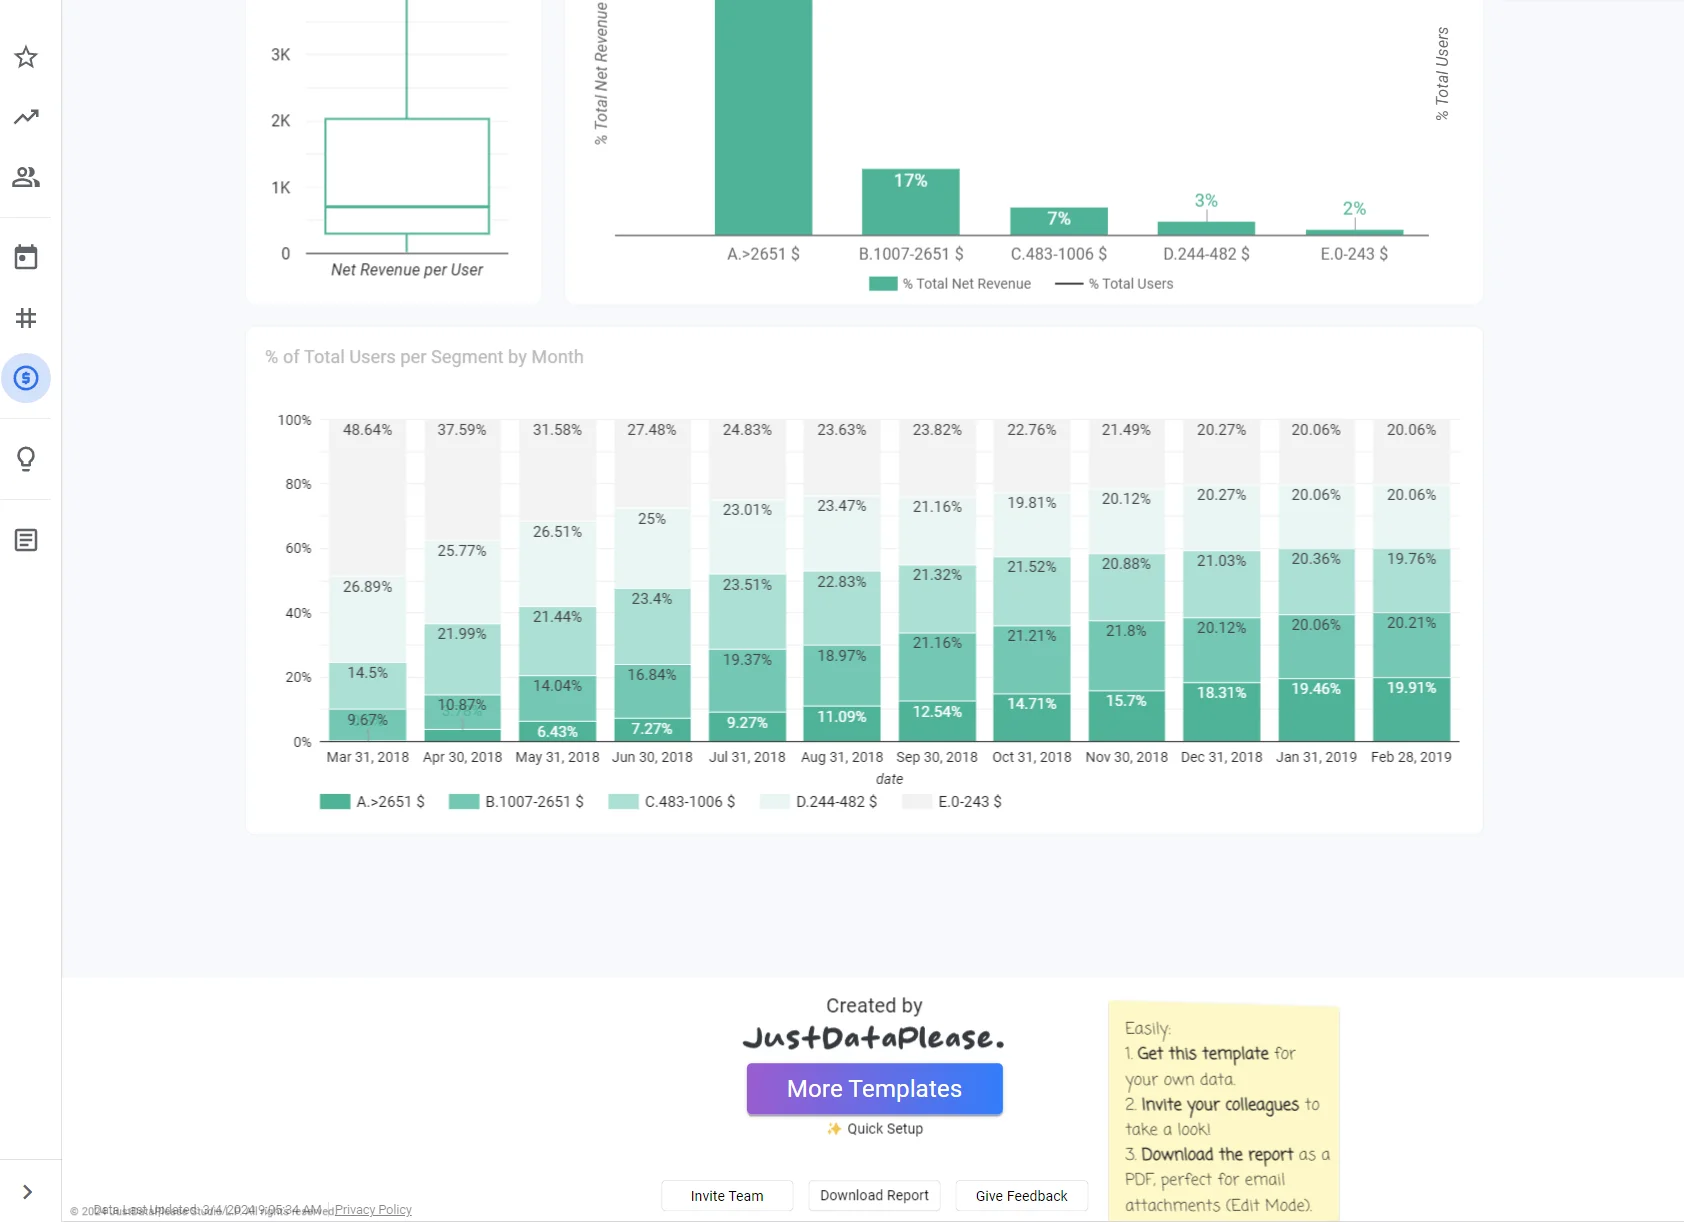
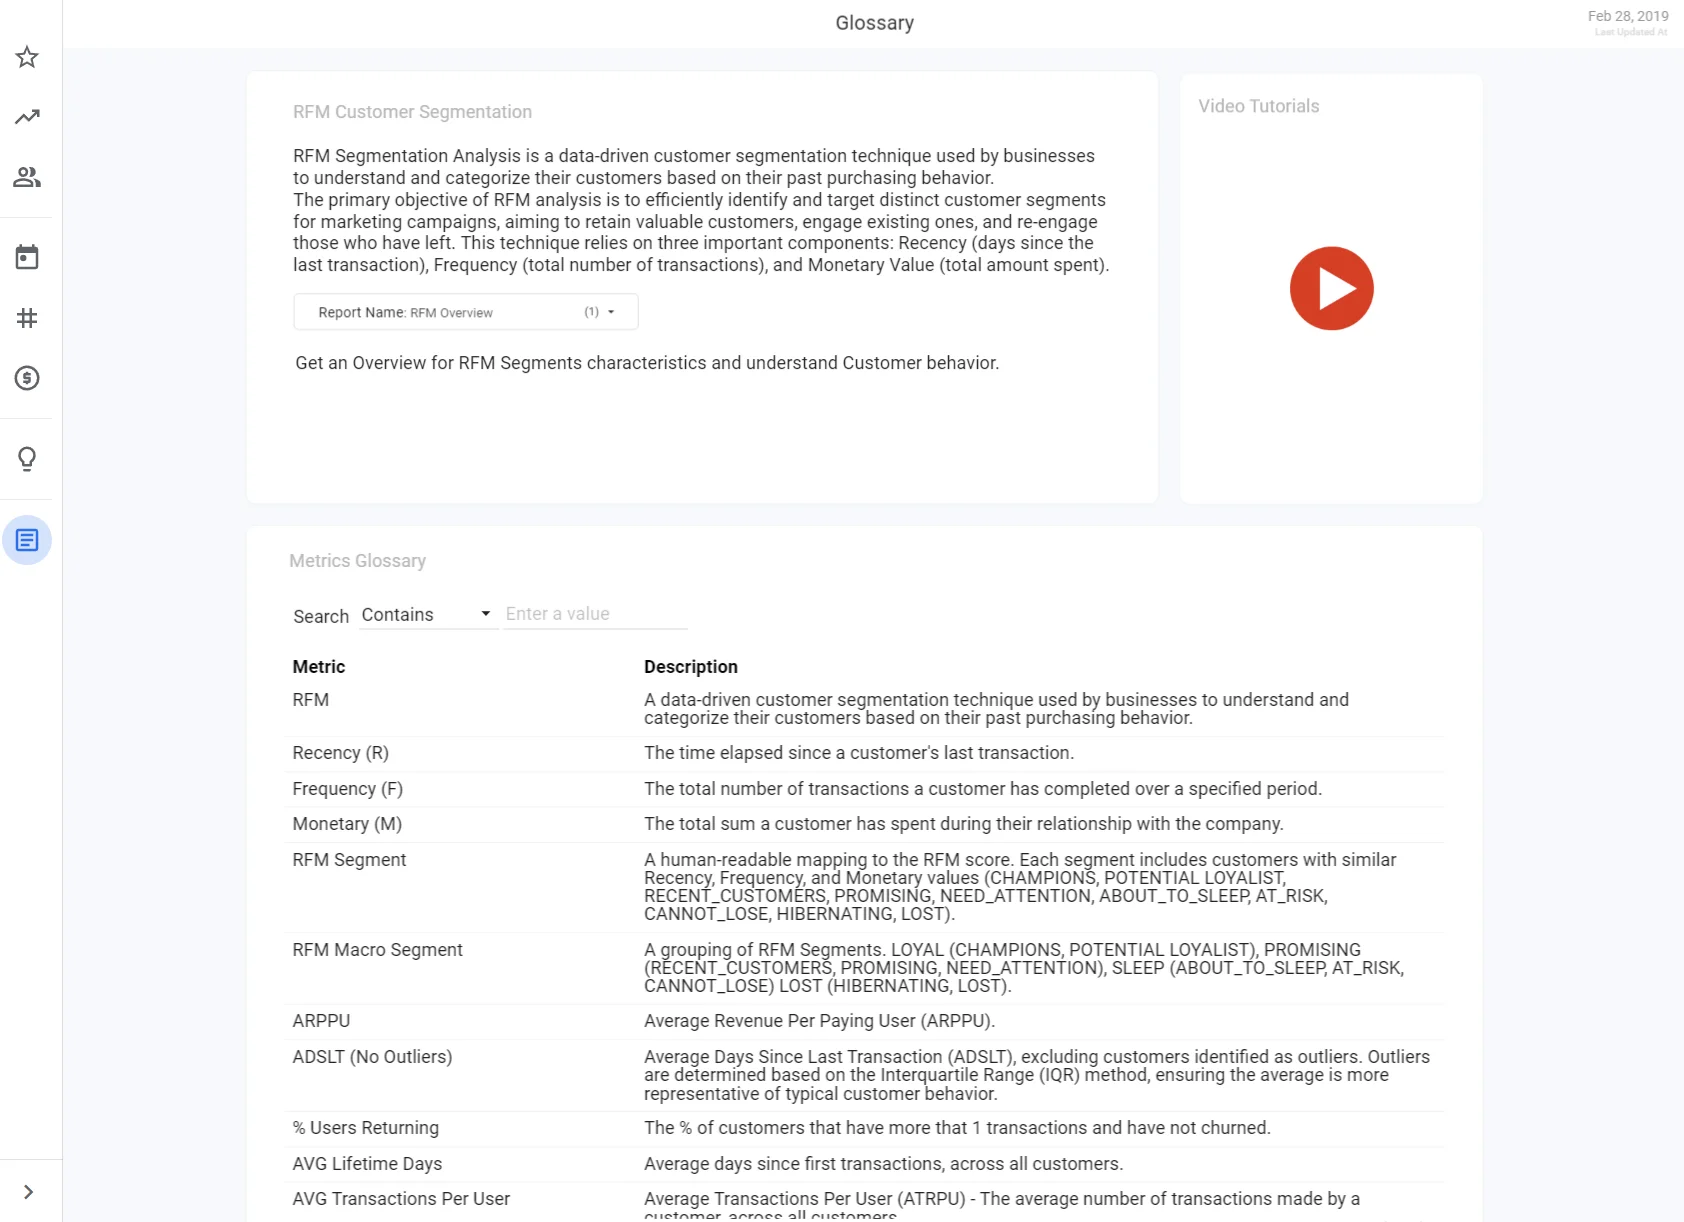
RFM Segmentation Analysis is a data-driven customer segmentation technique used by businesses to understand and categorize their customers based on their past purchasing behavior.
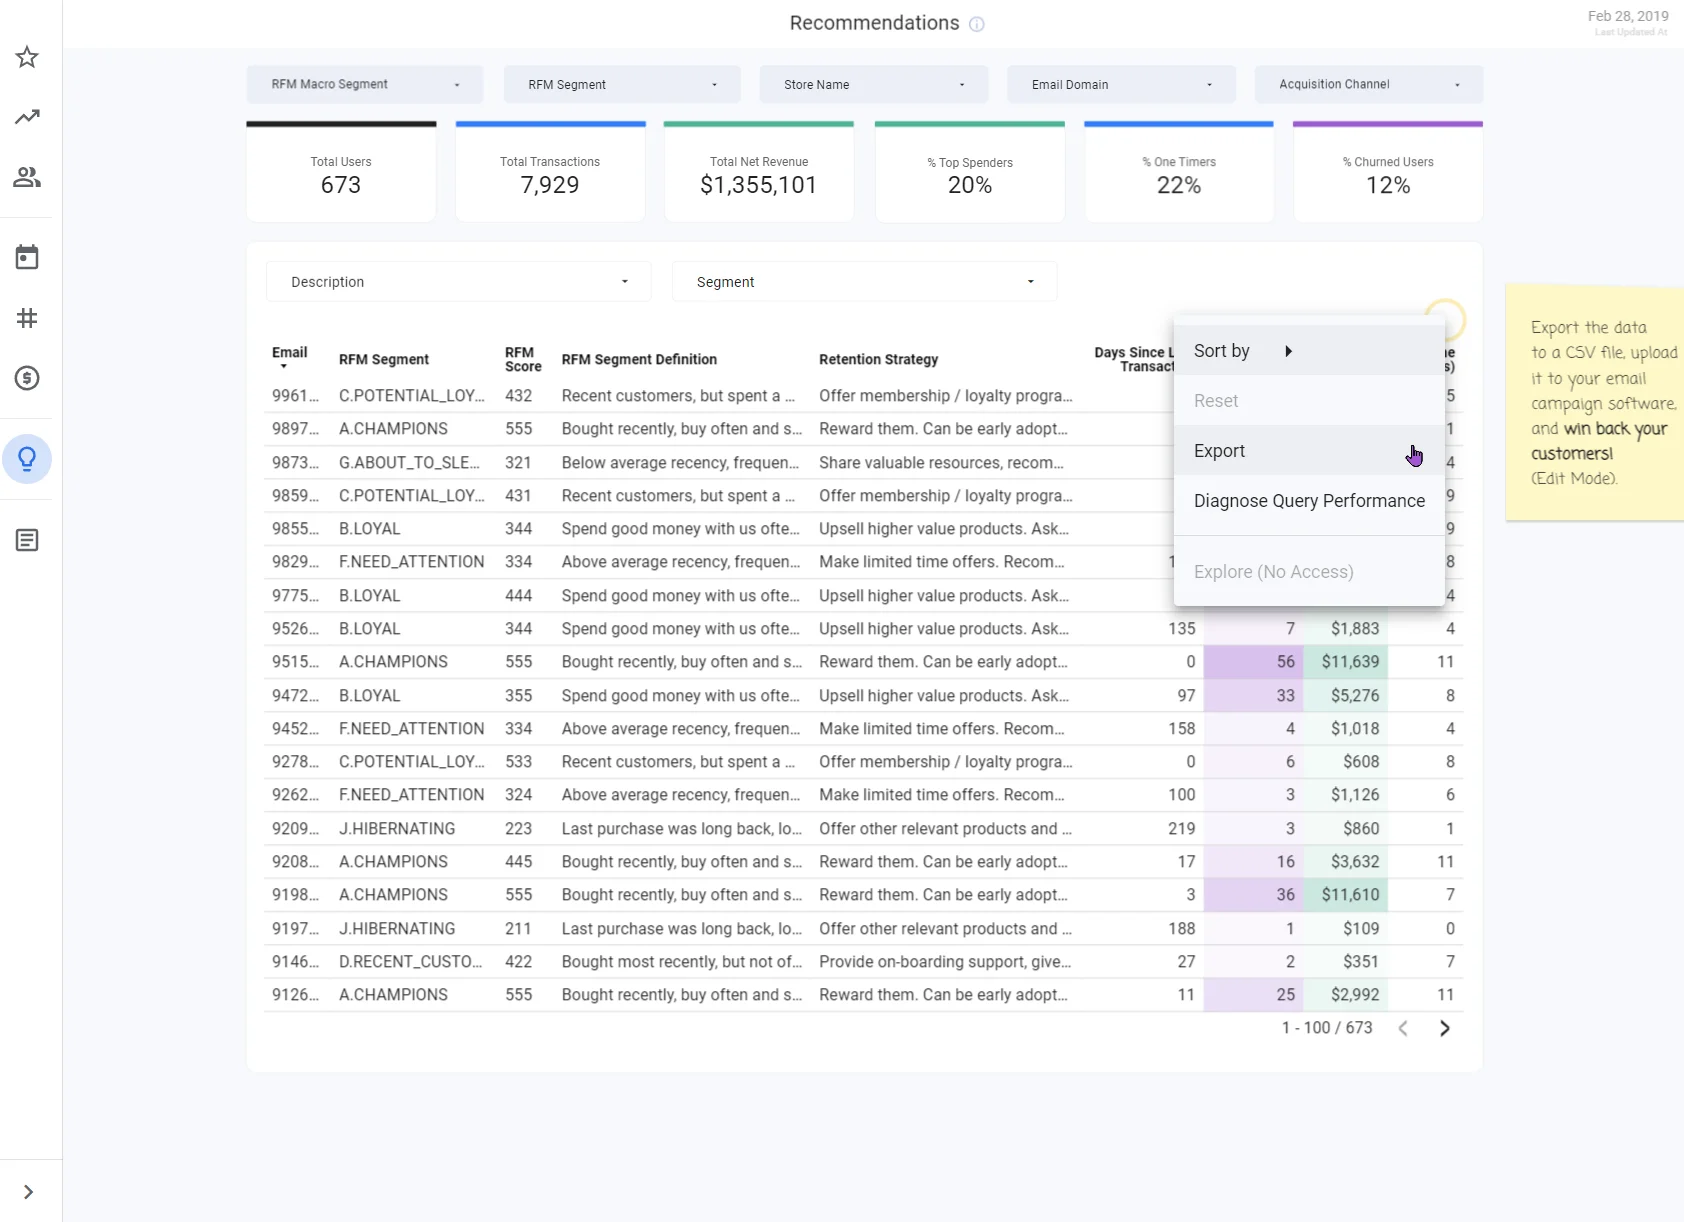
The primary objective of RFM analysis is to efficiently identify and target distinct customer segments for marketing campaigns, aiming to retain valuable customers, engage existing ones, and re-engage those who have left.
This technique relies on three important components: Recency (days since the last transaction), Frequency (total number of transactions), and Monetary Value (total amount spent).
This Template is designed exclusively for Google BigQuery and Looker Studio.
For this professional-grade level of analysis, you will need to preprocess your data. To accomplish this, you will have to create some views or tables in your BigQuery.
QueryBuilder generates complex queries for you easily by just mapping your database schema.
This way, you do not need any prior experience, and you ensure that access to your data is not shared with anyone but yourself.
🡒 You gain access to our resources such as Template Google Sheet and 1click report generator for 7 days from the date of purchase, subject to fair use as outlined in the Templates License Agreement.
Edit access to Google BigQuery Console for executing SQL statements.
| SKU | RFM-CSG-CRM-AUT-BQ-LS-TEM |
| Slug | rfm-customer-segmentation-crm-bq-ls-template |
| Product Type | Templates |
| Category | Customer Segmentation |
| Tags | RFM, Customer Segmentation |
| Audience | eCommerce, Agencies |
| Business Type | Repeat Retail, Subscription Based |
| Setup Time | 10' |
| Setup Difficulty | 2 | Minor technical knowledge needed — Run SQL Queries |
| Tech Used | CRM - Google BigQuery - Looker Studio |

This guide provides instructions on how to perform professional-grade RFM Customer Segmentation analysis in Looker Studio, for data stored in Google BigQuery.
To generate your report, you will need to prepare your data by creating some views or tables in BigQuery.
No SQL knowledge is required—just access to BigQuery where your data is stored to run the SQL provided in Query Builder.
A. Open your Google BigQuery Console here.
B. Visit the Query Builder and succesfully complete all the steps to prepare your data.
Note 1 : To generate SQL statements, you will need to provide your Dataset ID. Please make a note of it because you will need it in Step 2.
If you do not know how to find your Dataset ID, please read here.
To automatically create your own copy of the report in 1-click, follow the steps below.
A. Enter your BigQuery Dataset ID in the input box and click the Generate report button, located at the end of this page.
B. After being redirected to the report, click the Edit & Share button to review the data sources that are linked to the Report.
The button is located on the top navbar, on the right. If you do not see it, you will need to hover over the top navbar.
C. Finally click the Acknowledge and Save button.
You have now generated your own copy of the report and is saved to your Looker Studio account. You have full access and control over it.
If you choose to create views in your database in Step 1 then then the report will automatically update when the database updates.
If you choose to create tables in your database in Step 1 then you will need to rerun or schedule the SQL generated in Step 1.
Note 1 : You only have access to the copy of the report.
Note 2 : We do not have access to your data.
I got this template working in a few clicks and in no time at all (to be accurate, in 15 minutes)! I could not imagine that something as complicated as RFM Historical could be so easy to implement. The design is so clean and straightforward, which helps a lot in figuring out what needs to be done. I definitely recommend it to anyone, and I can't wait to see what will come up next!
Find most common questions from our users. If you can't find yours, contact us!