Looker Studio Report Gallery

The best free & paid Looker Studio templates, curated and quality-ranked for data reporting.

Showing 361 - 400 of 552

Facebook Ads overview and Ad analysis cover image
Facebook Ads overview and Ad analysis

Facebook Ads performance and ad set analysis in Looker Studio with KPIs, cost efficiency, and best/worst performer insights.

Facebook Ads performance tracking in Looker Studio with a clear overview and deep ad analysis. Compare impressions, reach, and spend to understand cost versus visibility. Measure clicks, leads, conversions, and spend with visual trends like clicks versus amount spent. Monitor efficiency using CPM, CPC, and CTR to spot what’s driving results. Evaluate ad sets by spend, landing page views, action values, frequency, clicks, impressions, and reach to quickly identify top and underperformers.
Free
Instagram Ads Overview cover image
Instagram Ads Overview

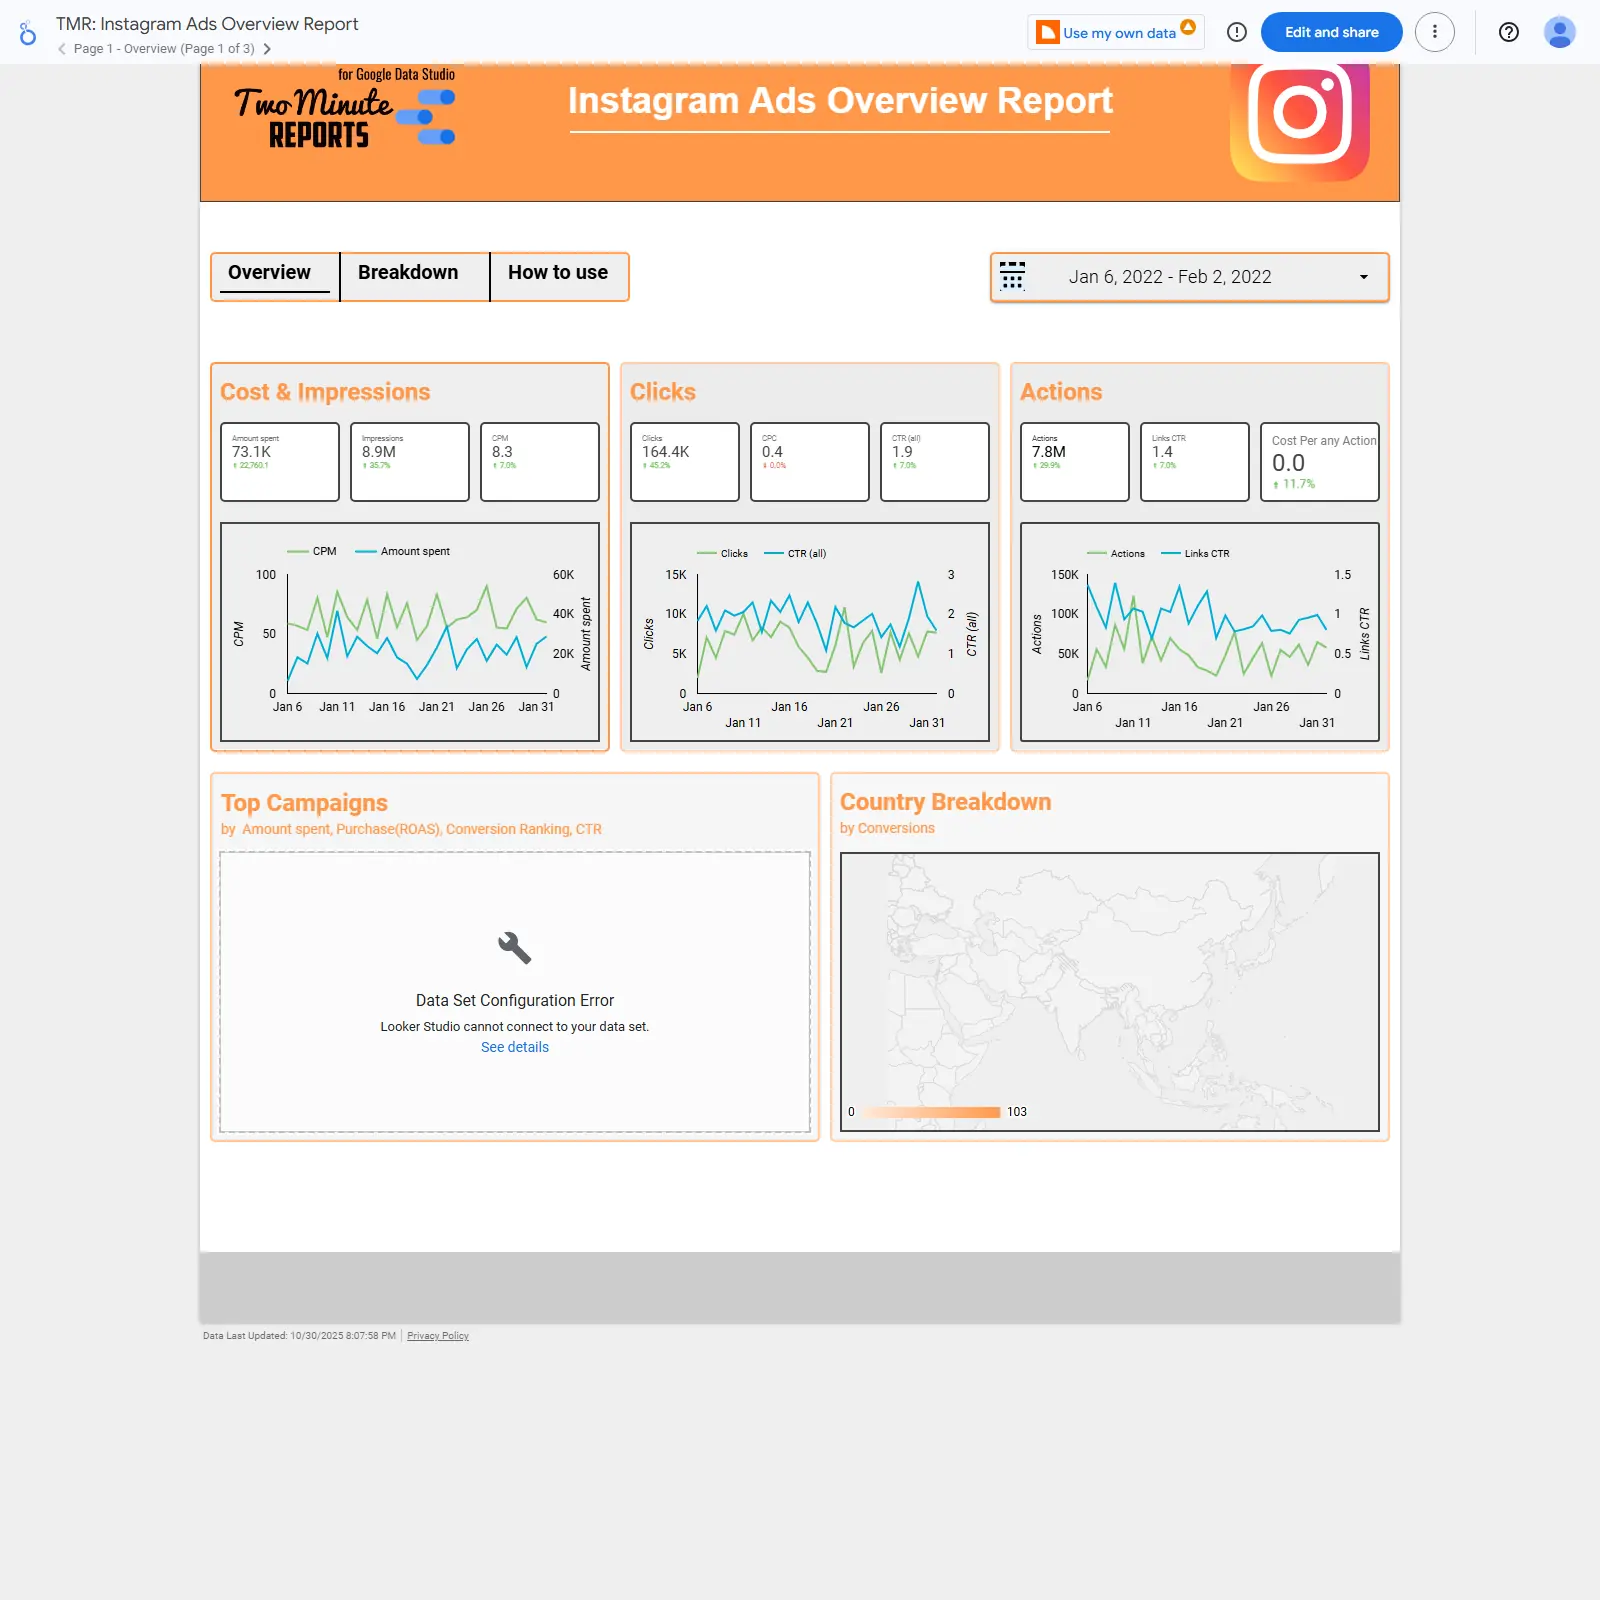
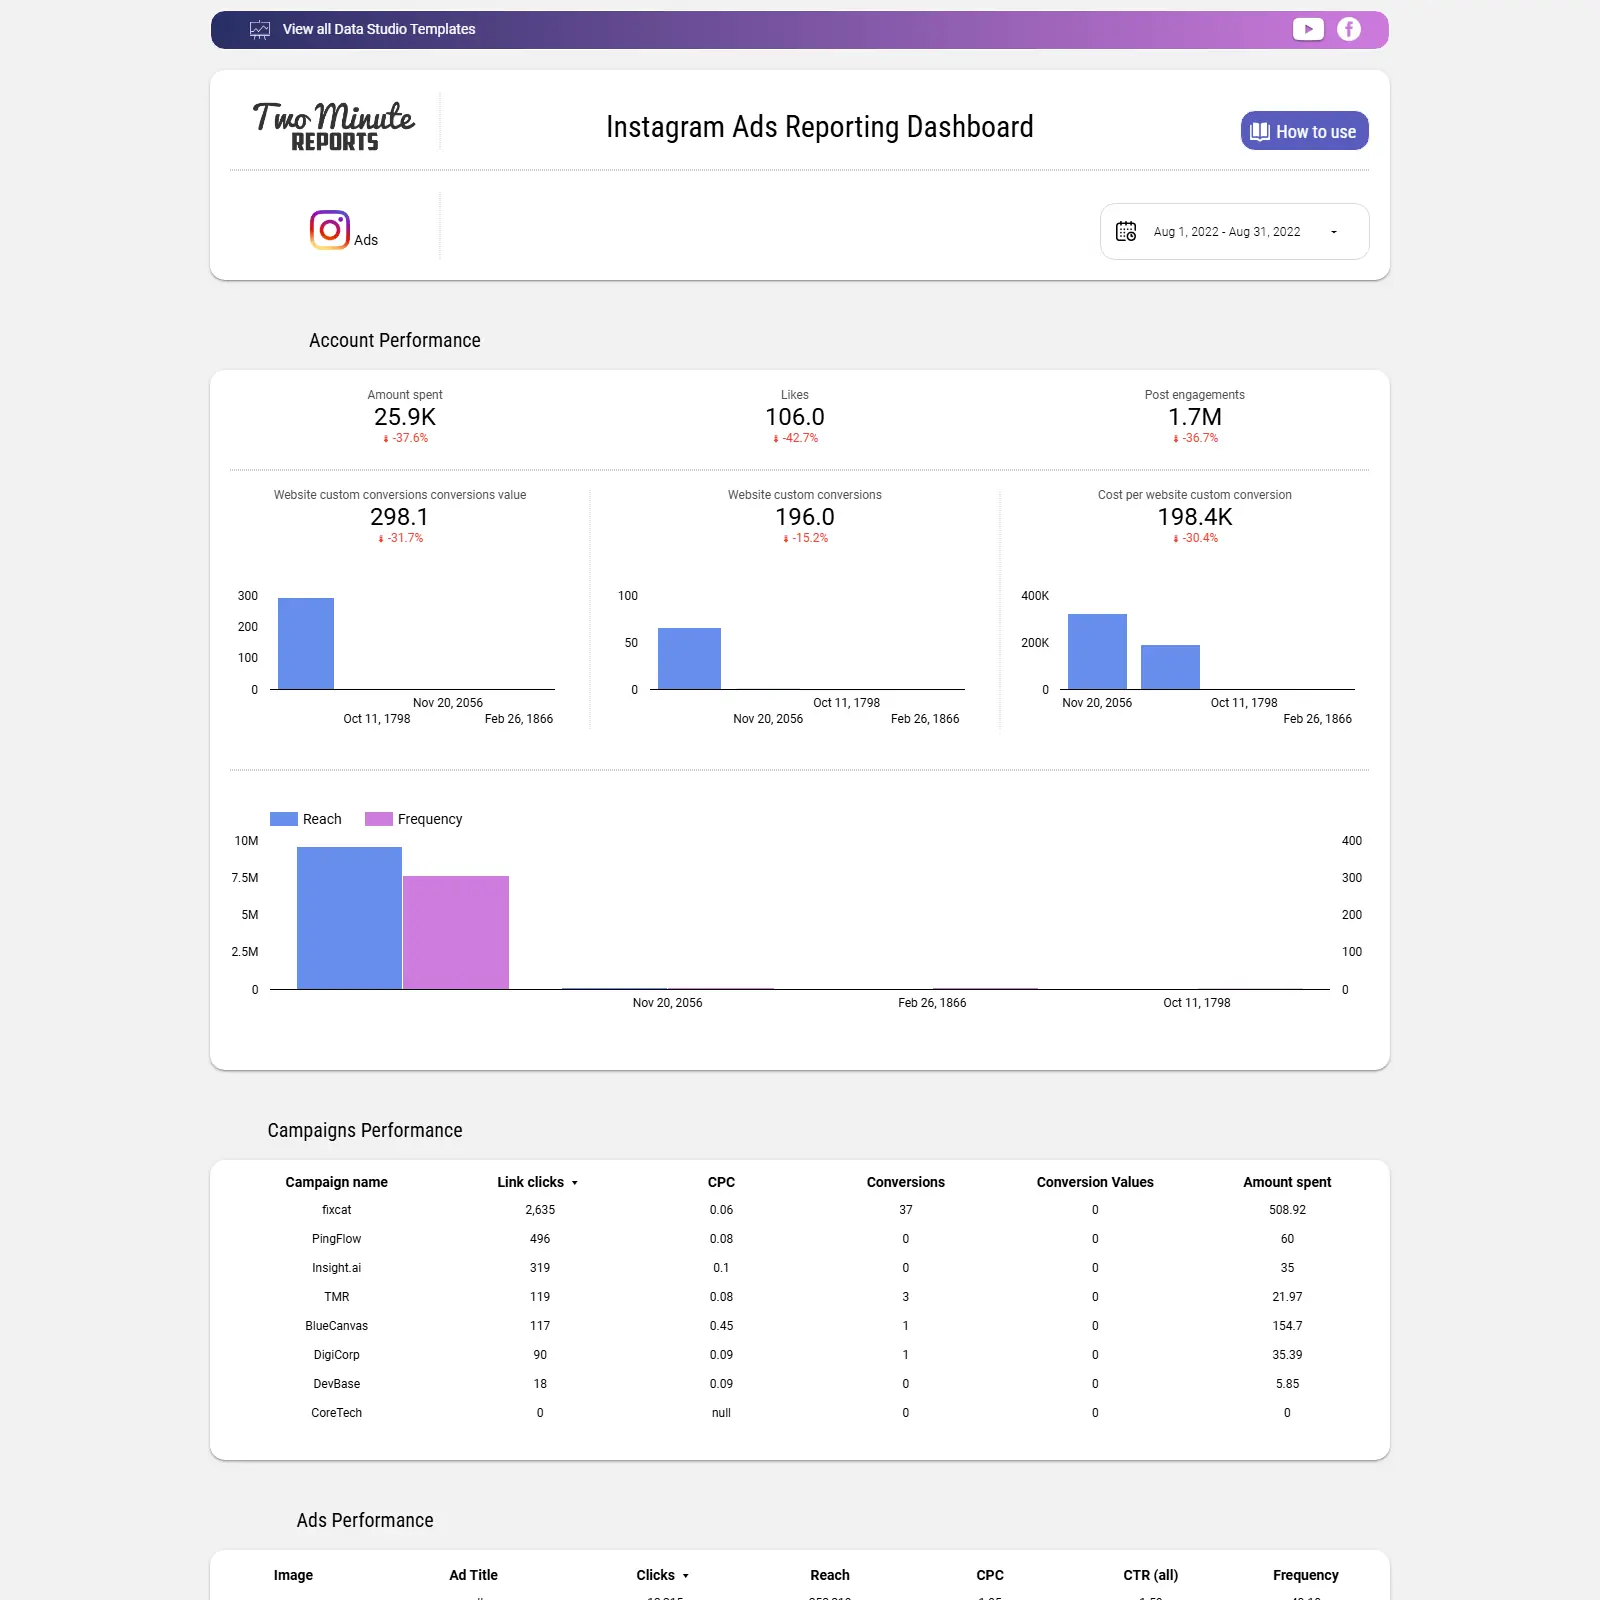
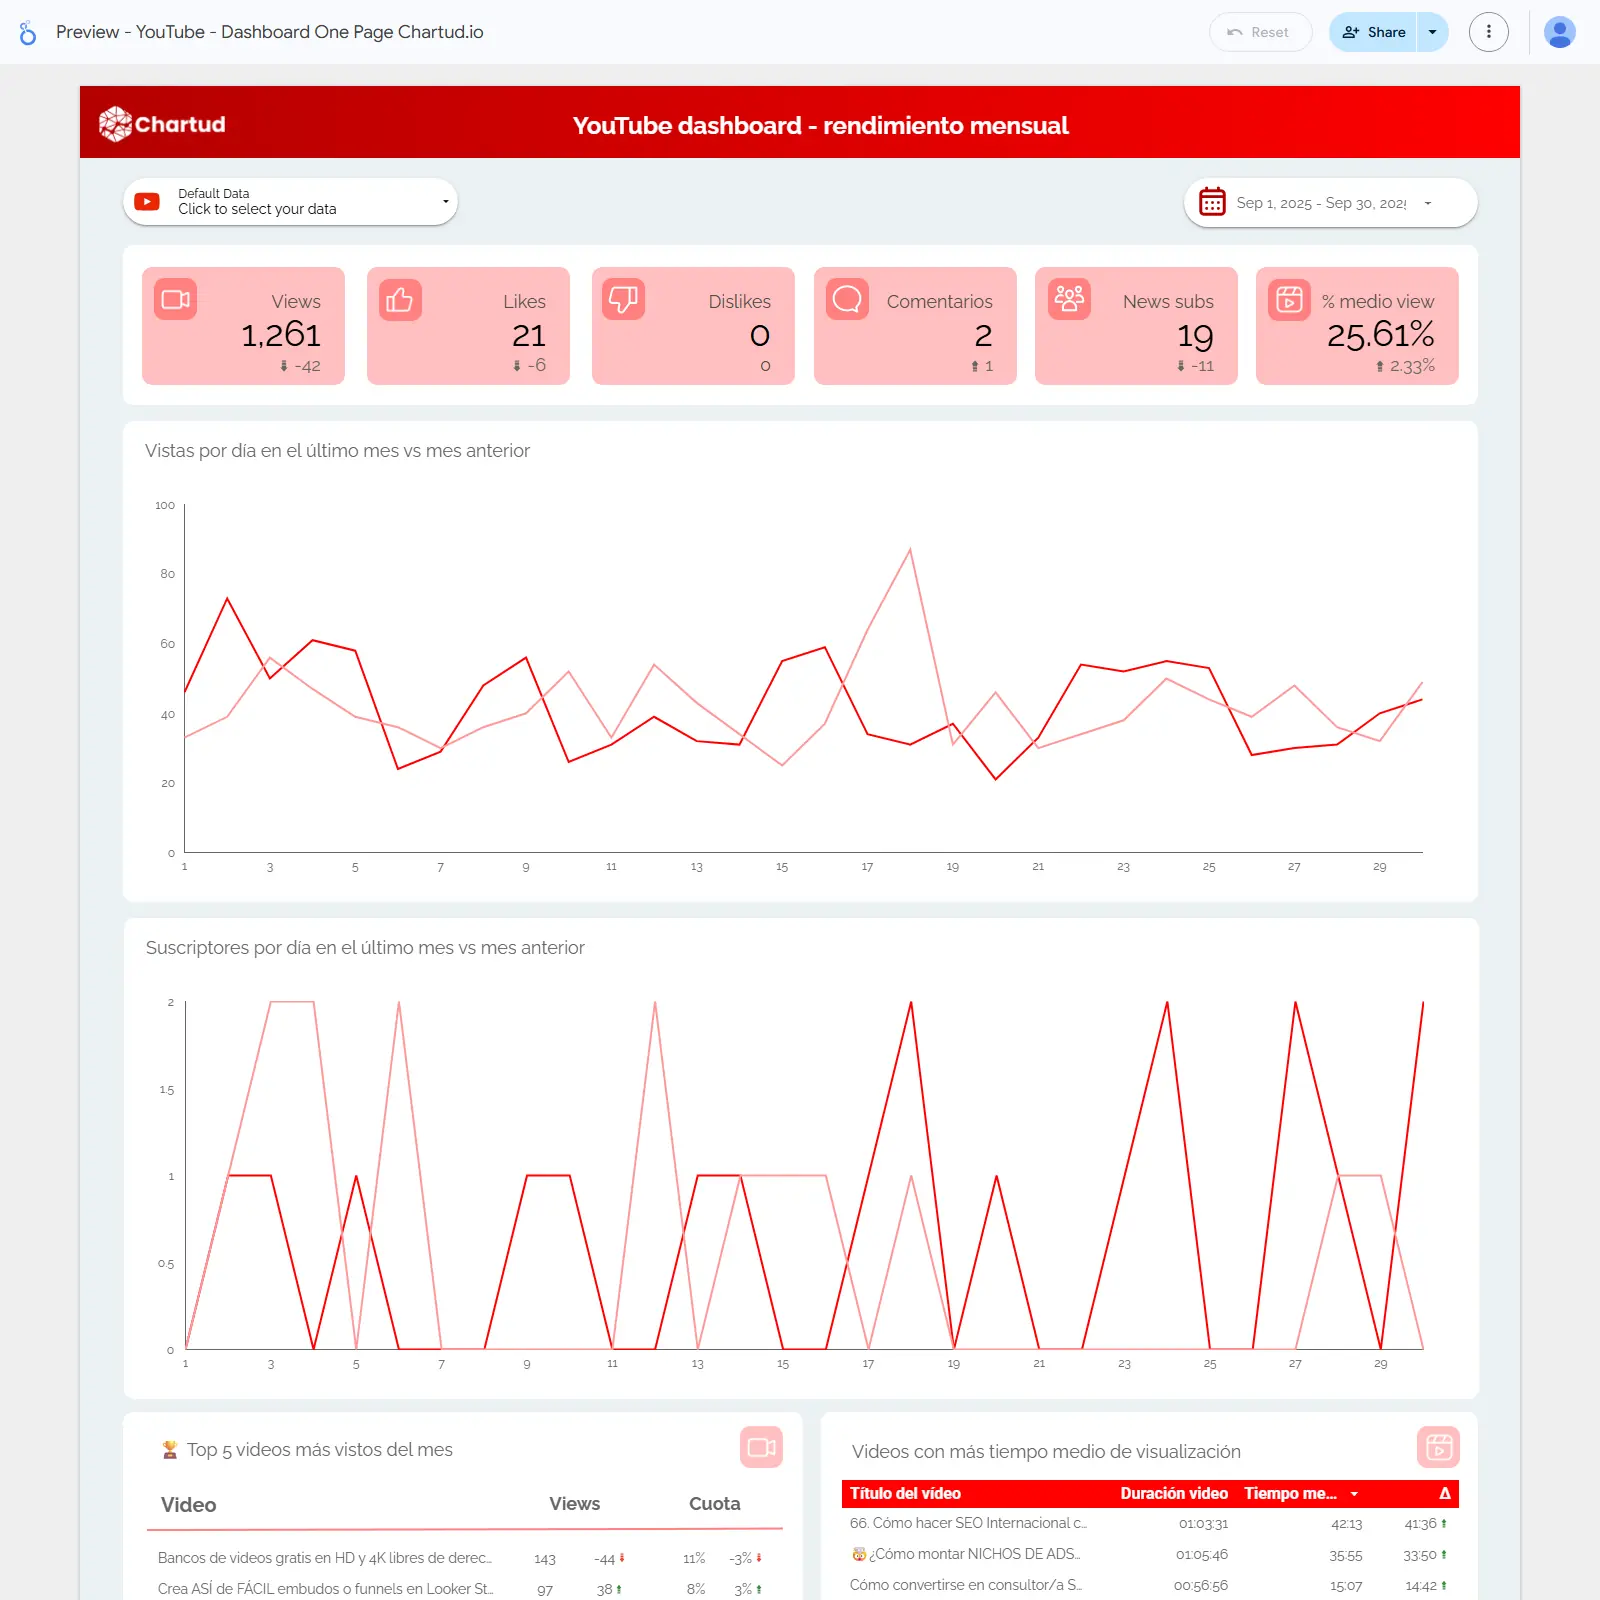
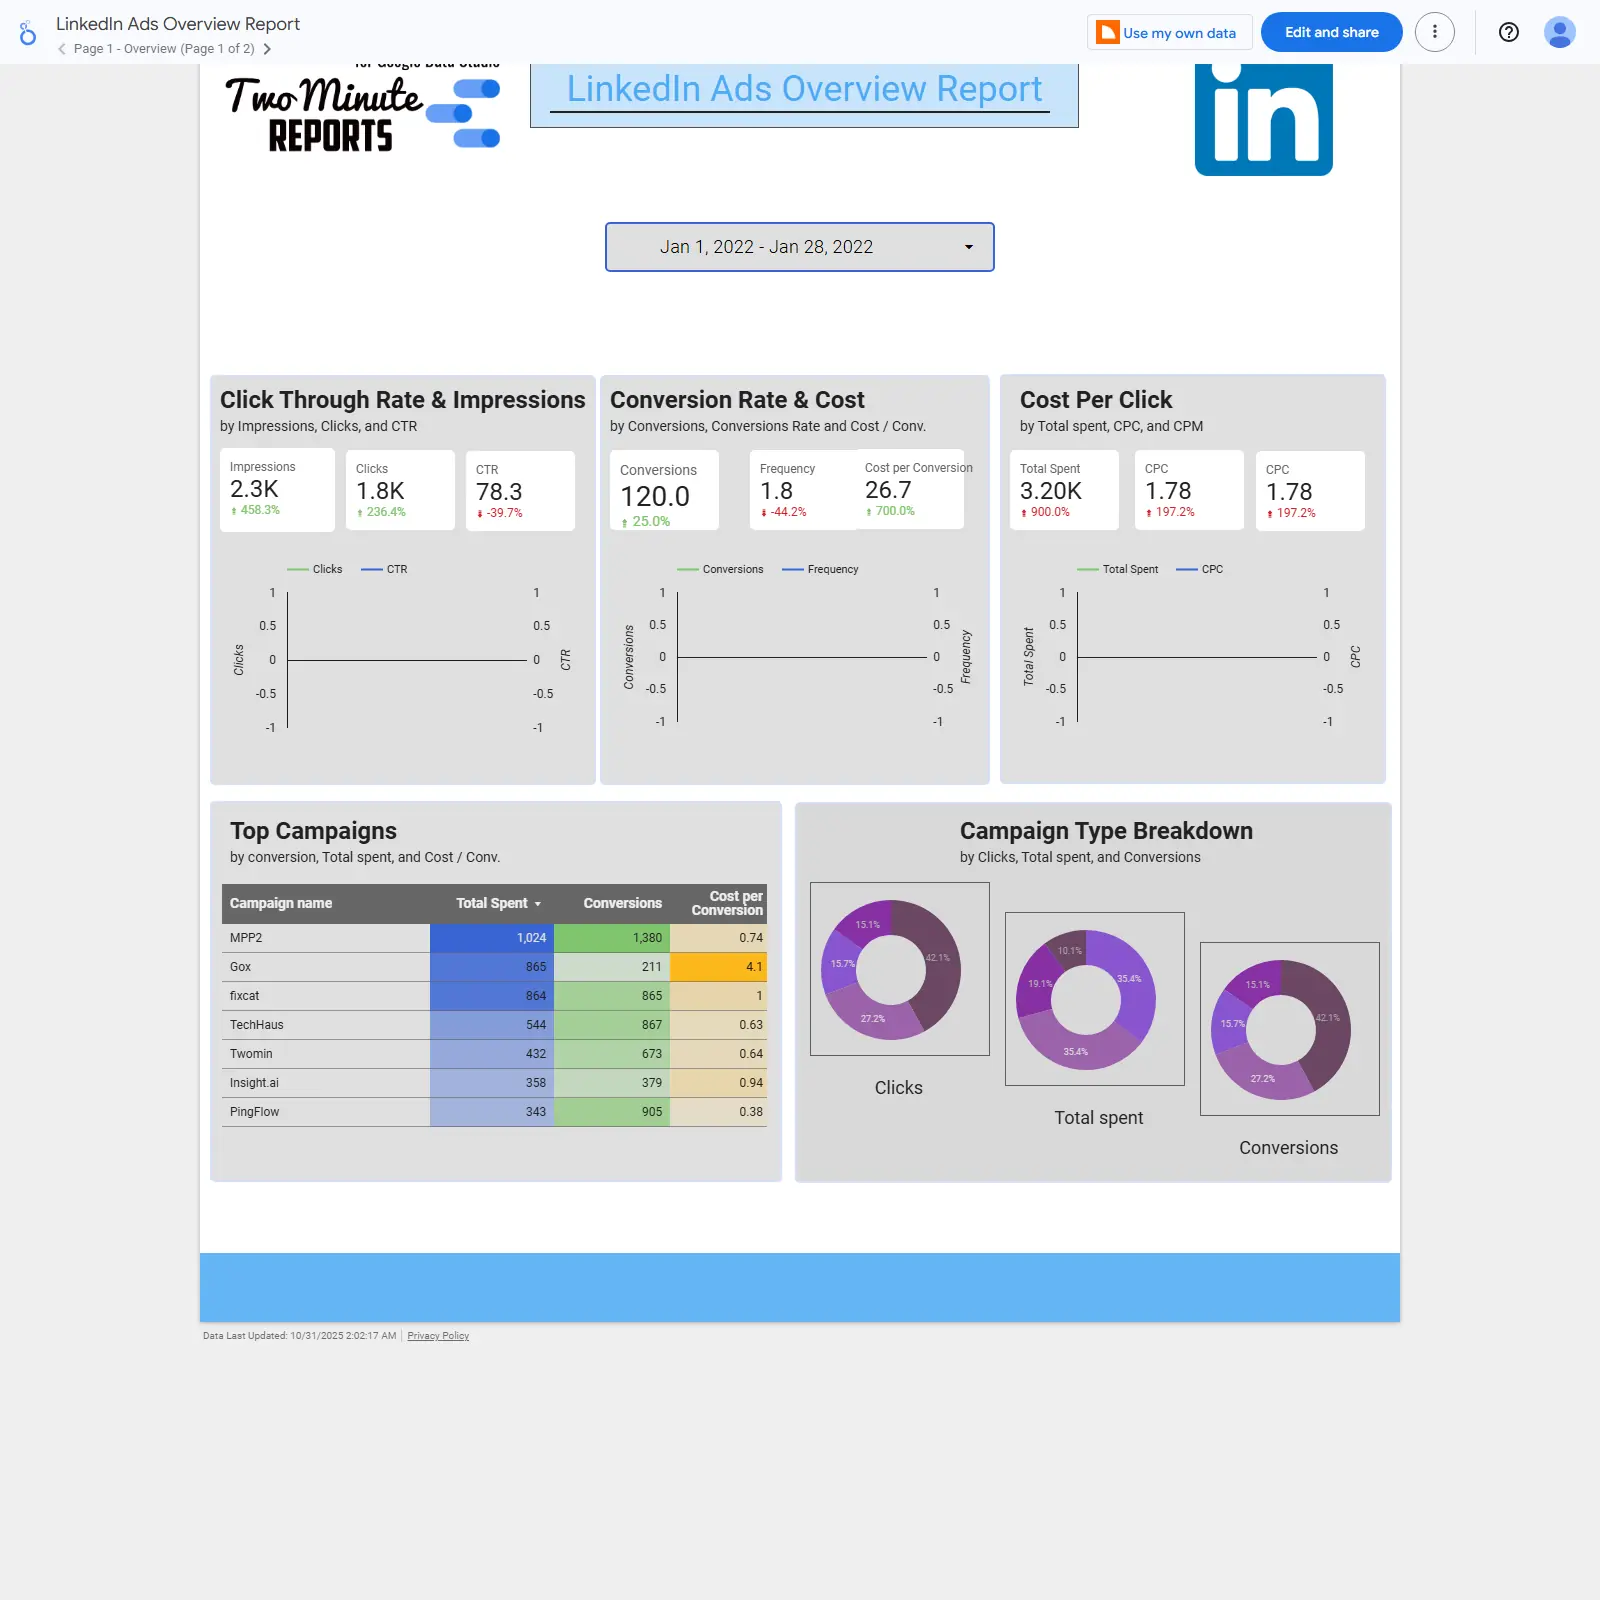
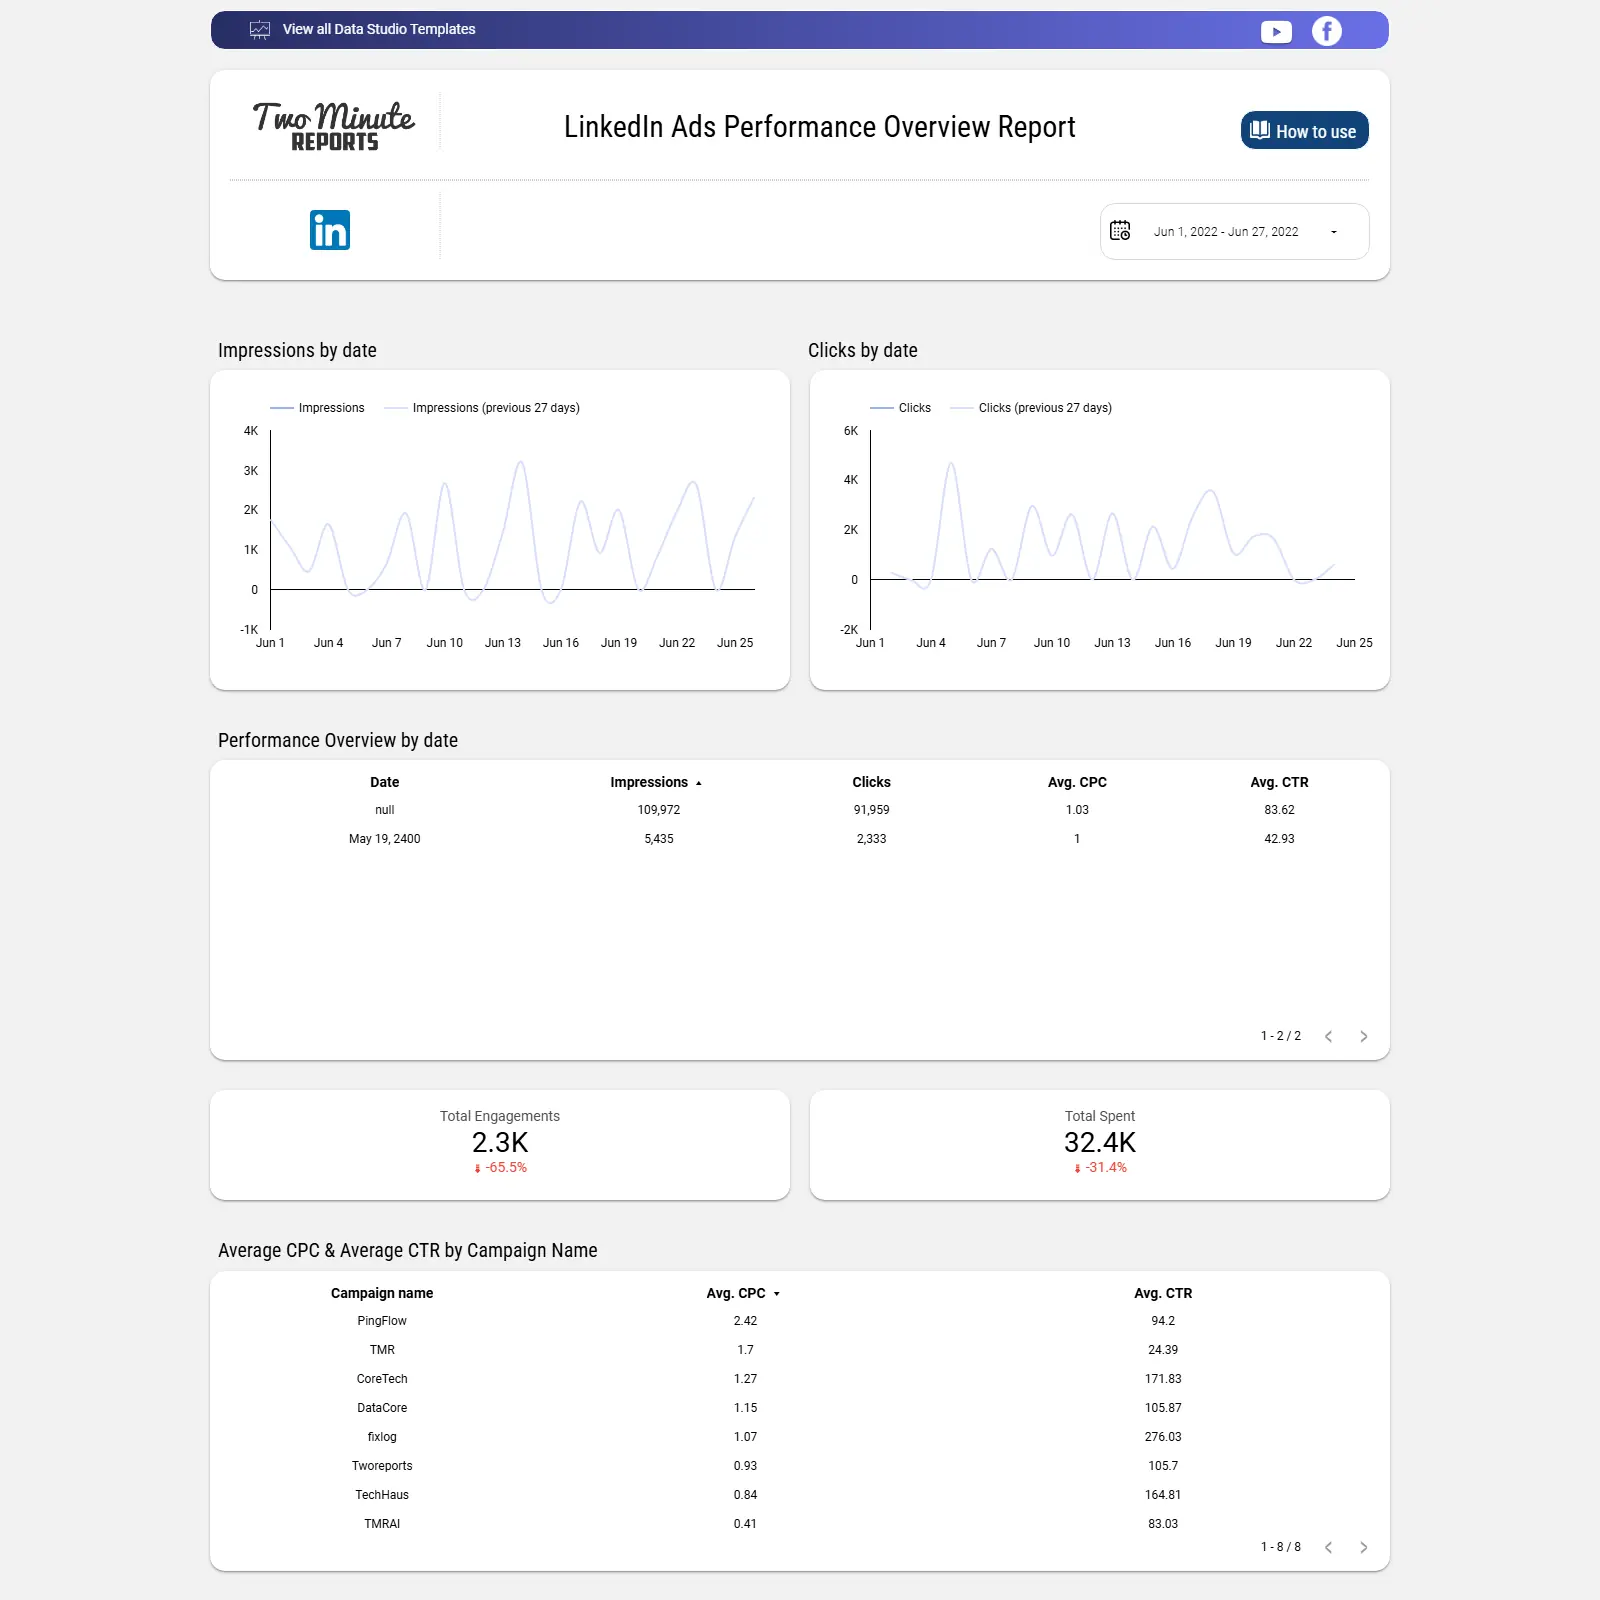
Instagram Ads performance dashboard covering spend, CPM, clicks, CTR, actions, ROAS, and audience/device breakdowns for smarter optimization.

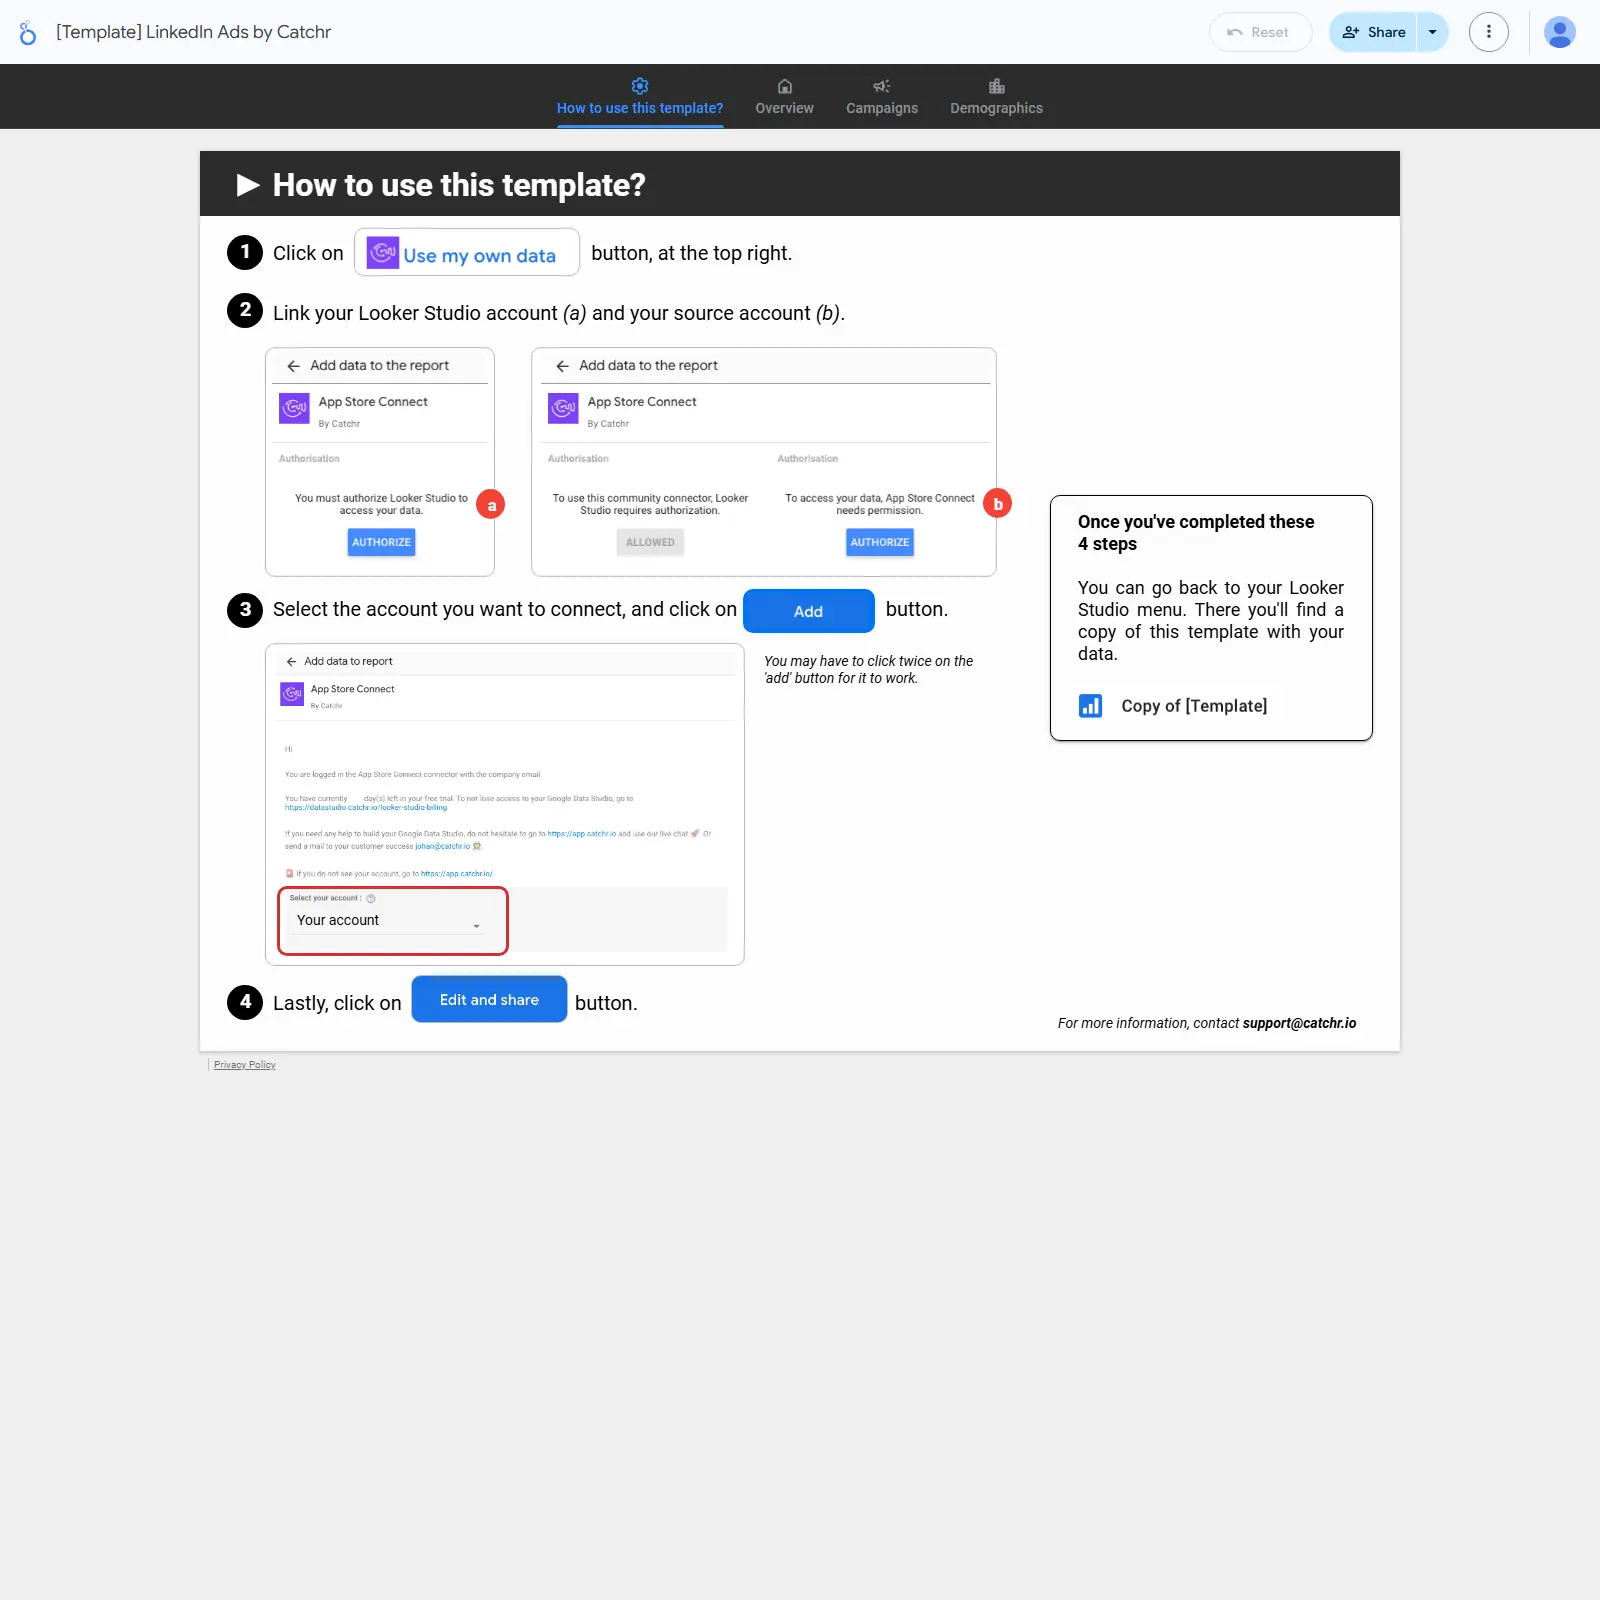
Instagram Ads analytics template for Looker Studio that highlights spend, CPM, impressions, clicks, CTR, actions, and link CTR with clear trend visuals. Pinpoint winning and underperforming campaigns by comparing spend, ROAS, conversion ranking, and CTR. Understand where results come from using a country conversion map and detailed breakdowns by device, age, gender, and campaign objective. Drill into CPA, conversions, unique link CTR, impressions, and link clicks to prioritize budget and creative tests.
Free
Facebook Ads Shopping Template cover image
Facebook Ads Shopping Template

Product-level Facebook Ads Shopping insights with top products, CPM/CPC/CPE benchmarks, and spend to guide smarter budget and product decisions.

Measure product-level performance for Facebook Ads Shop across views, clicks, engagement, and spend. Highlight top 20 products and surface the highest and lowest CPM, CPC, and CPE to spot cost efficiencies and wasted spend. Compare which items attract attention, earn clicks, and drive engagement to guide bidding and creative decisions. Use it to identify breakout products, fix underperformers, and focus budgets on what sells.
Free
Facebook Ads Funnel Template cover image
Facebook Ads Funnel Template

End-to-end Facebook Ads funnel tracking with KPIs for awareness, engagement, conversions, and ROAS to spot bottlenecks and boost performance.

Facebook Ads funnel tracking from awareness to purchase, with a visual flow of Notoriety, Engagement, and Results. Monitor reach, impressions, frequency, and CPM; clicks, CPC, CTR, adds to cart, and CPATC; plus spend, purchases, revenue, and ROAS. See success rates and total conversion rate to pinpoint where users drop off and where to improve. Trend awareness, engagement, and results over time to validate tests and budget shifts. Built for marketers who want clear, actionable insights from their Meta Ads campaigns.
Free
Time tracking dashboard for Clockify cover image
Time tracking dashboard for Clockify

Clockify time and revenue analytics with KPIs and breakdowns by client, project, group, user, and task.

Tracks Clockify time data to spotlight posted hours, active users, billable hours, and billable amount with month‑over‑month change. Breaks performance down by client, project, group, user, and task to reveal who drives time and revenue. Visualizes hours and billings with clear breakdowns and comparisons to surface top clients and projects. Helps estimate workload, monitor utilization, and validate invoicing with a single view.
Free
Apple Search Ads - installs and Accounts Performance cover image
Apple Search Ads - installs and Accounts Performance

Apple Search Ads installs and account performance with KPI trends, efficiency comparisons, and install-type insights by campaign and ad group.

Apple Search Ads installs and accounts performance with clear KPIs for conversion rate, taps, TTR, average CPA/CPM/CPT, and spend. Trend charts reveal changes across spend, impressions, taps, installs, and conversion rate versus the previous 30 days. An account-level table compares efficiency with columns for spend, impressions, CPA, CPM, CPT, conversion rate, installs, and taps. Installs insights detail LAT on/off installs, new downloads, and redownloads by campaign, ad group, and ad to pinpoint growth drivers.
Free
HubSpot content marketing dashboard template cover image
HubSpot content marketing dashboard template

HubSpot content marketing dashboard tracking blog performance and funnel results from views to customers.

HubSpot Content Marketing template focused on measuring the blog’s impact across the funnel, from page views to contacts, leads, opportunities, and customers. Track blog output and engagement with metrics like posts published, views, subscribers, and form submissions. Review blog page analytics to find winning content and spot drop‑offs in the journey. Built for marketers who want to connect content activity with lead generation and revenue outcomes.
Free
Google Play Store cover image
Google Play Store

Track Google Play app installs, uninstalls, ratings, reviews, and acquisition performance in Looker Studio.

Google Play Store analytics template for Looker Studio that tracks app installs, uninstalls, ratings, and reviews in one view. Monitor cumulative installs, performance by acquisition sources, and trends over time to understand what drives growth. Connect your Google Play data to follow core KPIs and catch shifts in user sentiment quickly. Ideal for app marketers, product teams, and developers who want real-time visibility into store performance. Turn raw store data into clear insights for roadmap and marketing decisions.
Free
Google Business Profile - Global Overview cover image
Google Business Profile - Global Overview

Track Google My Business visibility, actions, views/conversions, and ratings with review details to power local SEO decisions.

Google My Business performance at a glance: visibility KPIs, views, conversions, and customer actions like calls, website visits, and direction requests. Track ratings over time and analyze individual reviews with reviewer details to spot issues and opportunities. Compare visibility by device to understand where customers find you. Built for local SEO monitoring so you never miss a review or dip in discovery.
Free
GA4 File Download Event Report cover image
GA4 File Download Event Report

Looker Studio template for GA4 that analyzes file downloads by type, page, users, frequency, and traffic source.

GA4 File Download Looker Studio template focused on analyzing how users download files on your site. Surfaces which file types and pages drive downloads, how many users download, and how often they do it, with traffic attribution across channels and sources. Highlights trends and top-performing assets so you can optimize content placement and promotions. Works with GA4 data when file_download events are tracked via the native connector. Ideal for marketing and product teams managing gated assets, documentation, or media files.
Free
Instagram Ads Reporting Dashboard cover image
Instagram Ads Reporting Dashboard

One-page Looker Studio dashboard for Instagram Ads that tracks spend, reach, engagement, and conversions across account, campaign, and ad levels.

A one-page Instagram Ads dashboard for Looker Studio that consolidates account, campaign, and ad performance. Track core KPIs like spend, reach, frequency, likes, post engagements, link clicks, conversions, CPC, CTR, and cost per conversion. Compare campaigns side by side for clicks, CPC, conversions, and spend, and pinpoint top creatives in the ads performance table. Includes audience and post insights to refine targeting and content for better ROI.
Free
Youtube Dashboard One Page cover image
Youtube Dashboard One Page

YouTube analytics template for KPIs, daily trends, and top‑video insights with month‑over‑month comparison.

Looker Studio template focused on analyzing YouTube channel performance from key KPIs to video-level insights. Tracks views, likes, dislikes, comments, new subscribers, and average view percentage with comparisons to the previous month. Visualizes daily trends for views and subscribers to quickly spot peaks and dips. Highlights top videos by views, average watch time, subscribers generated, and likes to pinpoint what drives growth. Connects via the native Google YouTube connector for fast setup.
$34.64
Youtube Analytics cover image
Youtube Analytics

YouTube Analytics dashboard for Looker Studio to track core KPIs and compare video performance for smarter content decisions.

YouTube Analytics template for Looker Studio focused on the essential KPIs that drive channel growth and content performance. Track views, watch time, subscribers, engagement, and top videos to understand what resonates with your audience. Compare video performances to spotlight winners and fix underperformers. Monitor trends and traffic insights to refine topics, thumbnails, and publishing cadence. Uses a YouTube Analytics connector to keep metrics current for faster decisions.
Free
Youtube Analytics Template cover image
Youtube Analytics Template

Free Looker Studio template to track YouTube views, likes, shares, subscribers, and audience trends by video, country, and day of week.

Measure YouTube channel performance in Looker Studio, covering views, likes, shares, and subscriber growth by video. Identify top-performing content and audience engagement with breakdowns like views per country and views by day of week. Monitor weekly new subscribers and compare engagement across videos to refine publishing cadence and topics. A free, presentation-ready template for creators and marketing teams who want quick insights from YouTube Analytics.
Free
Template Tiktok Ads Overview Ecommerce cover image
Template Tiktok Ads Overview Ecommerce

A TikTok Ads Looker Studio template for ecommerce to review campaign, audience, and creative performance at a glance.

TikTok Ads Overview Ecommerce helps marketers quickly evaluate TikTok advertising performance for online sales. Monitor essential KPIs across campaigns, ad groups, ads, and creatives, and compare audience and creative results to spot what’s working. Built for e‑commerce teams that need fast insight into spend and outcomes without manual reporting. Connects to TikTok Ads through Catchr for real‑time updates and full access to metrics and dimensions. Ideal for agencies and brands managing multiple campaigns.
Free
Semrush SEO performance report cover image
Semrush SEO performance report

Semrush-powered SEO and keyword performance report in Looker Studio.

Semrush Analytics Report for Looker Studio that pulls Semrush data via the Supermetrics connector to visualize SEO performance. Track keyword rankings alongside search volume and CPC to spot high‑value opportunities. Review status and detail views to monitor trends, winning and losing keywords, and domain visibility at a glance. Use it to compare performance over time and quickly prioritize content or optimization actions.
Free
Semrush competitor analysis dashboard cover image
Semrush competitor analysis dashboard

SEO and competitor analysis for Semrush Projects, covering visibility, rankings, traffic, and traffic cost.

Competitor-focused SEO dashboard for Semrush Projects data by Supermetrics. Track visibility, average position, organic traffic, and traffic cost to understand search performance. Compare competitors by visibility and analyze position deviation to identify gaps and quick wins. Highlight traffic and cost trends to prioritize keywords and pages that can move the needle. Built for marketing teams that need actionable competitive insights from Semrush Projects.
Free
Pinterest Ads Overall Performance cover image
Pinterest Ads Overall Performance

Track Pinterest Ads spend, conversions, and efficiency across accounts, campaigns, and ads with comparisons, heatmaps, and geo/audience breakdowns.

Pinterest Ads performance template for Looker Studio tracking spend, clicks, conversions, impressions, and reach with previous-period comparisons. Account-level charts pair conversions with spend and map reach against frequency to spot efficiency and ad fatigue. Campaign and ad views surface clicks, CPC, CPE, CTR, conversions, and spend, supported by heatmaps to highlight winners and laggards. Geo and audience slices reveal reach by country and gender alongside campaign mix. Built to give marketers a single view of overall performance and opportunities to scale or cut.
Free
Microsoft Ads cover image
Microsoft Ads

Microsoft Ads KPI dashboard for Looker Studio with views for Overview, Campaigns, Keywords, and Users.

Microsoft Ads performance template for Looker Studio focused on tracking essential PPC KPIs. Covers key views for Overview, Campaigns, Keywords, and Users to compare results across accounts, ad groups, and campaign types. Built on the Catchr Microsoft Ads connector to pull all available metrics and dimensions with real-time updates. Includes practical filters for date range, account, ad group, and campaign type. Ideal for quickly spotting trends and refining budgets, bids, and targeting.
Free
LinkedIn Pages - Unique and Lifetime Metrics Performance cover image
LinkedIn Pages - Unique and Lifetime Metrics Performance

LinkedIn Pages analytics for unique page views, lifetime metrics, follower growth, and geo insights.

LinkedIn Pages performance tracker focused on unique and lifetime metrics across your company page. Monitor lifetime engagements, impressions, clicks, reach, likes, comments, and shares, plus unique page views for key sections like About, Careers, Jobs, Life, Overview, Products, and People. Compare trends over time with timeline charts and drill into tables for precise counts. Track follower growth with new, organic, and sponsored followers. Use regional and country geo views to see where page views are coming from and spot opportunities to expand reach.
Free
LinkedIn Pages - Post Insight cover image
LinkedIn Pages - Post Insight

Post-level LinkedIn Page analytics to track engagement, views, follower gains, and performance by post type to find your top content.

LinkedIn Pages – Post Insight focuses on post-level analytics for your LinkedIn Business Page. Track engagement, views/impressions, and follower growth to see what resonates. Spot your best posts and compare performance by format, such as images versus carousels. Use these insights to fine‑tune content, increase reach, and drive more interactions.
Free
LinkedIn Pages - Company Page Insight cover image
LinkedIn Pages - Company Page Insight

LinkedIn Company Page analytics with page views and follower demographics by country, region, industry, company size, function, and age.

LinkedIn Pages – Company Page Insight focuses on the performance of your LinkedIn Company Page, highlighting page views and follower growth. Explore where viewers and followers come from with breakdowns by country, region, industry, company size, job function, and age. Identify priority markets and audience segments that drive visibility and engagement. Compare viewer demographics to follower profiles to refine content and outreach. Built for teams that want clear, actionable LinkedIn audience intelligence in Looker Studio.
Free
Looker Studio LinkedIn Ads Dashboard Template cover image
Looker Studio LinkedIn Ads Dashboard Template

Looker Studio template to track LinkedIn Ads spend, results, and audience insights for smarter optimization.

LinkedIn Ads performance template for Looker Studio that consolidates key metrics across cost, acquisition, and engagement. Tracks spend, CPM, impressions, clicks, CTR, CPC, engagements, and engagement rate with time trends. Compares campaign performance in a table to quickly spot best and worst performers. Surfaces audience insights by location, company size, industry, and job title to refine targeting. Ideal for marketers who need fast, actionable LinkedIn Ads visibility.
Free
LinkedIn Ads overview cover image
LinkedIn Ads overview

A LinkedIn Ads Looker Studio dashboard highlighting CTR, conversions, spend, CPC/CPM, and top campaigns with campaign-type breakdowns.

Track LinkedIn Ads performance with KPIs for impressions, clicks, CTR, conversions, conversion rate, cost, CPC, and CPM. Compare campaign efficiency in a ranked table of top campaigns by spend, conversions, and cost per conversion. Visualize breakdowns of clicks, total spend, and conversions by campaign type to spot where budgets work best. Use the cost and frequency insights to control acquisition costs and scale winners. Built for Looker Studio and powered by LinkedIn Ads data.
Free
LinkedIn Ads Performance Overview Report cover image
LinkedIn Ads Performance Overview Report

LinkedIn Ads overview in Looker Studio to track trends, compare campaigns, and optimize spend across CTR, CPC, conversions, and more.

LinkedIn Ads Performance Overview for Looker Studio that brings impressions, clicks, CTR, CPC, conversions, engagements, and spend into one view. See trends over time and compare campaigns to spotlight top performers and underperformers. Drill into average CPC and CTR by campaign and track date-wise shifts to understand what’s driving results. Use it to evaluate budget efficiency, uncover optimization opportunities, and sharpen targeting and creative. Clean visuals and clear scorecards make client updates fast and credible.
Free
LinkedIn Ads Account Based Marketing Report cover image
LinkedIn Ads Account Based Marketing Report

ABM-focused LinkedIn Ads template that ranks top accounts and tracks leads, reach, engagements, and engagement rate to optimize spend.

LinkedIn Ads ABM template focused on company-level performance and prioritization. Track leads, reach, total engagements, and engagement rate to gauge account health and pipeline impact. Identify the top 10 companies by total engagements, spotlight the most and least engaged accounts, and uncover trends to sharpen targeting. Redirect budget to the accounts that respond, and align results with client or sales KPIs. Ideal for marketers running account-based campaigns on LinkedIn who want quick, actionable insights.
Free
LinkedIn Ads - Global Overview cover image
LinkedIn Ads - Global Overview

Track LinkedIn Ads performance with overview, campaign, and demographic insights in Looker Studio.

LinkedIn Ads performance template for Looker Studio focused on giving a global view of essential KPIs. Includes dedicated pages for Overview, Campaigns, and Demographics to compare results and audience profiles. Connects to LinkedIn Ads via Catchr for real-time, complete data coverage. Ideal for monitoring performance trends and optimizing ad spend and targeting.
Free
LinkedIn Ads Budget Report cover image
LinkedIn Ads Budget Report

Budget-focused LinkedIn Ads dashboard tracking spend, revenue, ROAS, and performance by objective, campaign, and ad set.

LinkedIn Ads Budget Report focuses on tracking budget, spend, revenue, and ROAS for LinkedIn campaigns to keep costs aligned with goals. It highlights trends over time and by day of week, helping spot overspending and uneven pacing. Breakdowns by objective, campaign, and ad set reveal which segments convert and deserve more budget. A budget manager section centralizes key KPIs so you can quickly compare planned vs. actual performance and optimize allocation. Built for LinkedIn Ads data via Catchr, it supports real-time monitoring of core advertising metrics.
Free
Klaviyo cover image
Klaviyo

Klaviyo email marketing overview with funnel, campaign performance, and country-level insights.

Klaviyo Overview focuses on email marketing performance pulled from Klaviyo. Track email delivery stats, overall activity, and a conversion funnel to understand drop‑offs from send to conversion. Review campaign performance trends and benchmark engagement. Compare email open rates and activity by country to find geographic opportunities. Built for ecommerce and lifecycle teams optimizing Klaviyo campaigns.
Free
Looker Studio Instagram Insights Overview Report cover image
Looker Studio Instagram Insights Overview Report

A free Looker Studio dashboard for Instagram analytics with KPIs and post-level insights to optimize content and engagement.

Instagram Insights Overview for Looker Studio built by Windsor.ai to track Instagram performance at a glance. Highlights follower trends, reach, impressions, and profile media count, with a detailed posts table covering media type, captions, likes, comments, saves, and engagement. Compare posts side by side to find winning content and spot underperformers. Includes pages for an overview, post reporting, and activity to inform content planning and campaign optimization. Ideal for social teams and marketers who want quick, actionable Instagram analytics without manual reporting.
Free
Instagram cover image
Instagram

Three-page Looker Studio template to track Instagram performance across overview, posts, and reels.

A focused Instagram analytics dashboard for Looker Studio with three pages: Overview, Post, and Reel. Track audience growth, reach, impressions, and engagement to understand what’s working. Drill into posts and reels to see content performance, trends over time, and the drivers of interactions. Spot high‑performing formats, refine posting cadence, and align content with your goals. Built for marketers and social teams who want quick, actionable insights.
Free
Indeed Reviews cover image
Indeed Reviews

Analyze Indeed company reviews with metrics for ratings by volume, top professions, languages, and monthly trends.

Indeed Reviews analytics built with Supermetrics to track how your employer brand performs on Indeed. See review volume by rating, average ratings for the top job titles/professions with the most reviews, rating distribution by language, and monthly trends for ratings and review counts. Spot shifts in sentiment across roles and markets to guide hiring, HR communications, and reputation management. Ideal for HR, talent acquisition, and employer branding teams that need a clear view of company feedback on Indeed.
Free
Google Trends - DST IOT and Related Queries cover image
Google Trends - DST IOT and Related Queries

Google Trends template that surfaces daily trending searches, interest over time, and related queries for fast SEO and content insights.

Google Trends template for Looker Studio focused on three views: Daily Search Trends, Interest Over Time, and Related Queries. Track trending topics with search terms, titles, sources, thumbnails, and search volume heatmaps to see what’s breaking right now. Compare interest by country and term with time series, pie, and geo visuals to gauge market demand over time. Explore related queries with trend type, interest score, and rising percentage to uncover keyword opportunities. Ideal for SEO, content planning, and spotting emerging topics across regions.
Free
Google Play Reviews report cover image
Google Play Reviews report

Monitor Google Play ratings and reviews to spot trends and prioritize improvements.

Tracks Google Play reviews for your app so you can quickly understand user feedback. Highlights rating levels and review volume over time to spot spikes and trends. Surfaces recent comments to help product, support, and marketing teams prioritize fixes and updates. Ideal for keeping a pulse on store perception after releases and campaigns.
Free
Google Business Profile Reviews and Questions report cover image
Google Business Profile Reviews and Questions report

Track recent and worst reviews plus unanswered and most‑upvoted questions from Google My Business to prioritize responses and improve sentiment.

Monitor Google My Business reputation by surfacing your most recent reviews, lowest‑rated feedback, and top‑upvoted questions in one place. Spot unanswered questions, see who posted them, and use upvotes to prioritize responses that matter most. Track shifts in customer sentiment over time to catch service issues early. Pull real‑time GMB data via Catchr to keep teams focused on what needs attention now. Ideal for local businesses and multi‑location brands that want faster, smarter review and Q&A management.
Free
SEO overview cover image
SEO overview

Unified SEO dashboard combining GA4 and Search Console to track organic traffic, keywords, and user trends.

SEO Overview is a Looker Studio dashboard that blends Google Analytics 4 and Google Search Console to track organic performance at a glance. Monitor essential KPIs across Overview, Keywords, and Users pages to understand traffic trends, discover top search queries, and evaluate user behavior from SEO. Use it to spot opportunities, validate what’s working, and guide content and technical optimizations. Ideal for marketers and site owners who want a unified view of SEO results without manual reporting.
Free
Google Analytics vs Google Ads Performance dashboard cover image
Google Analytics vs Google Ads Performance dashboard

Compare GA4 and Google Ads performance to link ad spend with traffic, engagement, and clicks.

Side‑by‑side analysis of Google Analytics 4 and Google Ads to connect ad spend with on‑site behavior and outcomes. Highlights core KPIs—new users, sessions, users, clicks, engagement—and compares performance across date ranges. Visuals cover trends, top countries, and channel contribution so you can spot where traffic and conversions are coming from. Ideal for evaluating campaign effectiveness and reallocating budget to the highest‑impact sources. Built for marketers who need a fast, unified view of acquisition and advertising results.
Free
Funnels report template cover image
Funnels report template

Facebook Ads funnel analysis in Looker Studio to trace spend-to-lead performance and spot drop‑offs fast.

Facebook Ads funnel analysis template for Looker Studio that maps the journey from ad impressions and clicks to leads and outcomes. Presents funnel stages side by side to reveal drop‑offs, costs, and conversion efficiency. Surfaces core performance markers such as CTR, CPC, CPL, and lead volume to pinpoint where money is won or wasted. Works with the Porter Metrics Facebook & Instagram Ads connector to bring campaign data into one view. Built for marketers and e‑commerce teams focused on optimizing paid social acquisition and scaling winners.
Free
Google Analytics 4 Overview Report cover image
Google Analytics 4 Overview Report

GA4 Overview template that unifies acquisition, engagement, revenue, demographics, tech, and funnel insights into clear scorecards and charts.

GA4 Overview template for Looker Studio that distills key web analytics into clear scorecards and charts. Track Total Users, New Users, engagement, and revenue with period comparisons to quickly spot growth or drops. Dive into acquisition, engagement, monetization, demographics, technology, and the shopping funnel to see where users come from, how they behave, and what drives sales. Highlights include users’ origin, top campaigns, and e‑commerce performance for fast, actionable insights. Ideal for teams wanting a single view of GA4 to guide channel investment and conversion optimization.
Free
Days of Week x Hours Heatmap for GA4 cover image
Days of Week x Hours Heatmap for GA4

GA4 heatmap of traffic by hour and day to pinpoint peak engagement times.

GA4 heatmap template that maps traffic by day of week and hour to reveal peak engagement periods. Visualizes sessions (and other GA4 metrics) in a compact grid for fast pattern recognition. Adjustable date range, first day of week, and color options keep analysis aligned with your calendar. Use insights to schedule content, optimize ad flighting, and staff support when demand spikes.
Free