Looker Studio Report Gallery

The best free & paid Looker Studio templates, curated and quality-ranked for data reporting.

Showing 121 - 160 of 552

Mailchimp email marketing analytics dashboard cover image
Mailchimp email marketing analytics dashboard

Email marketing dashboard that connects Klaviyo/Mailchimp with GA4 and Shopify to track the full journey from send to revenue.

Email marketing analytics template that unifies Klaviyo, Mailchimp, GA4, and Shopify data to measure campaign impact end to end. Visualizes the funnel from emails sent and delivered to opens, clicks, purchasers, and revenue. Tracks core metrics like open rate, click rate, unsubscribes, bounces, new subscribers, and spam complaints by campaign and over time. Highlights landing pages, traffic trends, and top campaigns to reveal what drives engagement and sales. Built to tie email performance directly to orders and revenue for clear ROI decisions.
Free
Mailchimp analytics dashboard cover image
Mailchimp analytics dashboard

Mailchimp Looker Studio template tracking campaign funnel, engagement, deliverability, and list health with campaign-level detail.

Mailchimp analytics template for Looker Studio to track email marketing performance end-to-end. Visualizes the campaign funnel from emails sent and delivered to unique opens and clicks, plus unsubscribes, bounces, and spam reports to monitor deliverability and list health. Trend charts highlight open and click rates, subscriber engagement, and emails sent vs. opened over time. A campaign-level table benchmarks KPIs, flags issues, and includes revenue fields to pinpoint high-impact emails. Built for marketers who want fast, actionable insights on audience behavior and growth.
Free
LinkedIn Company Page Looker Studio Template cover image
LinkedIn Company Page Looker Studio Template

A LinkedIn Company Page analytics template that highlights growth, engagement, top content, and audience demographics.

LinkedIn Company Page analytics focused on growth and engagement—track followers, impressions, clicks, CTR, likes, and engagement rate at a glance. Identify top-performing posts, compare formats (text vs images), and spot the best days to post for maximum reach. Explore follower demographics by industry and location, and monitor new followers month over month to gauge campaign impact. Built for clear performance trends that turn insights into content and scheduling decisions.
€149
LinkedIn Ads Performance overview cover image
LinkedIn Ads Performance overview

Comprehensive LinkedIn Ads Looker Studio template tracking KPIs, delivery, engagement, and conversions to optimize campaigns.

LinkedIn Ads Overall Performance template for Looker Studio that consolidates campaign KPIs in one place. Track impressions, clicks, spend, leads, post‑view conversions, total conversions, and trend changes at a glance. Explore detailed tables for CPC, CTR, cost per lead, serving location, delivery, engagement (comments, shares, follows), and conversions with lead form opens. Compare campaigns to find top performers, cut wasted spend, and scale what works. Built for marketers who need fast, client‑ready LinkedIn Ads reporting and optimization insights.
Free
LinkedIn Ads report template for Looker Studio cover image
LinkedIn Ads report template for Looker Studio

A comprehensive Looker Studio dashboard for measuring and optimizing LinkedIn Ads performance, audiences, formats, and ROI.

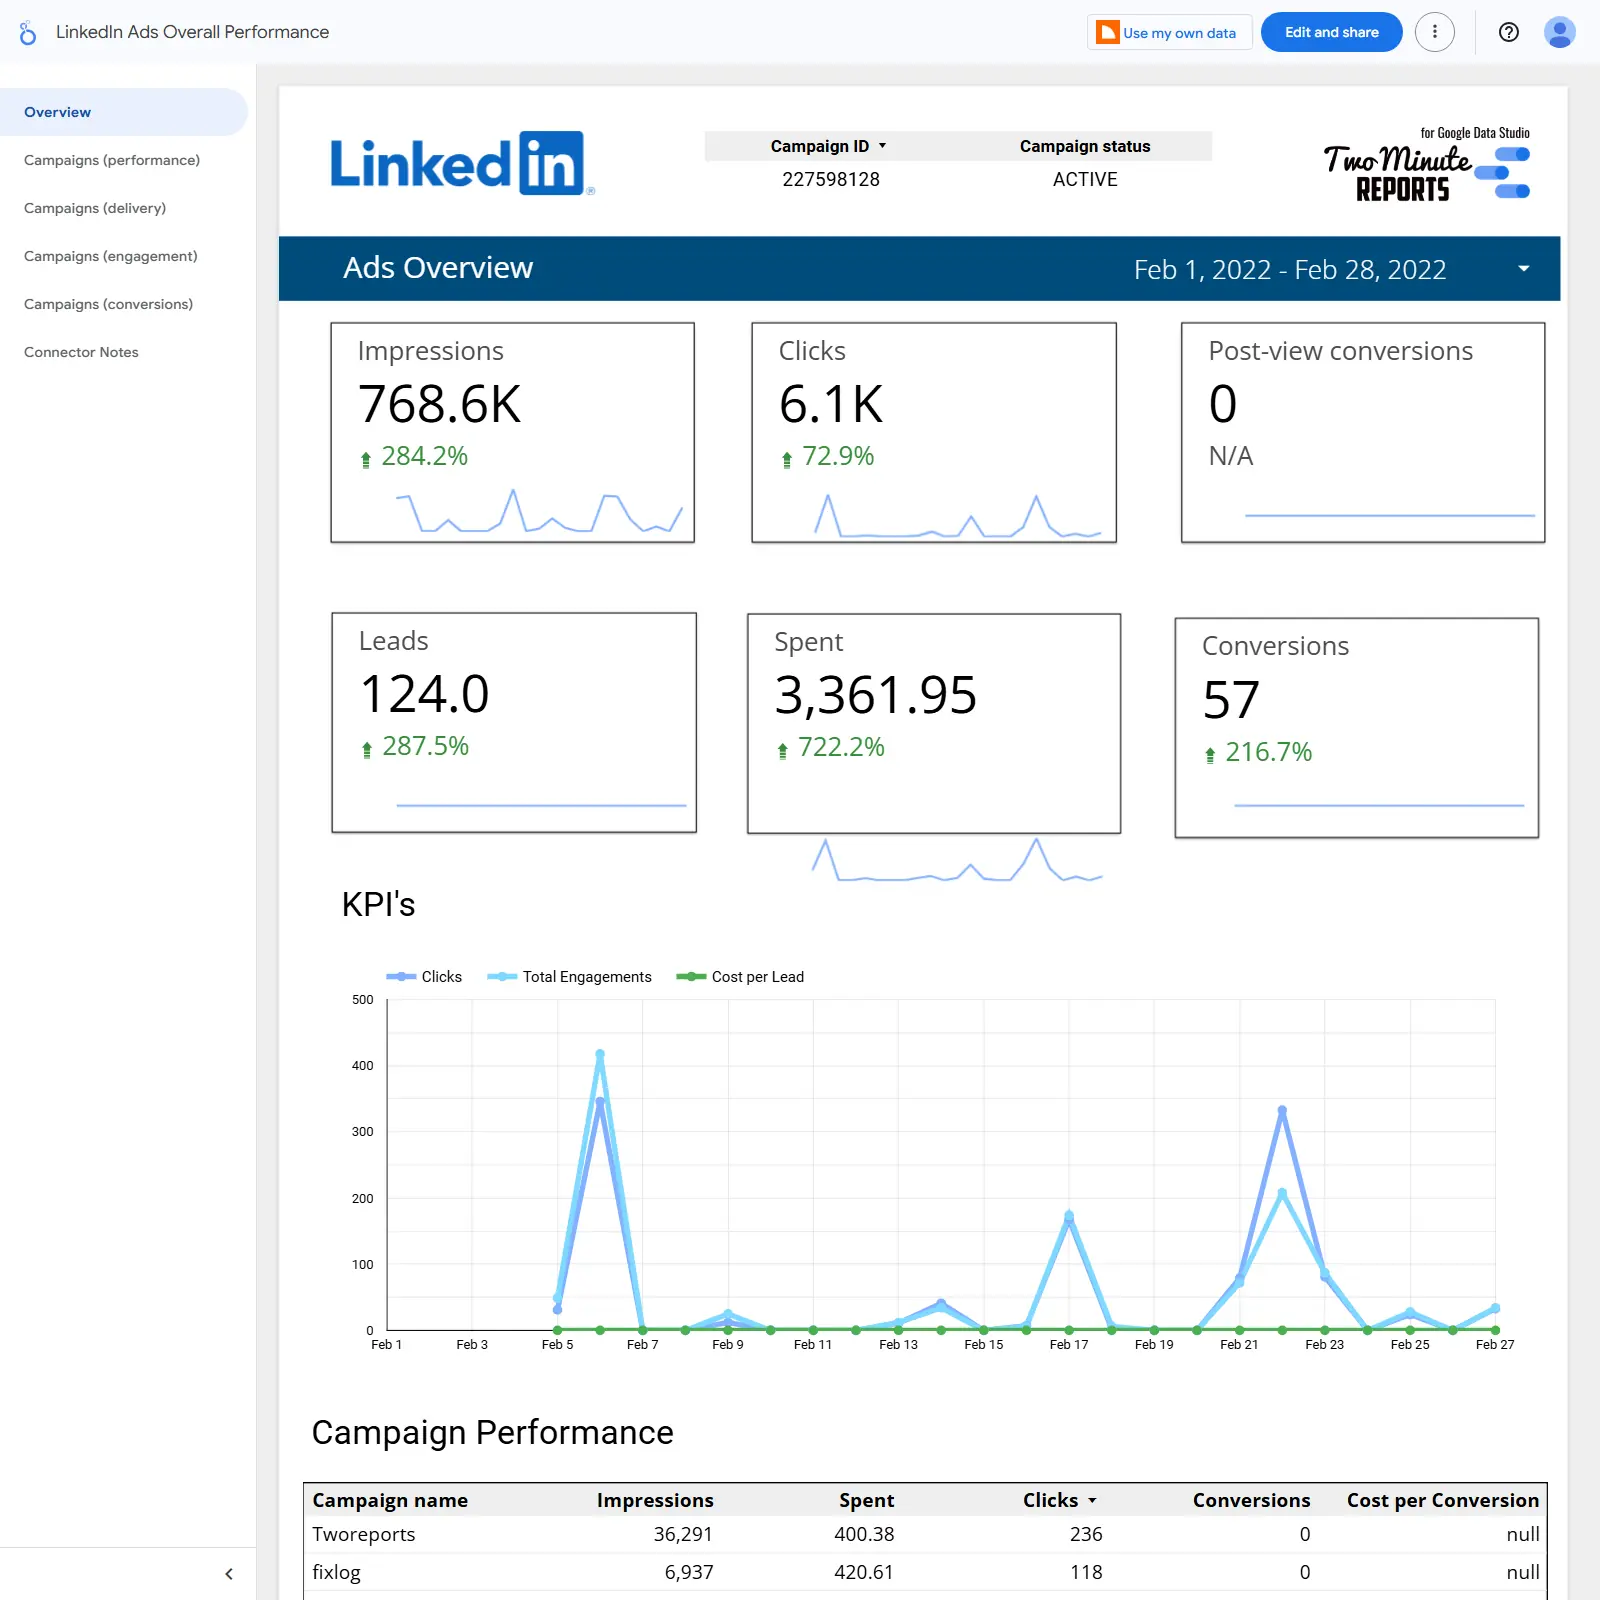
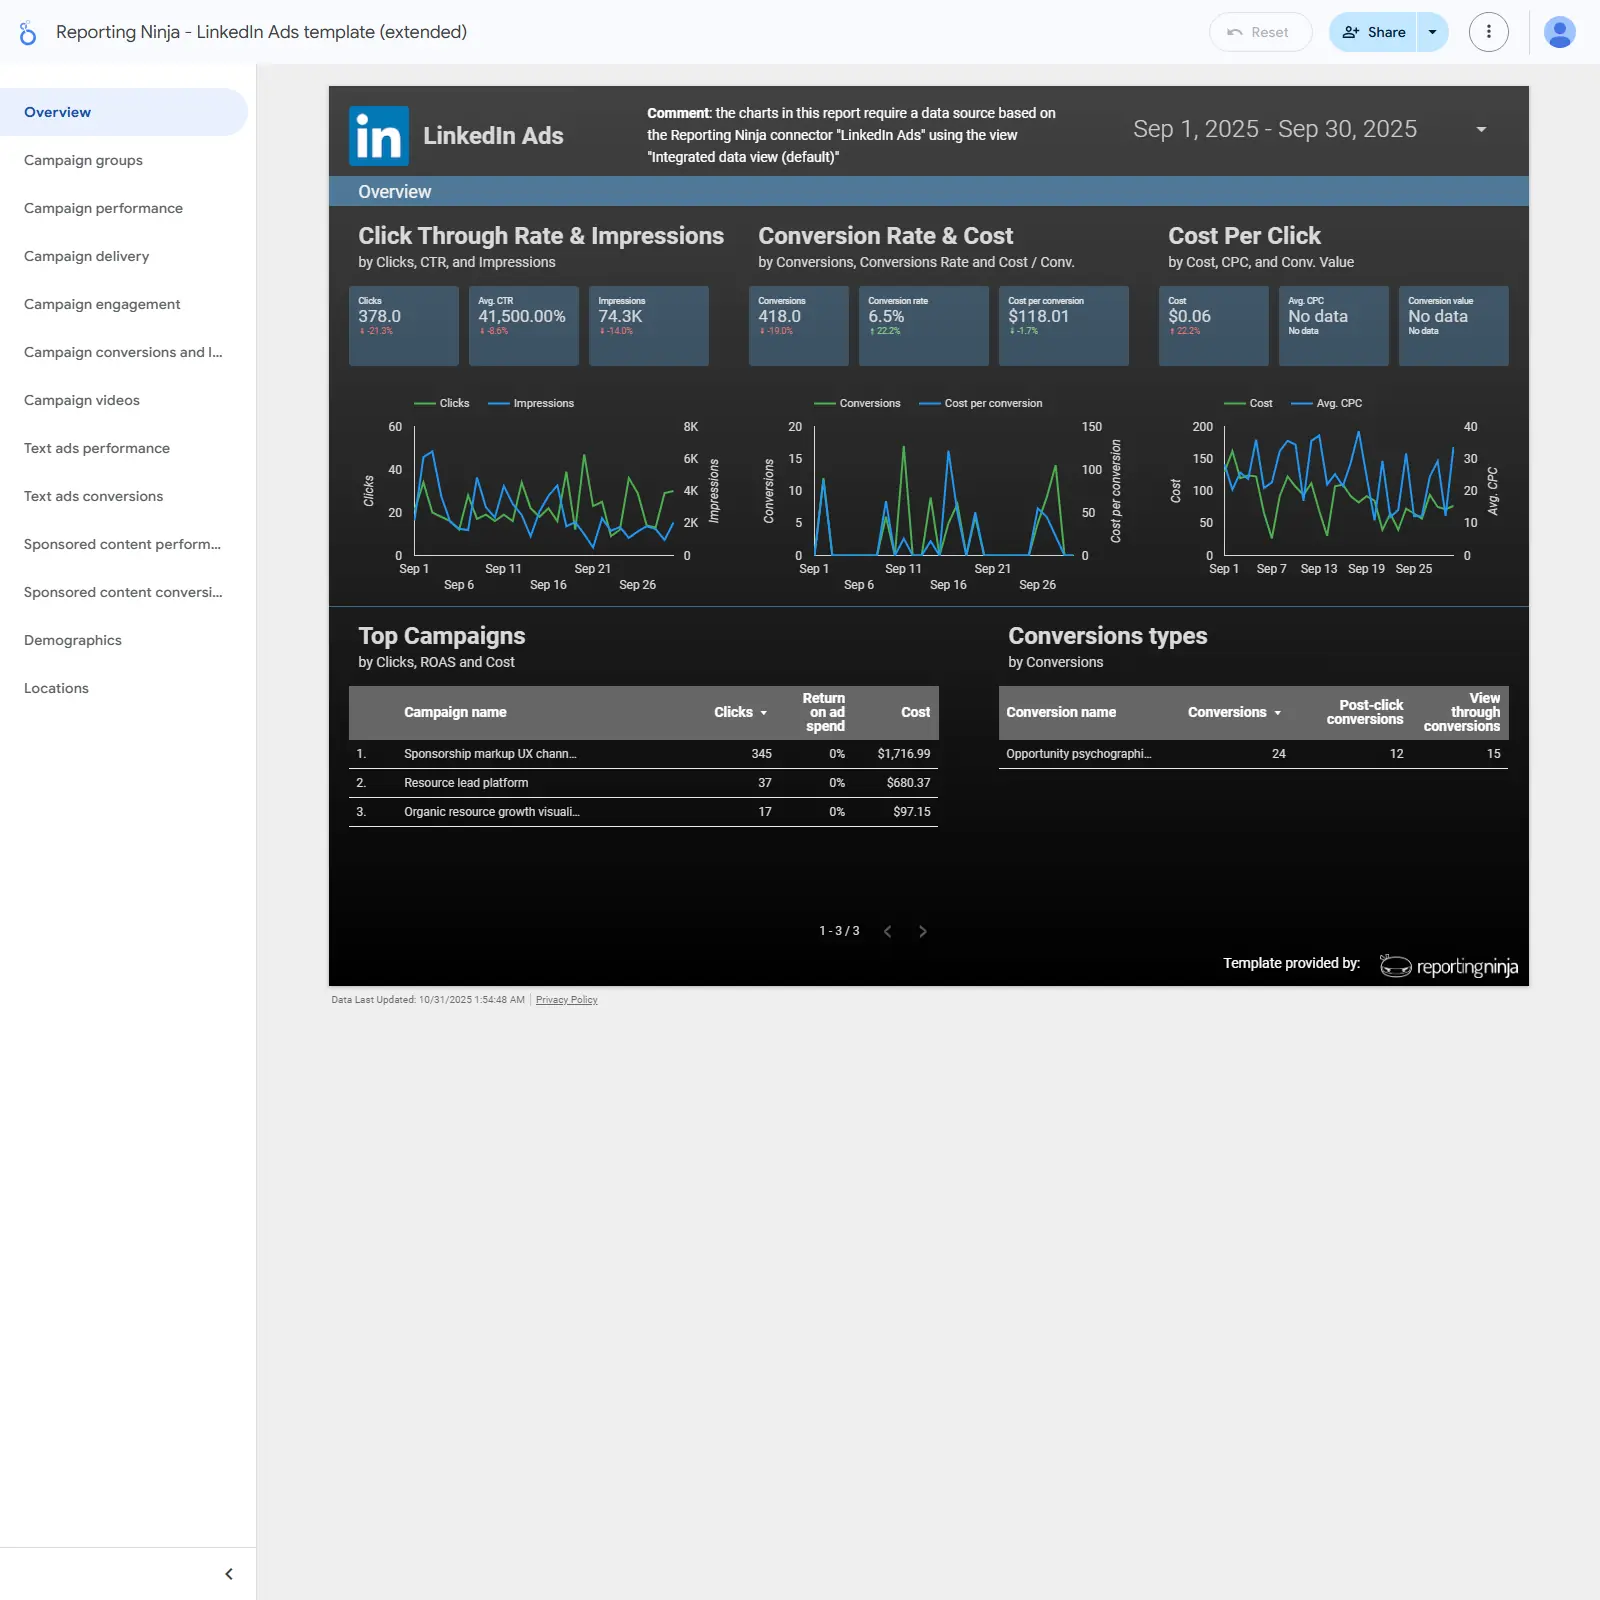
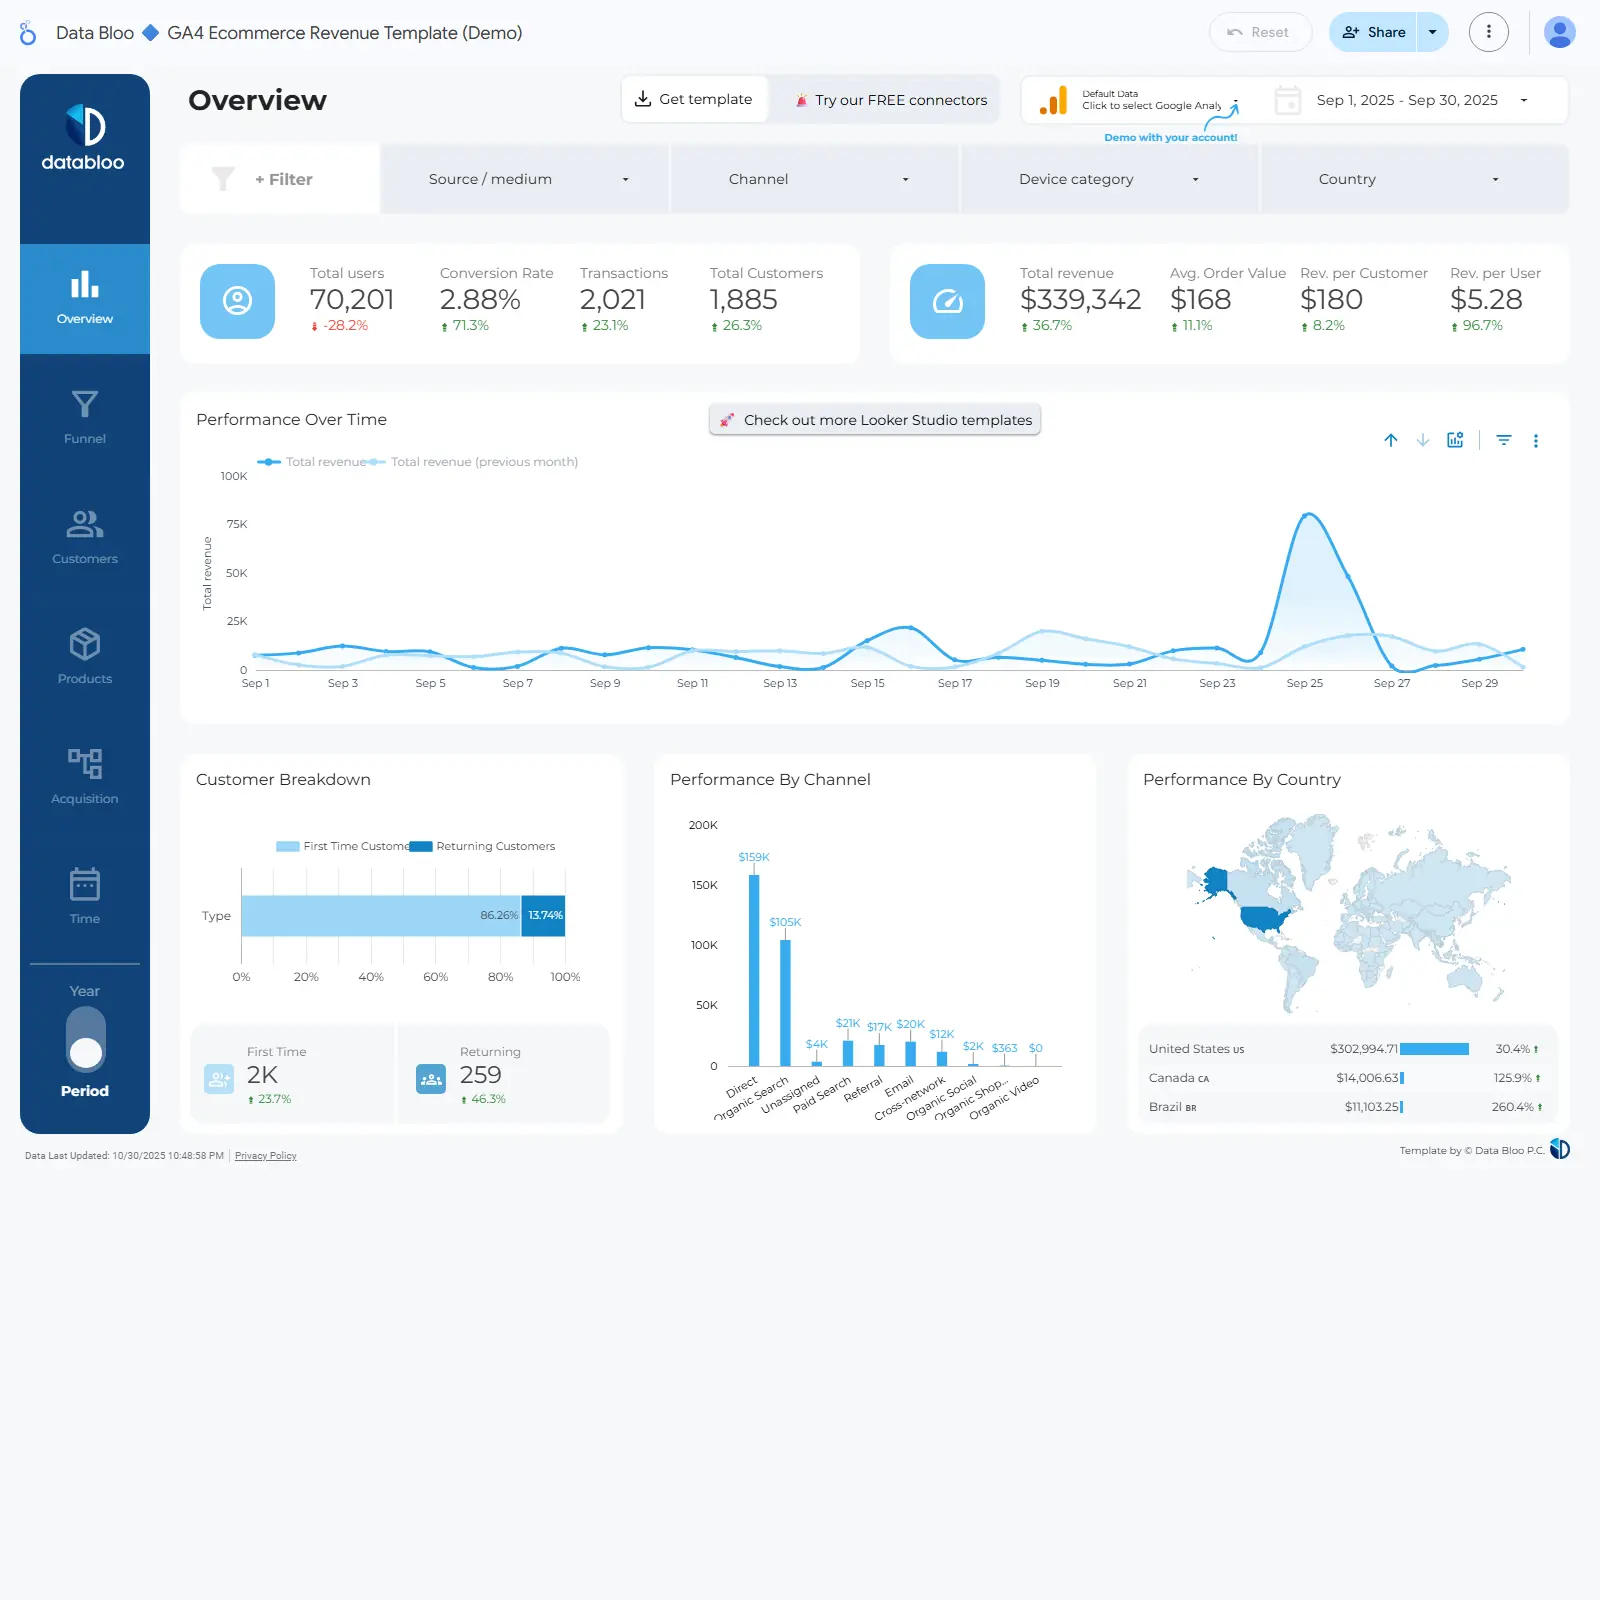
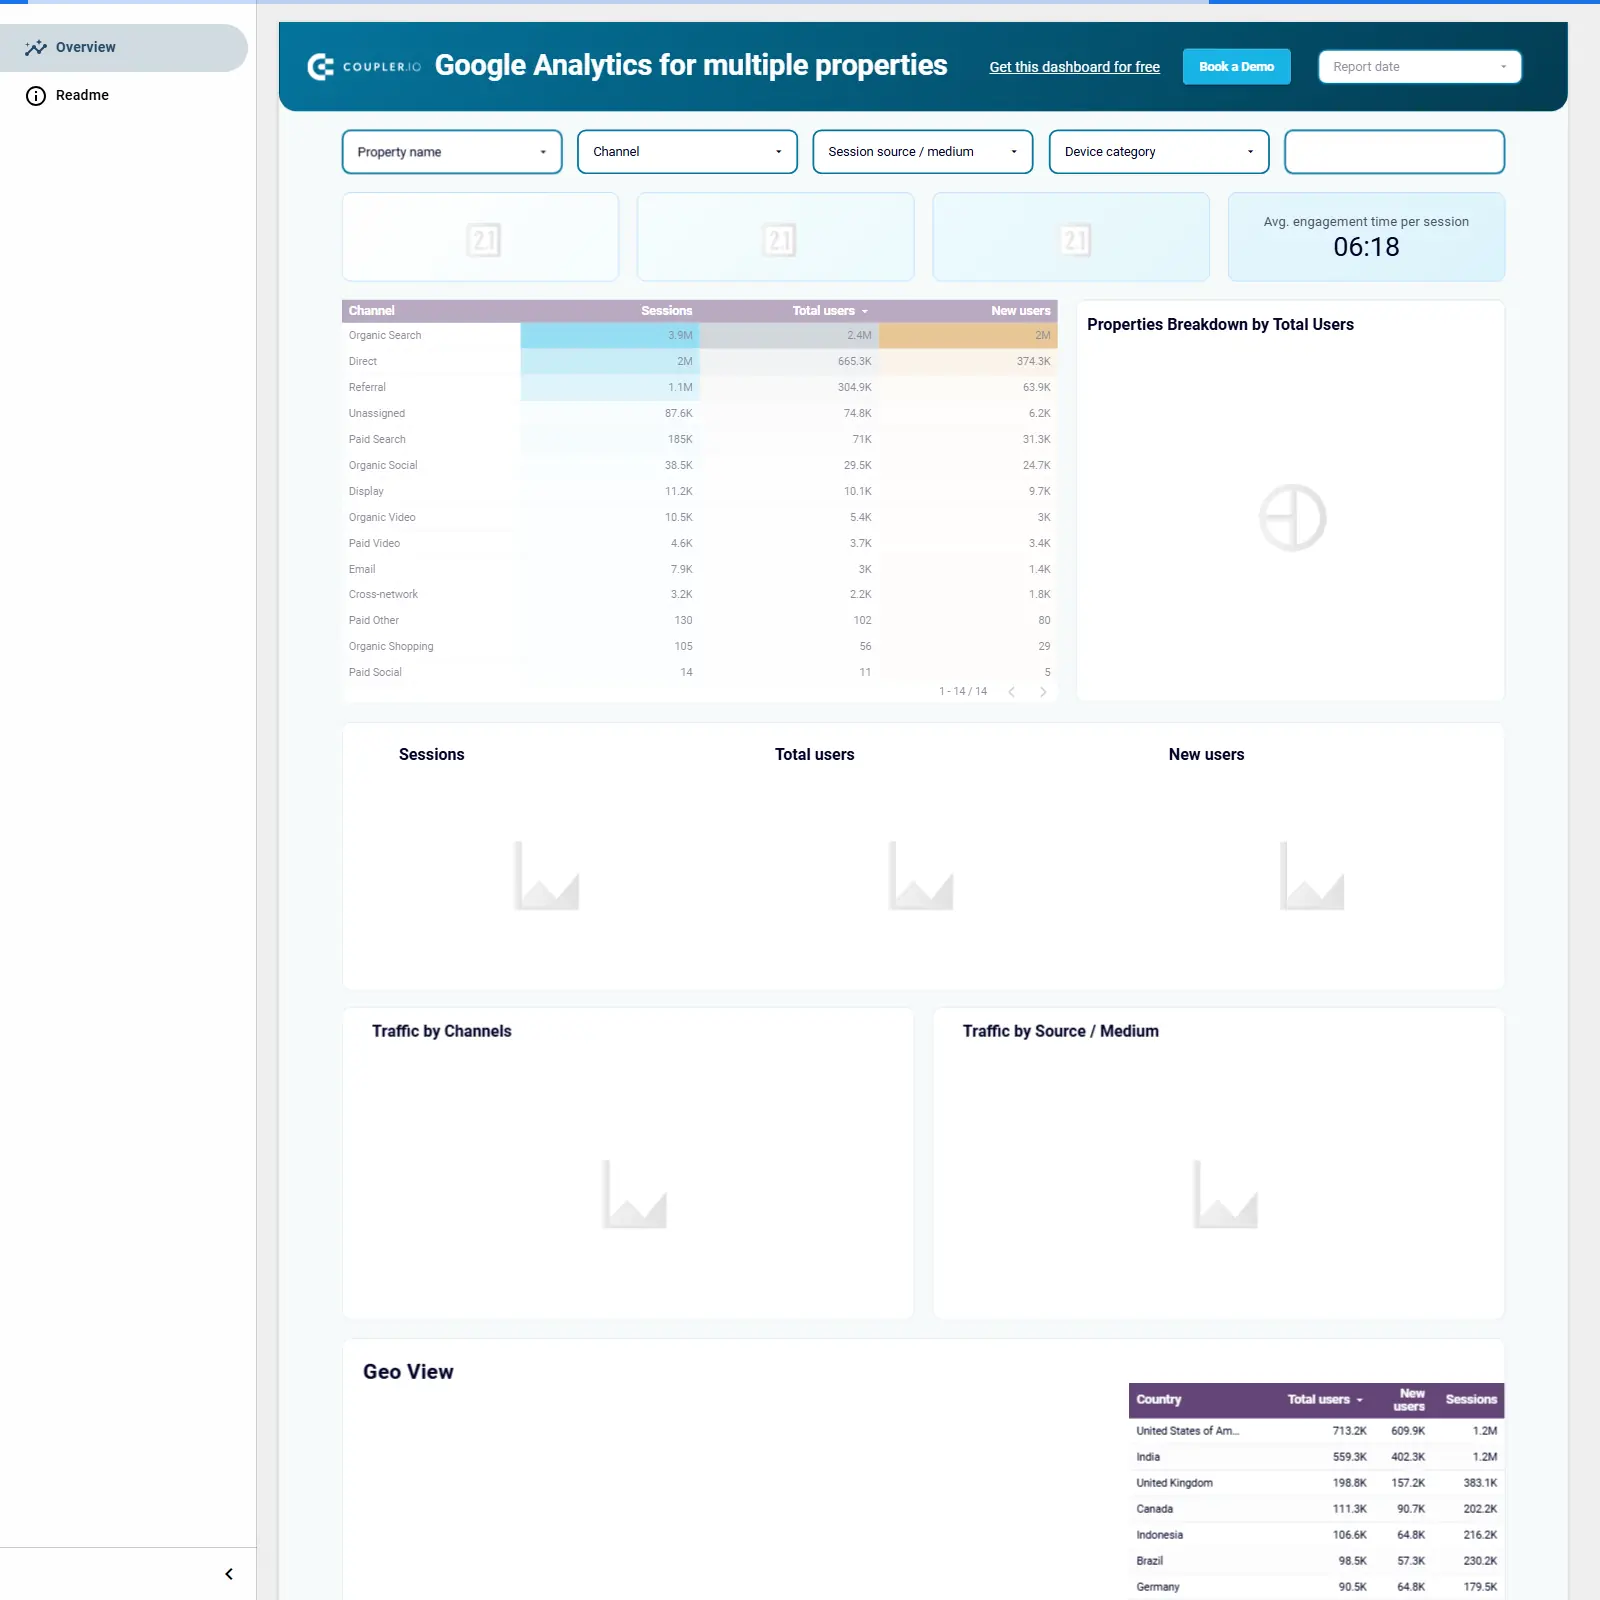
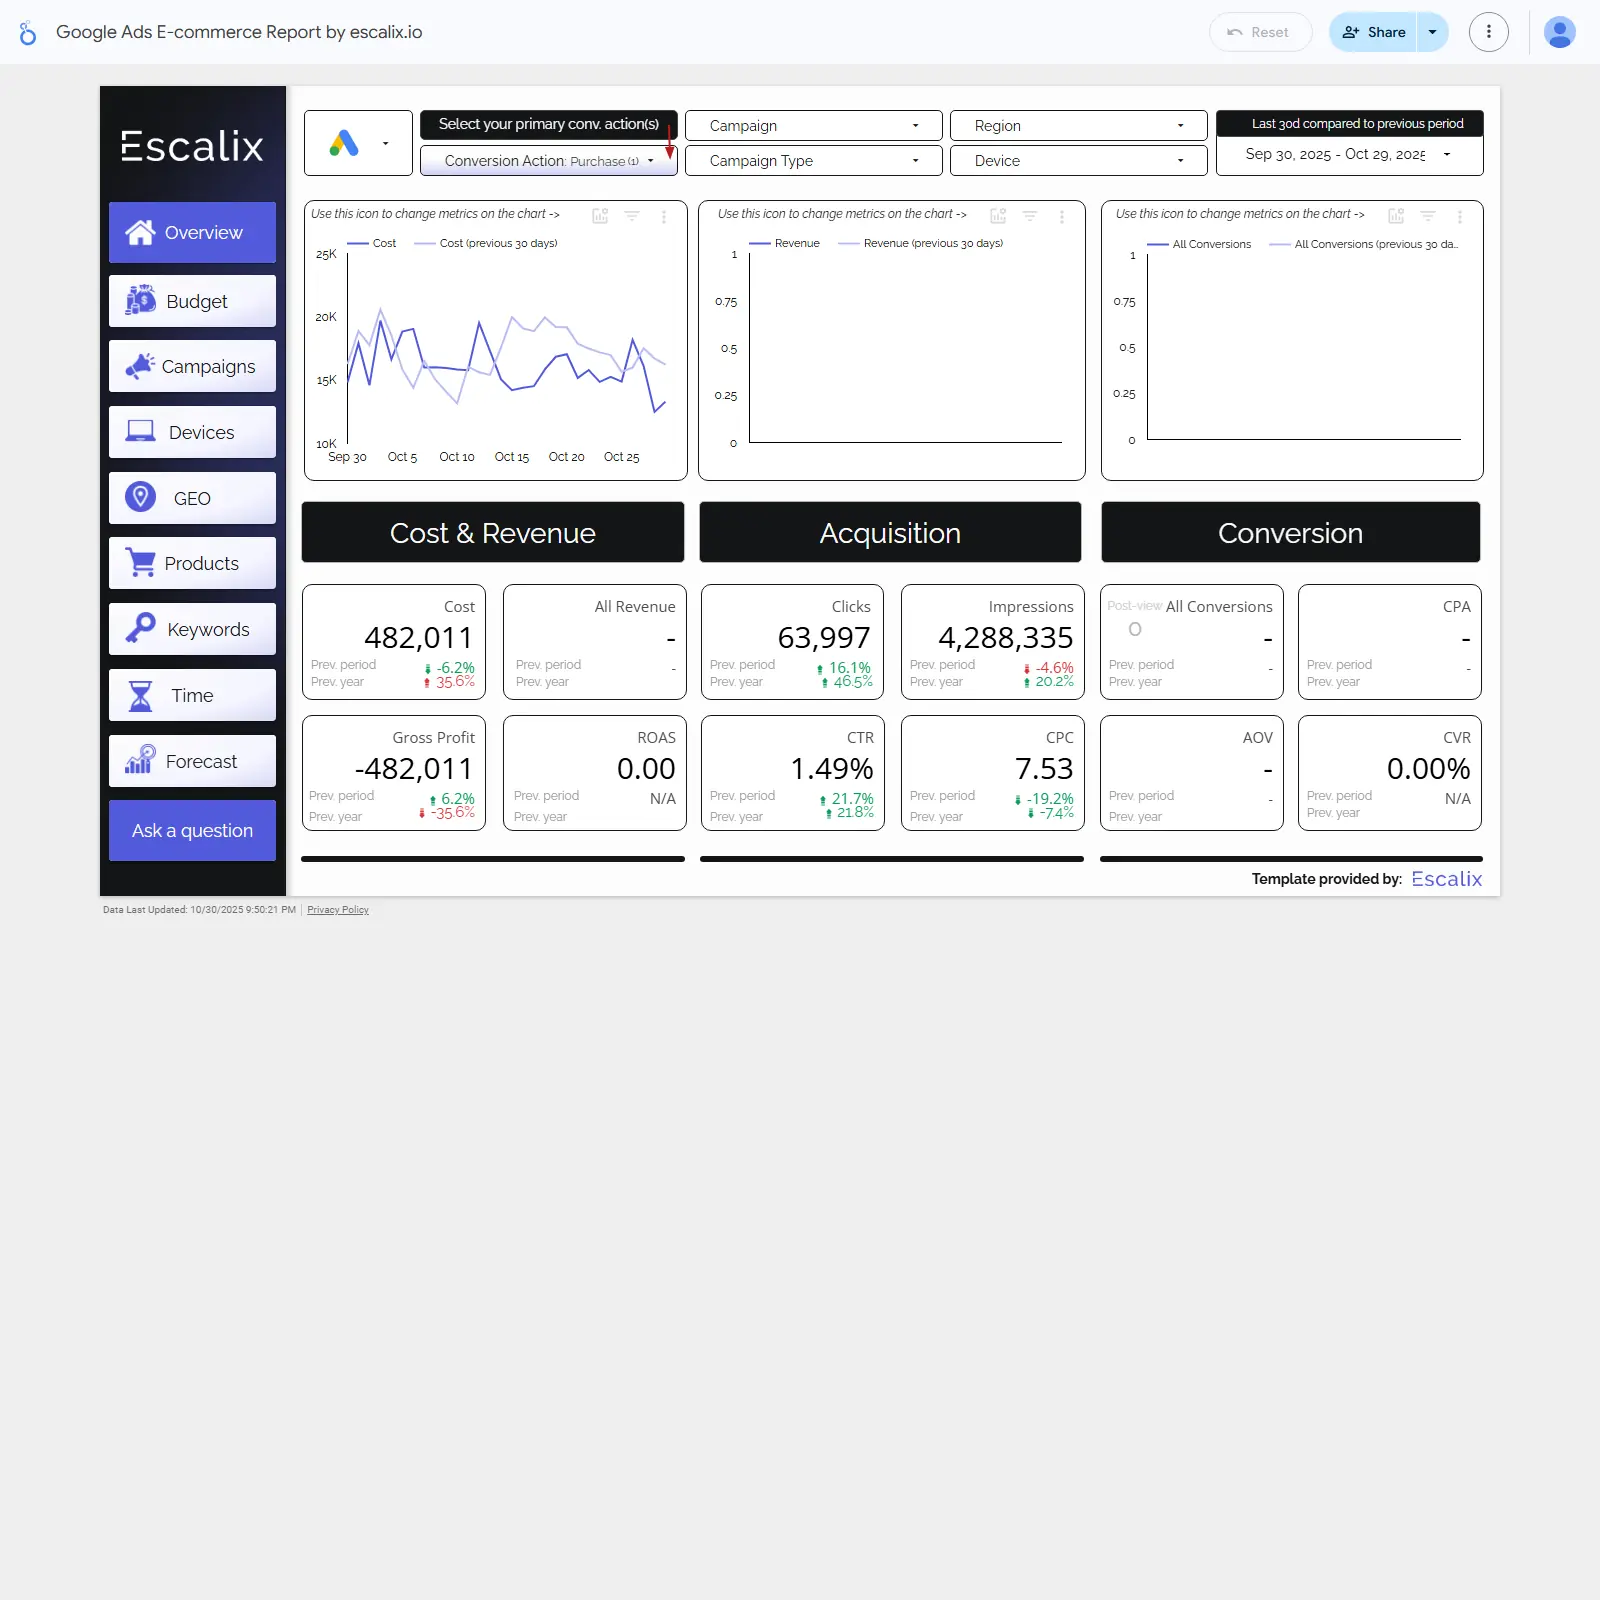
LinkedIn Ads analytics template for Looker Studio that consolidates campaign performance, delivery, engagement, and conversions into a clear, executive-ready view. Track impressions, clicks, CTR, CPC, CPM, cost, conversions, CPA, ROAS, and leads across campaigns, placements, and ad formats. Drill into demographics like industry, job function, seniority, company size, and regions to identify the audiences that drive the best results. Compare sponsored content, text ads, and video for engagement, views, and completions to spot top performers. Use the insights to refine targeting, optimize spend, and increase ROI on LinkedIn advertising.
Free
Klaviyo - Shopify and Fb Analysis cover image
Klaviyo - Shopify and Fb Analysis

Unified Klaviyo + Shopify + Facebook Ads analytics to monitor email engagement, funnel performance, and cross‑campaign results in one place.

Cross-channel analytics template for Klaviyo, Shopify, and Facebook Ads that unifies email, e‑commerce, and paid social performance in one view. Track engagement metrics like opens, clicks, bounces, spam complaints, and subscriber growth or churn to spot what triggers unsubscribes. Measure Shopify funnel health—from checkout starts to fulfilled orders—and connect Facebook lead quality to downstream conversions. Compare campaigns across platforms to identify underperformers, prioritize fixes, and optimize budgets. Ideal for marketers who need client-ready KPIs, campaign analysis, and email rate trends without stitching data together.
Free
Instagram Insights Looker Studio Template cover image
Instagram Insights Looker Studio Template

Instagram analytics for followers, reach, engagement, top posts/reels, audience actions, and best posting times.

Instagram Insights Looker Studio Template for tracking your account’s growth and engagement using Instagram Insights data. Monitor followers gained, reach, views, and how people interact with your profile (website, phone, directions). Identify top-performing posts and reels, see engagement split between feed and reels, and spot trends by day of week. Find the best time to post reels and understand what content your audience prefers. Built to help social media teams turn Instagram activity into clear, actionable insights.
€149
Free Hubspot Sales Funnel Dashboard Template for Looker Studio cover image
Free Hubspot Sales Funnel Dashboard Template for Looker Studio

HubSpot sales funnel dashboard tracking views-to-revenue, deal stages, and conversion trends in Looker Studio.

HubSpot Sales Funnel template for Looker Studio that maps the full journey from views to leads, opportunities, closed deals, and revenue. Highlights deal stage totals (prospect, negotiation, closed won/lost) to spot bottlenecks and prioritize follow-ups. Time-series charts reveal trends in traffic, lead volume, and conversion progress through the pipeline. Ideal for aligning marketing and sales around pipeline health and forecasting outcomes.
Free
Free Hubspot Marketing Dashboard Template for Looker Studio cover image
Free Hubspot Marketing Dashboard Template for Looker Studio

Free Looker Studio template for HubSpot Marketing that tracks email performance, engagement trends, campaign outcomes, and account-level insights.

HubSpot Marketing Dashboard for Looker Studio centralizes Marketing Hub data to monitor campaign performance and engagement. Track email KPIs (sent, delivered, opened), click-through rate, bounce and unsubscribe trends, and spam reports alongside deals closed and deal amounts. Company-level views surface domains, revenue, employee counts, and industry mix to profile target accounts. Visual layouts highlight trends and outliers so teams can optimize campaigns and tie marketing activity to revenue. Built by Windsor.ai, the template is free and white‑label.
Free
Google Calendar dashboard cover image
Google Calendar dashboard

Google Calendar analytics in Looker Studio to audit meeting load, availability, focus time, and scheduling patterns.

Google Calendar analytics template for Looker Studio that converts your event history into clear, actionable time insights. Track total meeting hours, availability percentage, recurring vs ad‑hoc mix, focus time and out‑of‑office, top meeting organizers, conferencing tools, and trends by day, week, and month. Surface overload and cancelation patterns, pinpoint who drives most meetings, and spot peak vs low workload periods. Identify natural focus windows to rebalance time allocation, increase deep work, and prevent burnout. Automated refresh via Coupler.io keeps insights current for ongoing planning.
Free
Local SEO report template cover image
Local SEO report template

Local SEO and Google Business Profile analytics to track rankings, reviews, and conversions across locations.

Local SEO performance tracking focused on Google Business Profile data—searches, views, calls, directions, website clicks, and review trends. Highlights local search rankings and keyword performance while tying ratings and reviews to visibility and conversions. Surfaces location-level insights to spot winners, fix weak listings, and keep citation consistency in check. Includes sections for searches and conversions, ratings and reviews, and an items tracker to optimize local inventory or services. Ideal for agencies and multi-location businesses aiming to grow foot traffic, reputation, and local visibility.
Free
GA4 Google Ads Dashboard cover image
GA4 Google Ads Dashboard

Unified GA4 + Google Ads dashboard for user behavior, revenue, and campaign performance with audience, keyword, and channel insights.

Unified Looker Studio template combining GA4 and Google Ads to analyze user behavior, conversions, revenue, and ad performance in one place. Covers audience, channel, device, and city-level insights plus keyword analysis, CPA/ROI trends, timelines, top pages, and drop-offs. Smart Interpretations flag notable trends and opportunities so you can optimize budgets and on-site experience faster. Ideal for marketers and analysts focused on growth and attribution clarity.
$214
GA4 Google Ads report focused on ecommerce cover image
GA4 Google Ads report focused on ecommerce

GA4 + Google Ads ecommerce reporting with MoM/YoY insights across sales, audience, acquisition, funnels, campaigns, and keywords.

Ecommerce performance tracking that unifies GA4 and Google Ads to reveal what drives users, sales, and revenue. Covers audience and acquisition trends, top pages, ecommerce performance, and conversion funnels with month‑over‑month and year‑over‑year comparisons. Dedicated Ads views spotlight campaign and keyword results to quickly spot winners and wasted spend. Highlights channel distribution and 12‑month sales patterns for faster decision‑making. Built around free GA4 and Google Ads connectors for a smooth setup.
$102.28
lespl Dashboard Mobile Ecommerce cover image
lespl Dashboard Mobile Ecommerce

Mobile GA4 ecommerce dashboard for revenue, buyers, funnel, and acquisition insights to find growth opportunities.

Mobile ecommerce performance dashboard focused on GA4 metrics to track sales and growth. Highlights revenue, buyers, sessions, and revenue per purchase, plus weekday transaction patterns. Visualizes trends for sessions, initiated purchases, and transactions alongside channel contribution and revenue by acquisition source. Includes a clear ecommerce funnel from add‑to‑cart through purchase and add‑to‑cart volume by weekday. Helps quickly spot top channels and checkout bottlenecks to optimize spend and conversion.
Free
Google Analytics 4 Template for Looker Studio cover image
Google Analytics 4 Template for Looker Studio

GA4 dashboard that turns traffic, engagement, conversions, and revenue into actionable insights across content, audiences, and channels.

Google Analytics 4 dashboard for Looker Studio focused on traffic, engagement, conversions, and revenue. Modules span Web Overview, Page Content, User Interaction, Achieved Goals, Channels, Audience Insights, and Growth Timeline. Monitor key events, event rate, session duration, bounce rate, device mix, channel performance, and city-level behavior with clean visuals and timelines. Smart interpretations highlight trends and opportunities to optimize acquisition and content. Built for marketers, business owners, and analysts who want sharper, faster decision-making from GA4 data.
$129
IKAUE GA4 AUDIT TOOL cover image
IKAUE GA4 AUDIT TOOL

GA4 audit template that checks limits, event setup, and tracking quality to prevent data loss and spot issues fast.

GA4 audit template focused on implementation health and limits across your property and data streams. Benchmarks event volume against GA4 rules—distinct event names, conversions, audience triggers, active-user audiences—and flags where you’re close to thresholds that cause sampling, high cardinality, or data loss. Audits events, campaigns, transactions, and enhanced ecommerce to uncover missing tags, duplicates, or misattribution. Provides practical context for each limit so you know what to fix and why. Ideal for analysts who want a fast, reliable pulse on GA4 data quality.
Free
Purchase Funnel Analyzer - Google Analytics 4 cover image
Purchase Funnel Analyzer - Google Analytics 4

GA4 eCommerce funnel dashboard for conversion rates, revenue, and channel performance.

GA4 eCommerce purchase-funnel analytics focused on conversion health and revenue impact. Track gross purchase revenue, ecommerce purchases, total users, first‑time purchasers, and AOV in one view. Compare Cart, Checkout, and Purchase conversion rates over time and diagnose drop‑offs. Break performance down by session source/medium with item views, add‑to‑cart, checkouts, purchases, revenue, and revenue share, with period‑over‑period and year‑over‑year trends.
Free
GA4 Redirection Monitoring Dashboard cover image
GA4 Redirection Monitoring Dashboard

Compare GA4 performance before vs after redirects or migrations to validate impact on traffic, behavior, conversions, and eCommerce.

GA4 Redirection Comparison template built for measuring pre‑ vs post‑change performance after redirects, redesigns, or CMS migrations. Compares sessions, engagement, conversions, eCommerce results, and acquisition channels to confirm impact. Highlights shifts in user behavior, device mix, page performance, and key website events to spot issues or wins. Guides stakeholders to validate redirect quality, protect revenue, and prioritize fixes using GA4 data.
Free
Google Analytics 4 GA4 Looker Studio Template cover image
Google Analytics 4 GA4 Looker Studio Template

GA4 Looker Studio template to analyze traffic, engagement, conversions, and ecommerce funnel performance.

GA4 web analytics template focused on website and ecommerce performance. Tracks core KPIs like sessions, engaged sessions, bounce rate, average session duration, conversions, and user conversion rate. Highlights trends, device mix, top acquisition channels, and top countries to uncover what drives traffic and outcomes. Includes pages for Acquisition, Engagement, Campaigns, Conversions, E‑commerce Overview, Shopping Funnel, and Products to follow the full journey from visit to purchase. Designed for quick, actionable insights for marketing and growth teams.
Free
GA4 Ecommerce Revenue Template cover image
GA4 Ecommerce Revenue Template

GA4 ecommerce dashboard for revenue, conversion, and customer insights by channel, device, and country.

GA4 Ecommerce Revenue Template focused on online store performance across revenue and customer metrics. Tracks users, conversion rate, transactions, customers, total revenue, average order value, revenue per customer, and revenue per user. Reveals trends over time and breaks results down by channel, device category, country, and customer type (first‑time vs returning). Includes views for funnel, customers, products, and acquisition to uncover growth levers and high‑value segments. Built for GA4 data to monitor profitability and scale confidently.
Free
Google Analytics dashboard for multiple properties cover image
Google Analytics dashboard for multiple properties

Unified GA4 dashboard for multiple properties with traffic, engagement, channel/source, device, and geo insights.

GA4 Looker Studio template that consolidates analytics from multiple properties into one clear view. Compare sessions, total users, new users, and average engagement time across channels, source/medium, devices, and countries. Track channel mix and source performance alongside a geo breakdown to pinpoint where growth and engagement come from. Ideal for teams managing several sites who need a single, current view of web performance to guide marketing and content decisions.
Free
GA4 Looker Studio Data Visualization Charts Demo cover image
GA4 Looker Studio Data Visualization Charts Demo

GA4 analytics and e‑commerce visualization template for sessions, revenue, channels, devices, and trend insights.

Comprehensive GA4 Looker Studio template focused on marketing and e‑commerce performance. Visualizes sessions, revenue, device categories, and channel groups with clear comparisons and stacked views to expose channel mix and device impact. Highlights trends over time with event annotations to explain spikes and drops. Organized sections cover basic, enhanced, content, geo, and goal charts to surface insights from acquisition to revenue. Ideal for marketers and analysts who need quick, actionable visibility into traffic, conversions, and growth drivers.
Free
All Traffic GA4 Report cover image
All Traffic GA4 Report

Identify and analyze AI-generated website traffic in GA4 across ChatGPT, Perplexity, Gemini, Claude, and Bard.

Measure AI-generated website traffic in GA4 and see exactly how visits from AI assistants impact your site. Break down sessions, users, pageviews, engagement rate, and average session duration by source such as ChatGPT, Perplexity, Gemini, Claude, and Bard. Identify which pages receive AI-driven visits and compare performance across tools. Track trends over time to spot growth or declines in AI referrals. Use these insights to prioritize content and optimize for discovery via AI assistants.
Free
AI traffic cover image
AI traffic

GA4 template to measure and compare website traffic and conversions coming from AI/LLM sources like ChatGPT, Gemini, Claude, Copilot, and Perplexity.

GA4 dashboard focused on traffic generated by AI/LLM sources like ChatGPT, Gemini, Claude, Copilot, and Perplexity. Compares sessions, users, views, bounce rate, engagement and session duration, plus conversions, transactions, and revenue from these referrers. Breaks down performance by each AI source and by referral paths, highlighting their share of total sessions and user impact. Includes 12‑month trends to spot growth and evaluate the value of AI-driven visits.
Free
Google Analytics 4 Report for Clients Ecommerce cover image
Google Analytics 4 Report for Clients Ecommerce

GA4 ecommerce client reporting focused on MoM/YoY KPIs, channel/device/demographic insights, and product and page performance.

GA4 ecommerce reporting template built for client updates, combining KPIs and trends on one streamlined report. Monitor users, sessions, new users, transactions, conversion rate, revenue, and AOV with clear MoM and YoY comparisons. Break down performance by acquisition channels, device, country, city, gender, and age to see what segments drive sales. Evaluate landing pages and top-selling products, plus daily revenue and sales with a baseline to spot spikes and drops. Includes a cover page for summaries and conclusions to turn insights into next steps.
$55.87
Ecommerce GA4 Annual Report with Text Fields cover image
Ecommerce GA4 Annual Report with Text Fields

Client-ready GA4 ecommerce annual report with YOY analysis across channels, audience, pages, and product sales, plus text fields for conclusions.

Ecommerce GA4 Annual Report template for online stores to deliver client-ready year-end insights. Covers transactions, revenue, conversion rate, monthly trends, and year-over-year comparisons for sessions, users, and sales. Breaks down results by acquisition channels, campaigns, device, country, demographics, and new vs. returning users, with top pages and landing pages plus improvements/declines. Adds an ecommerce section for items purchased, product yield, and conversion trends, and includes text fields and a cover page to write conclusions and recommendations.
$86.19
Google Ads report template for Looker Studio cover image
Google Ads report template for Looker Studio

A comprehensive Google Ads template that tracks key metrics and reveals top campaigns, audiences, devices, locations, and time-based trends for smarter optimization.

A Google Ads performance template for Looker Studio focused on tracking impressions, clicks, CTR, conversions, costs, CPC/CPM, CPA, and ROAS. Compare results across campaigns, ad groups, ads, keywords, and search terms to spot winners and waste. Break down performance by audience demographics, device, location, and network, and uncover time-of-day and day-of-week trends to refine scheduling. Surface top campaigns and ads to reallocate budget toward the highest ROI opportunities.
Free
Google Ads E-commerce Report by escalix io 2024 cover image
Google Ads E-commerce Report by escalix io 2024

Google Ads e‑commerce dashboard to track spend, revenue, ROAS, and conversions with breakdowns by campaign, region, device, and more.

Google Ads e‑commerce performance template focused on cost, revenue, ROAS, and gross profit alongside clicks, impressions, CTR, CPC, conversions, CPA, CVR, and AOV. Filters for primary conversion action, campaign, region, device, and campaign type make it easy to zero in on what drives results. Period comparisons highlight growth or declines across acquisition and conversion metrics. Navigation includes dedicated pages for Budget, Campaigns, Devices, GEO, Products, Keywords, Time, and Forecast to optimize spend and plan outcomes.
Free
Google Ads TrueView for Action Discovery Performance Insights cover image
Google Ads TrueView for Action Discovery Performance Insights

Google Ads performance insights for Discovery and TrueView for Action with trends, comparisons, and audience/ad-level analysis.

Performance insights for Google Ads Discovery and TrueView for Action campaigns at account, campaign, ad group, audience, and ad levels. Tracks clicks, cost, conversions, and cost per all conversions with daily trends and period-over-period comparisons. Surfaces spend and conversion efficiency to quickly spot winners and underperformers. Includes an ad approval view to monitor policy status and delivery risks. Designed for marketers optimizing YouTube and Discovery placements.
Free
Google Ads Display Network Performance Insights cover image
Google Ads Display Network Performance Insights

Comprehensive Google Ads Display Network template covering performance, trends, audiences, creatives, and bid/budget loss insights.

Google Ads Display Network performance template for monitoring results from account to asset level. Tracks clicks, cost, conversions, CTR, CPA, and impression share with day‑by‑day trends and comparison to the previous period. Breaks performance down by campaign types, ad groups, audiences, devices, locations, and demographics. Reviews creative and asset coverage to spot gaps and understand which formats and messages drive results. Highlights bid and budget loss to guide spend reallocation and scaling decisions.
Free
Google Ads Search Creative Performance Insights cover image
Google Ads Search Creative Performance Insights

Actionable insights for Google Ads search creatives—ad types, RSA assets and strength, policy approvals, and device/click trends—to improve performance.

Google Ads Search Creative Performance Insights tracks how each ad type performs across your account, with clear breakouts by device and click type. Review RSA asset strength and presence, understand which assets drive engagement, and spot gaps to test. Monitor policy approval status to prevent delivery issues and maintain coverage. Trend performance over time and use the campaign deep dive to pinpoint winners and underperformers. Ideal for optimizing creative mix, quality, and spend efficiency.
Free
Google Ads Shopping Product Performance cover image
Google Ads Shopping Product Performance

Google Ads Shopping analytics focused on revenue and profitability by type, category, brand, labels, and SKU.

Google Ads Shopping Product Performance template for tracking online and offline revenue and profitability across products. Analyze results by product type, category, brand, custom labels, and SKU with dedicated executive, product, brand, and category views. Compare recent periods (e.g., last 7 days vs previous) with calculations based on the latest 28 days. Pinpoint profit drivers, cut waste, and optimize product mix to improve efficiency for ecommerce and retail teams.
Free
Google Ads Break-even Analyzer cover image
Google Ads Break-even Analyzer

Ecommerce profitability dashboard with break‑even CPC/CVR/AOV and cost inputs for smarter campaign decisions.

Profit-focused ecommerce analytics template for Looker Studio that ties marketing performance to unit economics. Tracks key cost inputs like shipping per order, VAT, return rate, transaction fees, returning-customer share, and profit margin to show true profitability. Highlights break‑even CPC, required CVR, and target AOV so you know exactly what you can afford to pay for traffic and what levers to pull. Includes campaign, keyword, and search term views to spot winners and fix waste. Ideal for DTC brands and online stores that want to move beyond ROAS to real profit.
Free
Essential Google Ads Looker Studio Template cover image
Essential Google Ads Looker Studio Template

Google Ads performance dashboard to spot winners, cut waste, and grow ROI across campaigns, keywords, audiences, devices, and locations.

Essential PPC oversight for Google Ads across campaigns, keywords, audiences, devices, and locations. Tracks impressions, clicks, CTR, cost, conversions, conversion rate, cost per conversion, and conversion value/ROAS. Surfaces top and underperforming campaigns and costly keyword clusters, with clear time trends for week‑over‑week and month‑over‑month changes. Visualizes cost breakdowns and country performance to refine geo and device targeting. Built to steer budget toward what converts and cut wasted spend fast.
€149
Organic Facebook report 6 pages Metricool cover image
Organic Facebook report 6 pages Metricool

Measure Facebook organic performance, growth, content impact, and audience insights using Metricool data across six focused pages.

6-page Looker Studio template for analyzing Organic Facebook performance with Metricool data. Delivers month-over-month and year-over-year comparisons across followers, impressions, reach, engagement, reactions, page views, and publishing volume. Surfaces growth trends, daily performance, top posts and reels, and the days that drive the most follower gains and interactions. Breaks down results by content type and post vs. reels to guide format mix and scheduling, with detailed tables and clickable previews. Includes audience demographics by gender, age, country, and city, plus a 30-day Metricool trial code with purchase.
$78.02
Meta Ads creatives dashboard cover image
Meta Ads creatives dashboard

Creative-level Meta Ads analytics with KPIs and trends to compare, optimize, and scale ad performance.

Meta Ads creative performance tracking focused on comparing ads across campaigns and ad groups. Highlights the core KPIs marketers need—impressions, clicks, amount spent, CPC, CPM, CTR, and post engagement—to quickly identify winning and underperforming creatives. A detailed table ranks each ad by efficiency, while time‑series charts reveal trends for impressions vs. CPM, clicks vs. CPC, and spend dynamics. Helps pinpoint cost drivers, pacing issues, and optimization opportunities for higher ROI. Built for advertisers seeking clear, creative‑level insights.
Free
Facebook Ads report template for Looker Studio cover image
Facebook Ads report template for Looker Studio

End‑to‑end Facebook Ads analytics in Looker Studio, covering performance, conversions, ROAS, audiences, platforms, and time-of-day trends.

Facebook Ads performance tracking focused on spend, impressions, reach, clicks, CTR, CPC, and CPM across campaigns, ad sets, and creatives. Pinpoint top and underperforming ads using engagement signals (likes, comments, shares) and cost metrics, plus hourly and daily trends. Measure outcomes with purchases, cost per purchase, conversion value, and ROAS to understand efficiency and profitability. Compare results by audience demographics, device, country, and platform (Facebook, Instagram, Messenger, Audience Network) to refine targeting and budget. Built to surface clear, actionable insights for optimization and smarter allocation.
Free
Facebook Ads leads breakdown dashboard cover image
Facebook Ads leads breakdown dashboard

Looker Studio template to track Facebook Ads spend, funnel, and campaign/creative performance with metrics like CPL, ROAS, CTR, and lead value.

A Looker Studio template for Facebook Ads that consolidates data from Ads Manager into one view of spend, CPM, CPC, CTR, link clicks, leads, CPL, lead value, and ROAS. It visualizes the full funnel from impressions to conversions and includes a frequency meter to balance reach and avoid audience fatigue. Time-series trends, geographic insights, and a campaign/ad set/creative breakdown make it easy to spot winners and bottlenecks. Designed for marketers and agencies to compare performance across segments and reallocate budget with confidence.
Free
Ahrefs Looker Studio Template cover image
Ahrefs Looker Studio Template

Ahrefs-powered Looker Studio template to track keyword rankings, backlinks, domain rating, and site health in one view.

Ahrefs Looker Studio Template for tracking SEO performance across rankings, backlinks, and technical health using Ahrefs data. Monitor organic traffic, keyword counts, average positions, share of voice, and top pages by domain rating. Analyze backlink trends, referring domains, dofollow vs. nofollow split, anchor text distribution, and backlink types. Audit site health with errors, warnings, redirects, non‑indexable pages, HTTPS issues, and overall health score to prioritize fixes. Ideal for presenting monthly results and spotting growth opportunities at a glance.
€149
GA4 Insights cover image
GA4 Insights

GA4 Insights template for tracking users, engagement, channels, content, locations, and conversions with period and year comparisons.

GA4 Insights connects to your Google Analytics 4 data to surface clear, actionable performance insights for websites and apps. Key metrics like users, sessions, pageviews, engagement rate, and transactions are highlighted with trend analysis to spot changes over time. Organized into Overview, Content Analysis, Channel Exploration, Location, and Conversions pages, with quick period-over-period and year-over-year comparisons. Pinpoint top channels, best-performing content, regional audiences, and conversion outcomes to guide marketing and product decisions. Polished, brand-friendly design makes it easy to share with stakeholders.
$79|$99