Looker Studio Report Gallery

The best free & paid Looker Studio templates, curated and quality-ranked for data reporting.

Showing 481 - 520 of 552

Tik Tok Ads Performance Overview Report cover image
Tik Tok Ads Performance Overview Report

Single-page TikTok Ads dashboard in Looker Studio to track KPIs, trends, geo/device insights, and conversion efficiency.

Single-page Looker Studio template for tracking TikTok Ads performance across key KPIs like impressions, clicks, spend, CPC, and cost per conversion. Visualizes trends over time with line charts and a campaign performance table for quick comparisons. Highlights conversion efficiency with a CPC vs. cost-per-conversion view to guide bidding and budget shifts. Includes geographic and device breakdowns to spot high-impact markets and platforms. Built to help marketers pinpoint what’s working and scale winning campaigns fast.
Free
TikTok Ads - Quickview cover image
TikTok Ads - Quickview

One-page TikTok Ads overview to monitor reach, engagement, conversions, and top-performing ads in real time.

One-page TikTok Ads quickview template for Looker Studio that highlights reach, engagement, and outcomes at a glance. Track impressions, clicks, conversions, and identify your most shown and top-performing ads to spot winners fast. Powered by Catchr’s TikTok Ads connector, it pulls real-time metrics and dimensions so performance stays current. Ideal for marketers and agencies who need a clean, fast pulse on campaign impact.
Free
Spotify Ads Overview cover image
Spotify Ads Overview

Executive overview of Spotify Ads performance with key KPIs and trends by campaign.

Spotify Ads Overview centralizes your Spotify Ads performance into a clean, executive-ready view. Monitor core KPIs across campaigns to understand costs, engagement, and efficiency at a glance. Compare performance over time to spot trends, optimize budgets, and refine creative and audience targeting. Built for marketers who need quick, reliable insights for decision-making and client reporting.
Free
Reddit public data reporting template cover image
Reddit public data reporting template

Reddit Post Overview to monitor posts, comments, upvotes, and top-performing posts for social listening and content research.

Reddit analytics template focused on post performance and engagement. Track volume trends for posts, comments, and upvotes to spot momentum and campaign impact. Surface top-performing posts to identify themes, opportunities, and conversation drivers. Built for social listening, brand monitoring, competitor tracking, and content ideation.
Free
Pinterest Ads Overview v3 cover image
Pinterest Ads Overview v3

Pinterest Ads analytics template for Looker Studio with real‑time KPIs and campaign/ad group performance.

Pinterest Ads Overview V3 is a Looker Studio template built to analyze Pinterest advertising performance at a glance. Connect your Pinterest Ads through Catchr to sync all metrics and dimensions in real time. Monitor top‑level KPIs and dive into campaign and ad group performance to find winners and reduce waste. Compare results over time and share clear insights with stakeholders. Ideal for marketers who need fast, visual Pinterest Ads reporting without code.
Free
Pinterest public data reporting template cover image
Pinterest public data reporting template

Public Pinterest analytics covering top boards, content performance, audience, and engagement.

Pinterest Public Overview focuses on public Pinterest analytics to understand how a profile performs. It highlights top boards and summarizes content performance, audience size, and engagement activity such as saves and likes. Use it to spot which boards and pins attract attention and benchmark against competitors. Ideal for social media teams, brands, and agencies monitoring public Pinterest presence.
Free
Outbrain campaign performance reporting template cover image
Outbrain campaign performance reporting template

Outbrain Amplify performance dashboard covering clicks, conversions, cost, top campaigns, and device-type results.

Outbrain Amplify campaign analytics focused on performance and cost efficiency. Tracks clicks, conversions, and cost alongside CTR, CPM, spend, impressions, and total conversions. Highlights top campaigns and device-type splits to reveal where budget and engagement are strongest. Built for performance marketers optimizing Outbrain native advertising.
Free
Template Microsoft Ads - Overview - V2 cover image
Template Microsoft Ads - Overview - V2

One-page Looker Studio overview for Microsoft Ads with key KPIs and campaign/ad group performance.

One-page Looker Studio template for Microsoft Ads that delivers a quick performance overview. Brings together essential KPIs, trend widgets, and a date control to monitor account health at a glance. Campaign and ad group sections highlight performance so you can spot winners and underperformers fast. Powered by Catchr’s Microsoft Ads connector for no‑code, real-time data syncing. Ideal for marketers and leaders who want presentation-ready insights without building from scratch.
Free
Template Mailchimp - Campaign Overview cover image
Template Mailchimp - Campaign Overview

Mailchimp campaign overview in Looker Studio with real‑time KPIs like emails sent and opens for quick performance tracking.

A focused Mailchimp campaign overview for Looker Studio that brings your key email KPIs into one place. Track emails sent and opens by campaign, spot engagement trends, and quickly identify top performers. Real‑time syncing through Catchr keeps results up to date for confident reporting. Perfect for marketers who need fast, shareable insights to optimize content and timing.
Free
Template Klaviyo - Campaign Overview cover image
Template Klaviyo - Campaign Overview

Klaviyo campaign performance overview in Looker Studio with real-time metrics and easy stakeholder sharing.

Klaviyo – Campaign Overview centralizes your Klaviyo email performance in Looker Studio so you can monitor key campaign KPIs and trends at a glance. Compare engagement by campaign (e.g., emails sent and opens) and track results over time with a date-range control. Built on Catchr’s Klaviyo connector, data syncs in real time so your reporting stays current. Ideal for sharing performance with stakeholders and highlighting what’s working across campaigns.
Free
Instagram Followers cover image
Instagram Followers

Instagram follower demographics and location insights in Looker Studio, including age, gender, and city/country breakdowns.

Instagram Followers for Looker Studio focuses on audience insights, giving a clear view of who follows your account and where they’re from. Explore follower breakdowns by age, gender, age-by-gender, country, and city to understand your community and refine targeting. Track how many followers you have and identify key segments to guide content and growth decisions. Demographic breakdowns require at least 100 followers.
Free
HubSpot email marketing performance template cover image
HubSpot email marketing performance template

HubSpot email marketing performance dashboard with KPIs, funnel analysis, and campaign-level results.

Track HubSpot email campaign performance at a glance. Monitor core KPIs including successful deliveries, open rate, clicks, CTR, and unsubscribe rate. Visualize the email funnel from sent to delivered, opened, and clicked to spot drop‑offs and improve engagement. A campaign table breaks down results by date and campaign, covering sends, deliveries, clicks, and unsubscribes alongside a panel for contacts created. Ideal for marketers who need quick, actionable insights from HubSpot email data.
Free
Template Google Business Profile V2 cover image
Template Google Business Profile V2

Tracks Google My Business search impressions, star rating, reviews, and Q&A for fast daily monitoring.

Monitor local visibility and reputation from Google My Business in one place. Track search impressions over time alongside star rating, customer reviews, and questions/answers to spot trends and respond faster. Identify spikes in engagement and understand how customer feedback impacts brand perception. Designed for quick daily check-ins that help local teams prioritize replies and improvements.
Free
Mobile Friendly Scoreboard cover image
Mobile Friendly Scoreboard

SEO and paid search performance overview with branded vs non‑branded split, top queries, and engagement KPIs.

Search and acquisition performance overview combining Google Search Console, Google Ads, and Google Analytics data. Track average position, impressions, and clicks with a branded vs non‑branded split to gauge visibility and intent. Identify top organic queries and top paid search terms to prioritize optimizations. Monitor sessions, pages per session, and bounce rate to evaluate traffic quality, with simple date comparisons for trend analysis.
Free
GA4 Revenue Exploration Report cover image
GA4 Revenue Exploration Report

GA4 revenue analysis template that breaks down sales by date, brand, item, device, medium, and country.

Single page GA4 Looker Studio template for deep revenue exploration across ecommerce dimensions. Track revenue trends by date with previous‑period comparison. Break down performance by brand, item, device, traffic medium, and country to pinpoint where revenue grows or drops. Surface top products and channels and spotlight gaps to optimize merchandising and acquisition. Built for teams that want quick, actionable revenue insights from GA4 data.
Free
Google Analytics 4 website performance dashboard cover image
Google Analytics 4 website performance dashboard

GA4 template highlighting users, new users, conversions, and sessions by traffic source.

Google Analytics 4 performance template focused on acquisition and engagement metrics. Highlights total users, new users, and conversions with a clear breakdown of sessions by traffic source. Helps marketing and product teams pinpoint which channels drive growth and where user activity is changing. Ideal for monitoring website or app momentum and prioritizing channels that impact results.
Free
Google Analytics 4 cover image
Google Analytics 4

GA4 Looker Studio template to monitor traffic, channels, and user engagement across Overview, Acquisition, Engagement, and Users.

GA4 Looker Studio template focused on website analytics, covering the essentials across Overview, Acquisition, Engagement, and Users. Track traffic trends, top channels, and campaign performance alongside user behavior and content interaction. Surface key KPIs like sessions, users, conversions, and engagement metrics to pinpoint what’s working and where to optimize. Ideal for marketing and product teams that need quick, actionable views of GA4 data. Built for decision-making with clean layout and easy navigation between core insight areas.
Free
Google Ads Overview Report cover image
Google Ads Overview Report

Google Ads overview in Looker Studio with trend lines, KPI scorecards, and cross-account comparisons for impressions, clicks, and CTR.

Track Google Ads performance at a glance with a Looker Studio overview focused on the essentials. See trends for impressions and clicks with clean line charts, get headline KPIs via scorecards, and compare impressions and CTR across accounts in one view. Spot spikes, dips, and underperforming accounts faster to prioritize optimization. Ideal for PPC teams and stakeholders who want a fast read on campaign health.
Free
Google Ads Monitoring Report cover image
Google Ads Monitoring Report

A focused Google Ads dashboard for tracking CTR, CPC, bounce rate, impressions, pageviews, campaigns, and top ads with geo and device insights.

Monitor Google Ads performance at a glance with key KPIs like impressions, CTR, CPC, bounce rate, and average pageviews plotted over time. Identify winning and underperforming campaigns with a concise campaign overview and Top Ads table. Uncover where results come from using country and device insights. Built to handle multiple ad accounts so teams can keep a single view of ad health and trends.
Free
Google Ads Search Query Performance cover image
Google Ads Search Query Performance

Google Ads search query performance with period-over-period KPIs and a detailed query view for optimization.

Google Ads search query performance focused on the terms that trigger your ads, tracking clicks, impressions, cost, CTR, CPC, and conversions. A performance snapshot compares results with the previous period to surface rising or declining trends. The detailed query view highlights high-cost, low-return searches and opportunities for negative keywords or new targets. Insights guide bid, budget, and match-type adjustments across campaigns and ad groups. Built for PPC managers who want fast, actionable search term insights.
Free
Google Ads Device Performance cover image
Google Ads Device Performance

Google Ads device performance across devices with clicks, conversions, cost, CTR, and period comparisons.

Google Ads device performance template focused on tracking clicks, conversions, cost, CTR, and conversion rate by device type. Compare current period with the previous period to spot trends and shifts. Visuals cover conversions by device, clicks by device, CTR and conversion rate by device, and cost by day and device. A dedicated deep dive highlights device-level changes versus the prior period. Use it to identify high-ROI devices and adjust bidding and budgets quickly.
Free
Google Ads Ad Type Insights cover image
Google Ads Ad Type Insights

Google Ads performance by ad type with CTR, cost, clicks share, top campaigns, and daily cost trends.

Google Ads Ad Type Insights compares performance across ad formats to reveal what drives traffic and efficiency. Track CTR by ad type, share of clicks versus average cost, and day‑by‑day cost trends. Surface top campaigns with ETA CTR and a concise ad type overview. Use the insights to shift budget, refine creatives, and retire underperforming formats.
Free
Google Ads Video Performance cover image
Google Ads Video Performance

Monitor Google Ads video campaign KPIs and trends by campaign and ad group to optimize spend.

Google Ads Video Performance template focused on evaluating video campaign results at overview, campaign, and ad group levels. Tracks core KPIs such as views, impressions, view rate, CPV, cost, clicks, and conversions with a performance snapshot and daily trend charts. Identifies high‑ and low‑performing campaigns and ad groups to guide budget shifts and creative or targeting fixes. Date range control and an optional notes section support weekly readouts and change tracking. Built for marketers managing Google Ads video campaigns across YouTube inventory.
Free
Template Google Ads Overview V2 cover image
Template Google Ads Overview V2

Google Ads overview template tracking spend, efficiency, and campaign performance with clear KPIs and weekly trends.

A polished Looker Studio template for monitoring Google Ads performance across spend, impressions, clicks, CPM, CPC, and CTR. Break down investment, impressions, and clicks by campaign to see where budget and results concentrate. Review weekly trends and overall campaign performance to catch spikes, dips, and efficiency changes. Presentation-ready visuals make it easy to communicate outcomes to stakeholders.
Free
Google Ads KPIs cover image
Google Ads KPIs

Essential Google Ads KPIs across overview, campaign, keyword, and user views to monitor performance and optimize spend.

A focused Google Ads KPI dashboard for Looker Studio that highlights spend, clicks, impressions, CTR, CPC, and conversions across key views. Includes overview, campaign, keyword, and user tabs to compare performance, surface top campaigns, and spot cost or CTR trends over time. Designed to help identify winners, underperformers, and optimization opportunities quickly. Built for live Google Ads data via Catchr so insights stay up to date.
Free
Facebook insight performance overview cover image
Facebook insight performance overview

Quarter-over-quarter Facebook Page analytics covering growth, engagement, and reaction breakdowns with organic vs. paid insights.

Quarter-over-quarter Facebook Page performance comparison with flexible month selection to benchmark progress over time. Tracks growth metrics like fan adds, reach, paid reach, impressions, and paid impressions to highlight organic vs. paid impact. Measures audience engagement with post engagements, engaged users, and overall page performance. Breaks down reactions—like, love, haha, wow, sorry, anger—into positive and negative actions to spot sentiment shifts. Helps pinpoint trends, content winners, and areas needing attention across awareness and engagement.
Free
Template Facebook Organic - QuickView V2 cover image
Template Facebook Organic - QuickView V2

Quick KPI overview for Facebook Pages covering engagement, fan growth, and daily activity in Looker Studio.

QuickView V2 focuses on the core Facebook Page KPIs that matter: post engagement, total fan count, and daily fan activity. Built for Looker Studio with Catchr’s connector, it pulls your Facebook Pages data in real time for a clean, high-level view. Ideal for social media managers and marketers who need fast insight into audience growth and content performance. Use it to spot spikes, diagnose dips, and guide your next content moves.
Free
Facebook Ads report template for Looker Studio by Heineken cover image
Facebook Ads report template for Looker Studio by Heineken

A Looker Studio template to analyze Facebook Ads performance, conversions, and ROI like the Heineken team.

A Facebook Ads performance template for Looker Studio modeled on the dashboards used by Heineken. Tracks core PPC metrics—impressions, clicks, spend, CTR, CPC, CPM, reach, frequency, conversions, and cost per conversion—across campaigns, ad sets, and ads. Surfaces which creatives, audiences, devices, and objectives drive the most engagement and conversions. Supports ROI-focused analysis with views like reach vs. amount spent and detailed performance drilldowns. Built for marketers and agencies who need fast, client-ready insights from Meta campaigns.
Free
Facebook Ads cover image
Facebook Ads

4-page Looker Studio template to analyze Facebook Ads by campaign, audience, and creative with real-time KPIs.

4-page Looker Studio template for analyzing Facebook Ads performance end to end. Track core KPIs like spend, impressions, clicks, CTR, CPC, conversions, CPA, and ROAS across dates and campaigns. Explore dedicated views for campaign, audience, and creative performance with sections for Overview, Views, Clicks, and Results. Connect via Catchr’s Facebook Ads integration to pull real-time metrics and dimensions. Use it to spot winning ads, optimize budgets, and refine targeting fast.
Free
Capterra PPC cover image
Capterra PPC

Capterra PPC performance tracking with time, country, channel, and category breakdowns.

Capterra PPC Overview by Supermetrics tracks paid campaigns on Capterra with clear views of overall results, trends, and audience splits. Analyze performance over time and compare results by country to spot market opportunities. Break down outcomes by channel and category to pinpoint where budgets work best. Built for marketers who want fast insight into what’s driving conversions and efficient spend on Capterra.
Free
Template Brevo Campaign Insight cover image
Template Brevo Campaign Insight

Brevo (Sendinblue) email campaign insights in Looker Studio to monitor sends, opens, clicks, bounces, and unsubscribes.

Brevo (formerly Sendinblue) campaign analytics focused on email performance, built for Looker Studio. Track core KPIs such as sends, deliveries, opens, clicks, bounces, and unsubscribes to measure deliverability and engagement. Compare campaigns over time to spot wins, diagnose drops, and refine content and targeting. Powered by Catchr’s Brevo connector, the data stays synced in real time for up‑to‑date insights. Ideal for marketing teams that need a clear view of campaign results and actionable next steps.
Free
Google Search Console Dashboard 1 cover image
Google Search Console Dashboard 1

Track GSC impressions, clicks, CTR, and top queries/pages to uncover SEO opportunities across countries and devices.

Monitor Google Search Console metrics—Impressions, Clicks, and CTR—to gauge SEO visibility and engagement at a glance. Spot trends over time and compare markets and devices to find where your site underperforms. Surface high‑potential queries and pages to prioritize content updates, meta improvements, and CTR boosts. Understand audience intent and refine targeting by seeing what people search and how they interact on different devices. Built for marketers and SEO teams who want quick, client‑ready insights to guide next actions.
Free
Tiktok Ads video views performance cover image
Tiktok Ads video views performance

One-page Looker Studio template to analyze TikTok Ads video views by campaign and ad.

Track TikTok Ads video performance in Looker Studio with a focused one-page view of video views and trends. Compare campaigns and ads to see which creatives drive the most views and pause underperformers. Monitor cumulative video view percentage and break down views by ad to catch issues early. Works with Catchr’s TikTok Ads connector for real‑time KPIs and a smooth data pull.
Free
Snapchat Ads - Overview cover image
Snapchat Ads - Overview

A Looker Studio template to monitor Snapchat Ads KPIs and compare campaign and audience performance in real time.

Snapchat Ads performance overview for marketers who want quick, actionable insight across campaigns, ad sets, and creatives. Track essential KPIs like spend, impressions, swipes, CTR, CPA, conversions, and ROAS with at‑a‑glance scorecards and detailed breakdowns. Compare campaign and audience performance to spot winners and optimize budgets. Powered by Catchr’s connector for seamless, real‑time data sync into Looker Studio. Ideal for consolidating Snapchat Ads results into a clean, decision‑ready view.
Free
Sales Dashboard cover image
Sales Dashboard

Sales analytics dashboard covering demographics, category performance, top cities, shipping popularity, and payment mix to pinpoint growth opportunities.

Sales analytics template focused on understanding revenue drivers across customers, categories, and locations. Sections cover core sales, customer demographics, product category analysis, and customer behavior. Key views include shipping method popularity across the year, orders by payment methods, and top cities ranked by sales and profit with category breakdown. Use it to spot high‑performing cities and categories, optimize shipping and payment mix, and target the right customer segments. Ideal for commerce teams needing fast, actionable insights for growth and allocation decisions.
Free
Google Ads Overview Report cover image
Google Ads Overview Report

Google Ads performance overview covering CTR, conversions, CPC/CPM, top campaigns, and device breakdown.

Google Ads overview template for monitoring PPC performance across the funnel. Covers CTR and impressions, conversion rate and cost per conversion, plus CPC and CPM with trend views. Surfaces top campaigns and a device breakdown for clicks, cost, and conversions to reveal where budget works best. Designed to quickly spot inefficiencies, control spend, and scale winning campaigns.
Free
Google Ads Geographic Performance cover image
Google Ads Geographic Performance

Google Ads geographic analysis with regional comparisons and period-over-period trends.

Focuses on Google Ads results by geography to reveal where campaigns perform best. Compares account performance versus the previous period and highlights regional trends. Provides region-level views for conversions and overall performance to spot high- and low-value locations. Useful for optimizing location targeting, reallocating budgets, and planning market expansion.
Free
Facebook Organic Performance Dashboard cover image
Facebook Organic Performance Dashboard

Monitor Facebook page reach, engagement, reactions, and video performance with clear KPIs and trend visuals.

Facebook Insights Performance Dashboard focuses on page performance across reach, impressions, engagement, and reactions. Track trends for total and unique video views, day-by-day likes, and engaged users, with quick KPI callouts for context. Review reaction breakdowns (like, love, haha, wow, sorry, anger) to gauge audience sentiment. Analyze individual video posts with titles, descriptions, and permalinks. Compare current results against the previous period to spot momentum and dips fast.
Free
Apple Search Ads - Overview cover image
Apple Search Ads - Overview

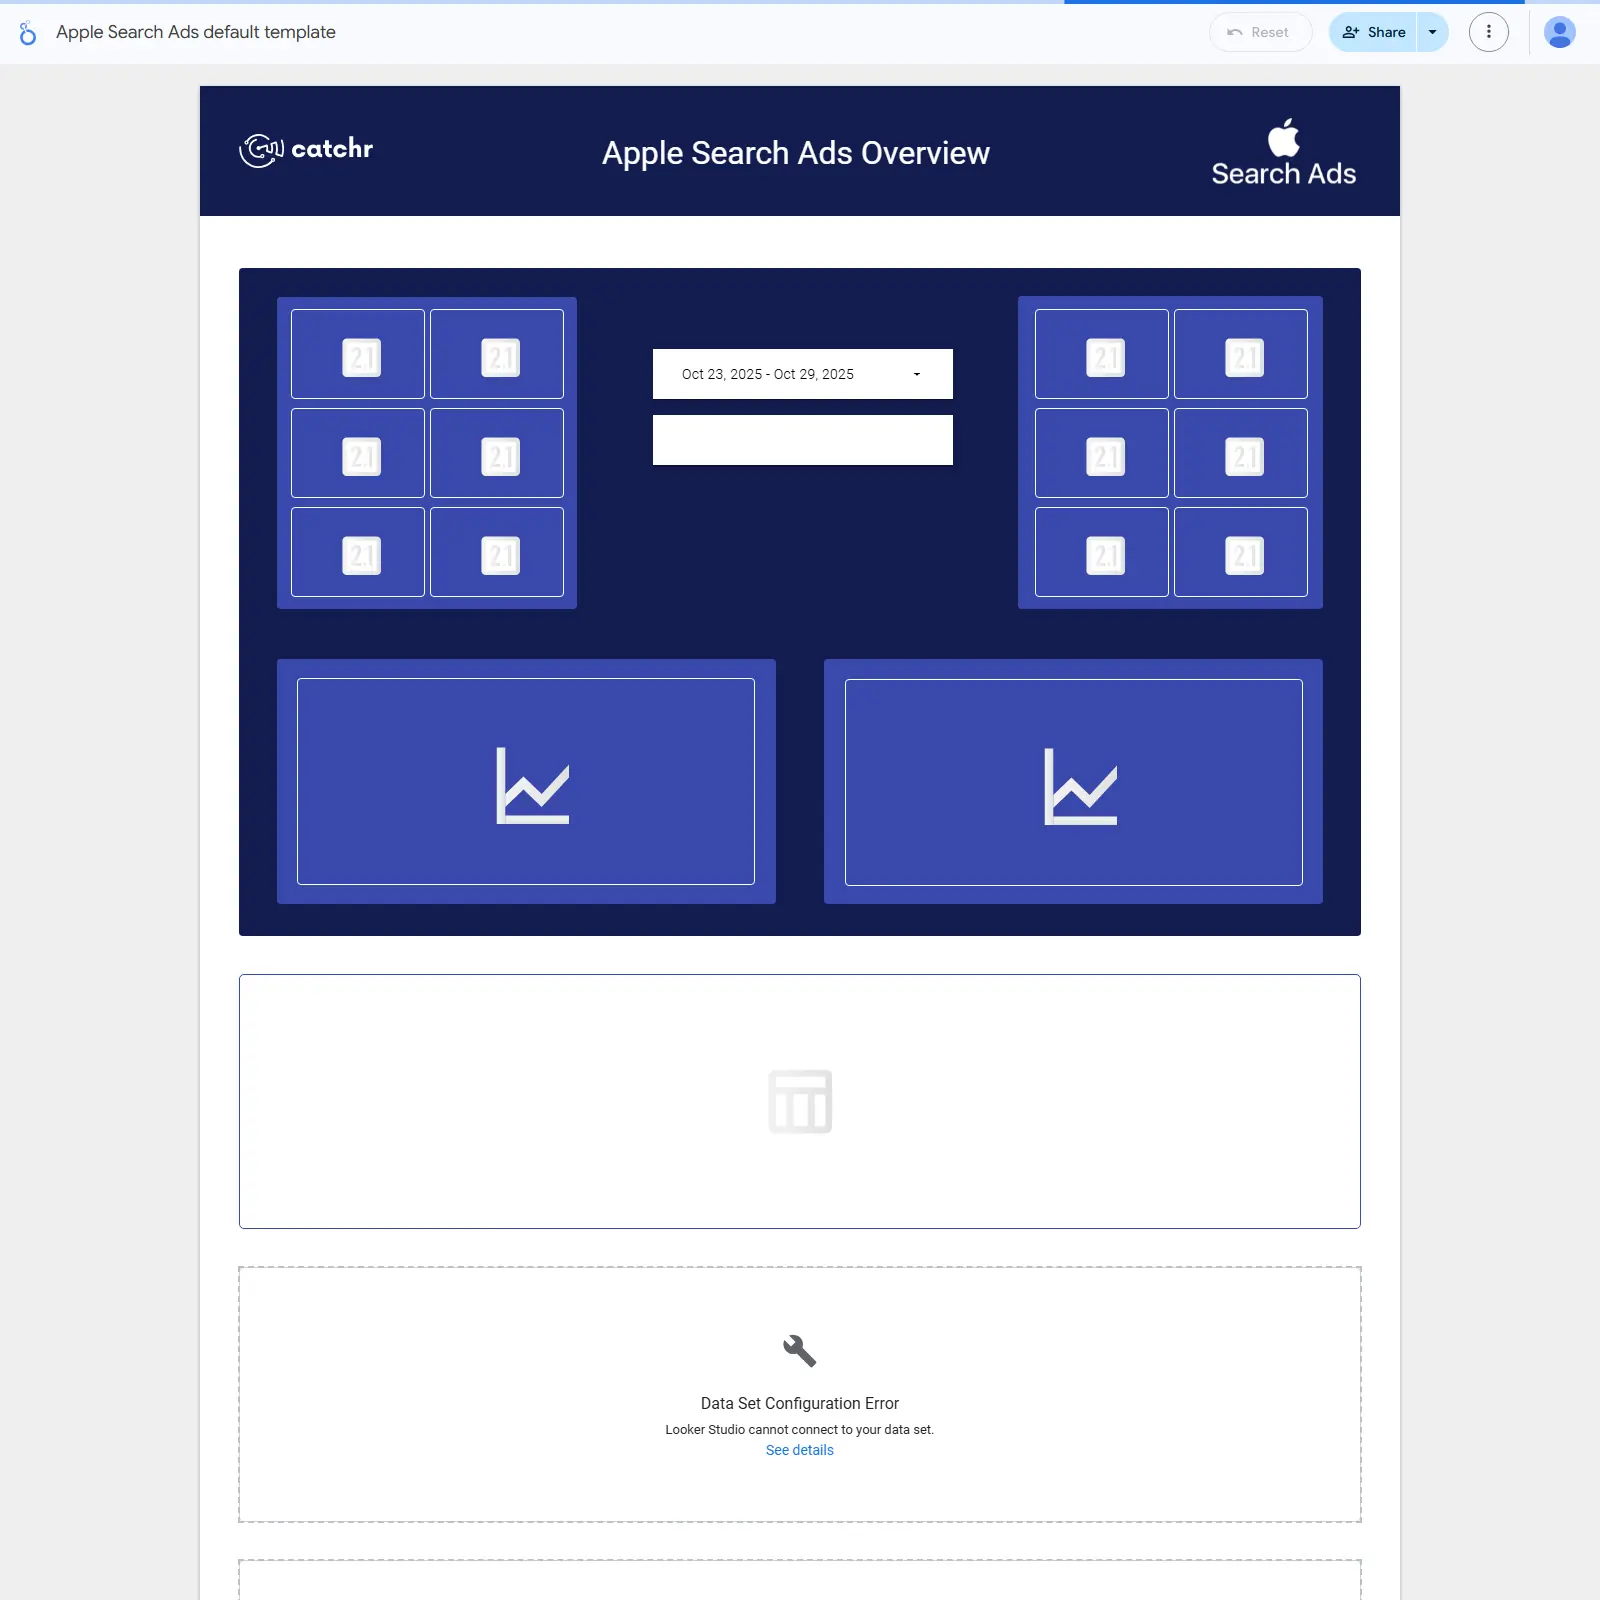
Apple Search Ads performance overview with real-time KPIs and trends across campaigns, ad groups, and keywords.

Apple Search Ads Overview for Looker Studio centralizes your ASA performance in one place. Track essential KPIs—spend, impressions, taps, CTR, installs, cost-per-tap, cost-per-acquisition, and conversion metrics—across campaigns, ad groups, keywords, and search terms. KPI tiles, trend charts, and a date selector make it easy to spot performance shifts and compare periods. Powered by Catchr’s no‑code connector, data updates in real time for dependable monitoring. Perfect for marketers optimizing budgets, bids, and keyword coverage.
Free
Template Tiktok Quickview cover image
Template Tiktok Quickview

Quick TikTok performance snapshot covering followers, views, likes, reach, engagement, and post-level breakdown with optional Ads outcomes.

TikTok Quickview focuses on a fast snapshot of TikTok performance for brands and creators. Track core KPIs such as followers, video views, likes, reach, and engagement, with a breakdown by post to spot top content. Integrates TikTok Ads data via Catchr to combine organic results with ad outcomes. Real‑time updates keep metrics current for quick check‑ins and reporting. Ideal for social media managers and marketers who need a simple, high‑level TikTok overview.
Free