Looker Studio Report Gallery

The best free & paid Looker Studio templates, curated and quality-ranked for data reporting.

Showing 281 - 320 of 552

Mailchimp template for Looker Studio cover image
Mailchimp template for Looker Studio

Mailchimp analytics template for Looker Studio covering campaign, list, subscriber, domain, location, and link engagement insights.

Mailchimp performance template for Looker Studio focused on campaign, list, and subscriber analytics. Track emails sent, opens, clicks, CTR, CTOR, bounces, and unsubscribes across campaigns and lists. Compare domains, countries, and regions to find where engagement is strongest, and review link-level clicks to refine content. Explore time-of-day and day-of-week patterns to pinpoint the best send times. Built with the Reporting Ninja Mailchimp connector for a unified, actionable view of email marketing results.
Free
LinkedIn Ads creatives dashboard cover image
LinkedIn Ads creatives dashboard

LinkedIn Ads creatives analysis with ad-level metrics, trend charts, and spend efficiency insights.

LinkedIn Ads creatives performance tracking focused on comparing ad-level results across campaigns. Monitor impressions, clicks, CTR, CPC, CPM, spend, conversions, and engagement to spot winning creatives and underperformers. Trend charts for impressions vs. CPM, clicks vs. CPC, and spend dynamics reveal pacing and efficiency over time. Ideal for marketers and agencies optimizing LinkedIn ad messaging, visuals, and budgets.
Free
HubSpot report template cover image
HubSpot report template

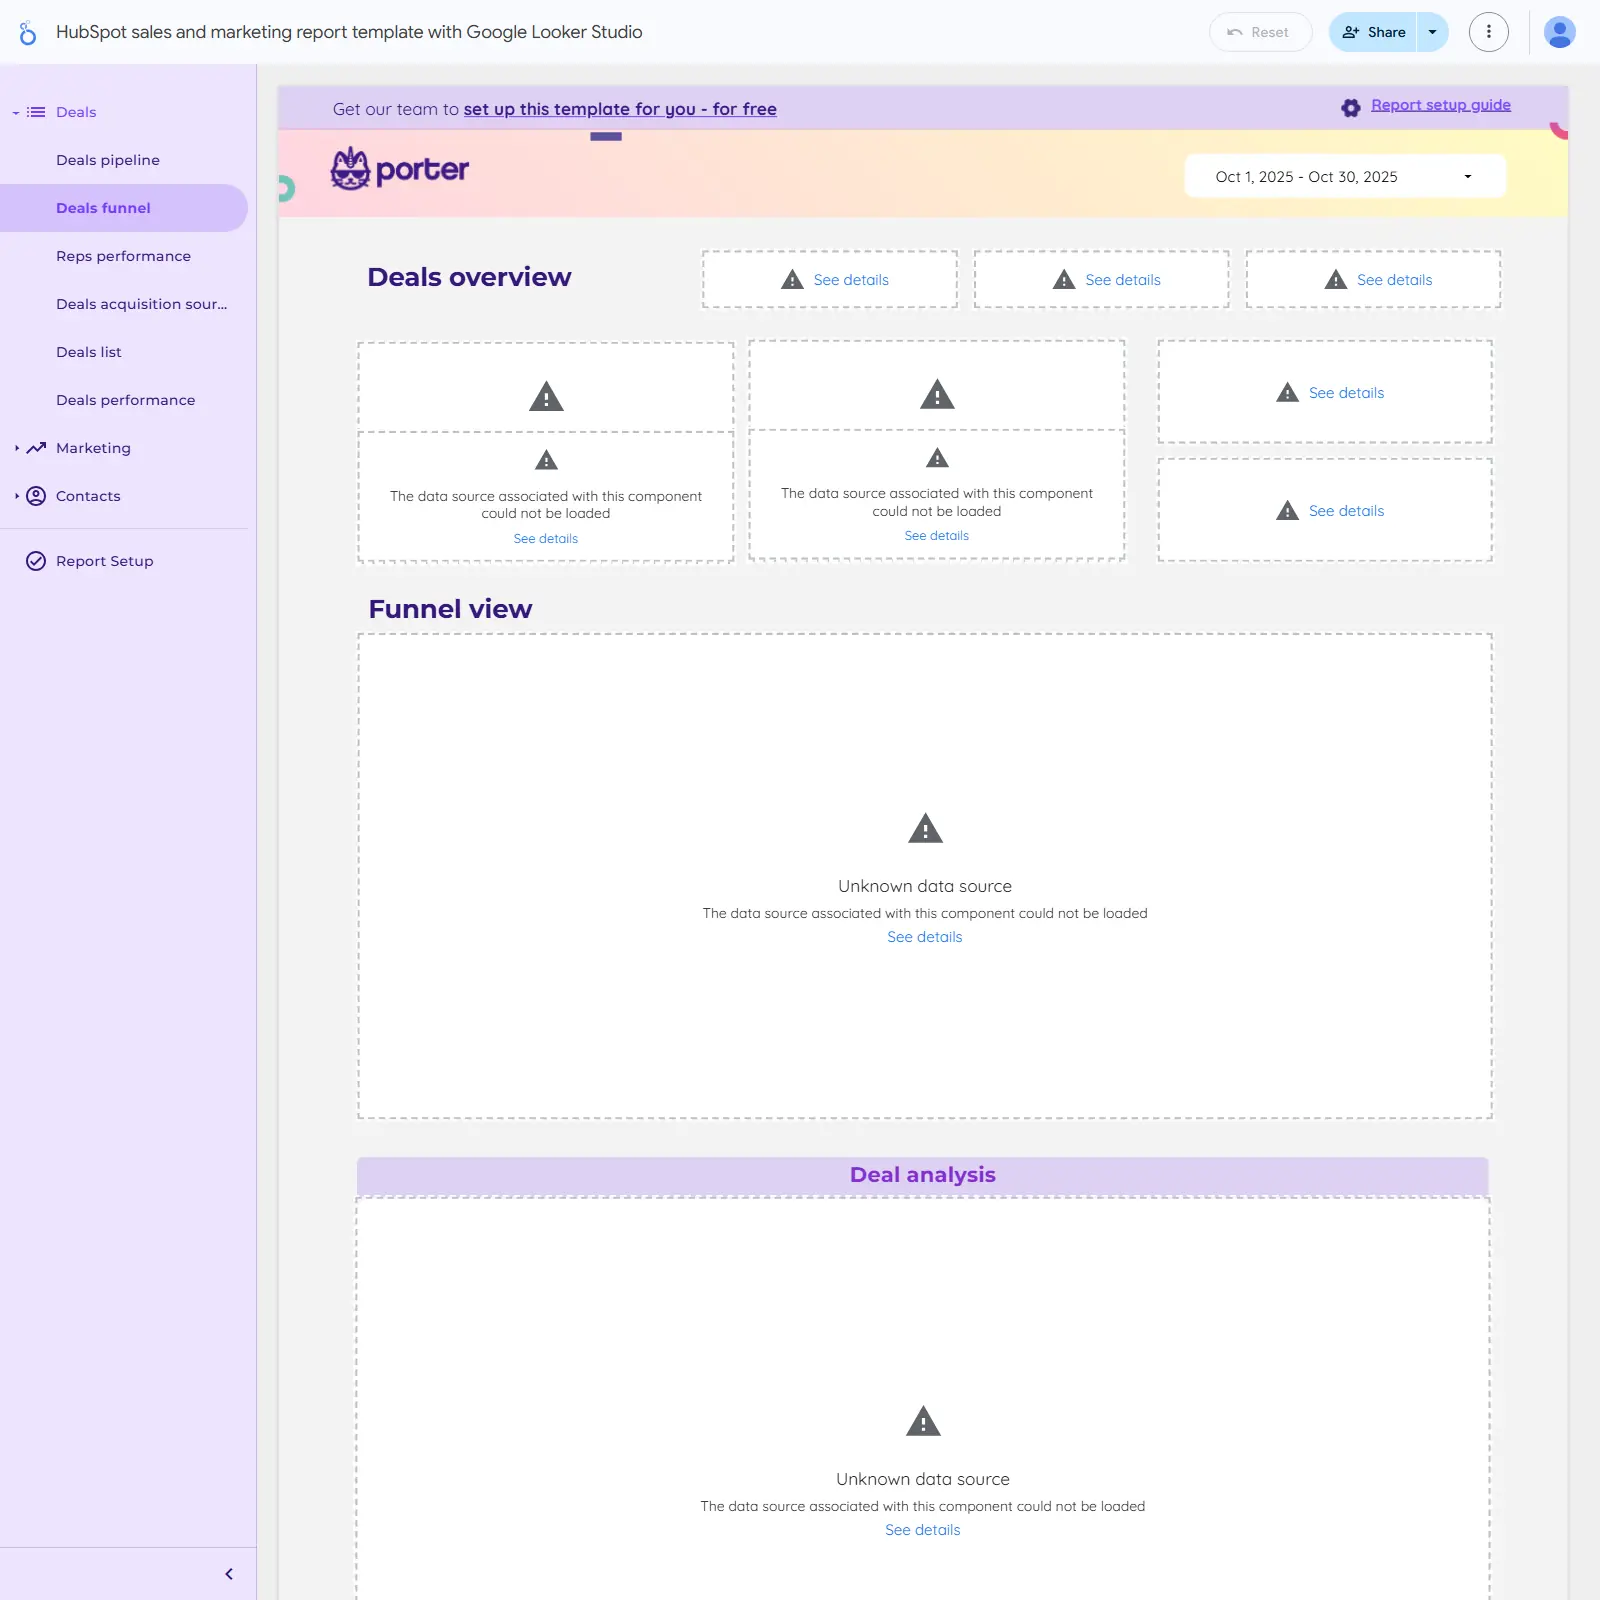
HubSpot-to-Looker Studio dashboard for B2B performance tracking across leads, pipeline, CAC, win rates, and revenue with rich segmentation.

A HubSpot report template for Looker Studio that tracks B2B sales and marketing performance end to end, including lead conversion rates, pipeline stage drop‑offs, customer acquisition cost, deal close rates, and revenue growth. Segment results by industry, company size, sales region, and lead source to uncover where growth is coming from. Prebuilt sections cover deals overview, funnel view, deal analysis, reps performance, acquisition sources, marketing, and contacts. Features include white‑label custom charts, custom metrics, historical data, goals, filters, data blending, and scheduled email alerts for stakeholders.
Free
Sales KPI dashboard for HubSpot cover image
Sales KPI dashboard for HubSpot

Sales deals performance dashboard for tracking closed revenue, close rate, rep leaderboards, and loss reasons with 12‑month trends.

Sales performance template focused on closed deals and revenue impact. Track closed revenue, average deal size, lost amount, and 12‑month trends for closed and lost deals. Monitor close rate, top won and lost deals, and loss reasons to improve win rates. Compare best and worst owners by closed amount to pinpoint coaching and recognition opportunities. Filter by date and source to see which channels drive results and where deals stall.
Free
Google Business Profile - Demographic Analysis cover image
Google Business Profile - Demographic Analysis

Demographic and engagement insights for Google My Business, covering visibility, actions, sources, devices, locations, regions, and search terms.

Google My Business – Demographic Analysis focuses on how local customers discover and engage with your listings. Track star rating, review count, total views, and search impressions alongside actions like bookings, calls, messages, direction requests, and website visits. See where visibility comes from with breakdowns of Search vs Maps and mobile vs desktop, plus action mix across types. Get location-level context with maps links, phone and website details, and identify top-performing regions. Use search term impressions and engagement trends to refine local SEO and improve conversion from profile views.
Free
Google Business Profile One Page Report Free Connector cover image
Google Business Profile One Page Report Free Connector

One-page Google Business Profile dashboard highlighting impressions, actions, reviews, and trends using the free Gladior connector.

One-page Looker Studio template focused on Google Business Profile performance for local SEO. Tracks and compares key metrics vs. previous period and year: total impressions (Maps and Search), website clicks, calls, direction requests, total reviews, and average rating. Includes time-series for views and interactions, a keyword table to see which queries drive impressions, and weekday breakdowns to spot peak visibility. Built for the free Gladior GBP connector and comes with a connection tutorial. Ideal for quick client updates and fast insight into what drives visits, calls, and site traffic from GBP.
$32.54
Multi-channel Marketing performance report template cover image
Multi-channel Marketing performance report template

Unified Looker Studio dashboard to compare multi‑channel marketing performance across ads, social, SEO, and web analytics.

Multi‑channel marketing performance template that unifies paid, organic, and social results in one Looker Studio view. Track core metrics—impressions, clicks, spend, CTR, CPC, conversions, CAC, engagement, video views, sessions, page views, and keyword rank—across channels and campaigns. Compare efficiency and ROI across Google Ads, Facebook Ads, LinkedIn, TikTok, Twitter, GA4, and Search Console to see what actually drives growth. Built for marketers and agencies to monitor performance and reallocate budget with confidence. White‑label ready with custom metrics and data blending for a single source of truth.
Free
GA4 EVENT AUDIT cover image
GA4 EVENT AUDIT

GA4 event and ecommerce audit dashboard to validate tracking, monitor key metrics, and spotlight issues fast.

GA4 Event Audit by Vision Labs helps audit and monitor your Google Analytics 4 setup, highlighting account creation date, unique events, hostnames, countries, conversion events, custom audiences, and data streams. Visualizes traffic and event trends across sources to quickly spot anomalies and gaps. Includes dedicated sections for Event Audit and Ecommerce to validate tagging, track conversions, and evaluate revenue performance. Offers customization options and a built‑in tutorial for faster onboarding. Ideal for marketers and analysts who need to confirm GA4 data quality and turn insights into fixes.
Free
GA4 Hour of Day Day of Week Dashboard cover image
GA4 Hour of Day Day of Week Dashboard

Analyze GA4 KPIs by hour, day, and weekend vs. weekday to uncover actionable timing patterns across users, conversions, and revenue.

GA4 time analysis template that compares users, sessions, conversions, transactions, and revenue by hour of day, day of week, and week type (weekday vs. weekend). Uncovers when performance spikes or drops so you can time campaigns, content, and offers more effectively. Drill into segments like region, marketing channel, and technology to understand patterns by audience and source. Ideal for spotting trends and prioritizing actions without building reports from scratch.
Free
Website traffic from YouTube - performance analysis dashboard cover image
Website traffic from YouTube - performance analysis dashboard

Analyze GA4 YouTube-driven website traffic, conversions, and revenue with landing page and monthly trend insights.

YouTube Traffic Performance focuses on how visits from YouTube impact your website using GA4 data. Track users, sessions, new users, bounce rate, key events, and engagement alongside e‑commerce purchases and purchase revenue. Compare traffic, purchases, and revenue over time to see the effect of your video content. Identify high-performing landing pages and monthly trends to optimize content, pages, and campaigns for growth.
Free
Google Analytics 4 GA4 Looker Studio Data Visualization Charts cover image
Google Analytics 4 GA4 Looker Studio Data Visualization Charts

GA4 chart pack for Looker Studio covering core, advanced, content, e-commerce, geo, and goal visuals for clearer, faster insights.

A curated pack of GA4 visualization charts for Looker Studio that helps teams turn analytics into clear, persuasive stories. Includes foundational charts for sessions, revenue, devices, and channels, plus enhanced views for user journeys, campaigns, and engagement. Adds focused sections for content performance, e-commerce trends and product insights, geographic breakdowns, and progress vs. goals. Designed to surface key trends fast, backed by a friendly user guide and accessibility support. Ideal for marketers, analysts, and leaders who want sharper GA4 reporting without starting from scratch.
$79
Facebook Ads Funnel report template cover image
Facebook Ads Funnel report template

Analyze the Facebook Ads funnel with CTR, CPA, ROAS, and conversion insights by audience, placement, device, and time.

Track the full Facebook and Instagram ads funnel in Looker Studio, from impressions to conversions. See CTR, conversion rate, CPA, ROAS, spend, and impressions by campaign, ad set, placement, device, demographic, and time of day to pinpoint what drives performance. Compare acquisition costs and returns across segments to guide budget and creative decisions. Share insights with stakeholders via link, PDF, or email to align on actions and scale winning ads.
Free
Facebook Ads Report Template cover image
Facebook Ads Report Template

Facebook Ads analytics template for Looker Studio focused on ROAS, performance trends, and campaign, ad set, and demographic breakdowns.

Facebook Ads performance template for Looker Studio that consolidates campaign metrics and ROI in one view. Track spend, clicks, impressions, conversions, CTR, and ROAS over time with an at‑a‑glance ROAS gauge and trend charts. Compare campaigns, ad sets, and ads to identify top contributors, analyze cost versus performance, and break results down by country, age, and gender. Review monthly or yearly spend and conversion trends to guide budget allocation and creative strategy.
£149
Youtube Insights - Video Performance and Insights cover image
Youtube Insights - Video Performance and Insights

YouTube video performance and subscriber impact in one Looker Studio view, covering engagement, watch time, and key video metadata.

Analyze individual YouTube videos end to end in Looker Studio—views, likes, comments, shares, watch time, average view rate, and subscribers gained or lost. Get channel-level KPIs (subscribers, videos, total views) alongside a ranked table with video thumbnails for quick comparison. Review upload and privacy status, embeddability, video length, and audience watch rate to manage your content pipeline. Spot breakout clips, diagnose retention drops, and prioritize what to publish next based on what drives subscribers. Built for creators, agencies, and brands that need clear, actionable video insights.
Free
Woocommerce Reviews and Rating cover image
Woocommerce Reviews and Rating

WooCommerce reviews and ratings analytics with heat‑mapped product insights and a detailed review log for quality and action.

Analyze WooCommerce product reputation with overall rating, review volume, and counts of verified reviews. Compare products in a heat‑mapped table showing images, price, stock status/quantity, number of reviews, and average rating to quickly spot best‑sellers and problem items. Review-level detail includes reviewer name and email, creation date, content, verification status, and star rating for moderation and QA. Useful for prioritizing product improvements, customer service follow‑ups, and inventory decisions based on real customer feedback.
Free
Free Snapchat Ads Dashboard Template on Looker Studio cover image
Free Snapchat Ads Dashboard Template on Looker Studio

Snapchat Ads analytics in Looker Studio with funnel, demographics, and campaign performance insights to optimize spend and conversions.

A focused Snapchat Ads analytics template for Looker Studio that brings campaign performance, spend, swipes, reach, and purchases into one view. Visualizes the full conversion funnel—add to cart, start checkout, and purchases—so you can spot drop-offs and improve conversion rates. Highlights audience demographics alongside video views and screen time to sharpen targeting. Trend charts and campaign comparisons help you evaluate results over time and optimize budgets with confidence.
Free
Shopify Overview cover image
Shopify Overview

Shopify performance overview with KPIs, geo sales maps, and time/product breakdowns in Looker Studio.

Shopify Overview Dashboard for Looker Studio tracks store performance with scorecards for total sales, orders, customer count, and average order value. Geo maps surface sales by country and city to reveal regional opportunities. Heatmaps and tables analyze sales over time, weekly trends, orders, orders with products, and sales by product. Ideal for monitoring growth and pinpointing the markets, weeks, and items driving revenue.
Free
Organic social media mix dashboard cover image
Organic social media mix dashboard

Unified organic social media mix tracking across Facebook, Instagram, Pinterest, TikTok, X, and LinkedIn with impressions, followers, and engagement KPIs.

Cross-channel organic social media performance template by Supermetrics for Looker Studio. Consolidates Facebook, Instagram, Pinterest, TikTok, X (Twitter), and LinkedIn to track impressions, followers, engagements, and engagement rate. Surfaces total volume (paid and organic), growth deltas, and platform-level KPIs to spot what’s driving reach and where engagement drops. Helps prioritize channels and content types by comparing results side‑by‑side. Built for teams that need a quick, unified view of brand presence across networks.
Free
Looker Studio LinkedIn Pages Overview Report cover image
Looker Studio LinkedIn Pages Overview Report

Looker Studio template for tracking LinkedIn Pages visitors, followers, and update performance.

LinkedIn Pages performance template for Looker Studio that centralizes page insights from LinkedIn Page Analytics. Track visitor analytics, all and unique page views, follower count, and trends over time. Evaluate update-level metrics to see which posts drive engagement and reach. Built for marketers and social teams who need quick, actionable visibility into page growth and content impact.
Free
LinkedIn Pages Overall Performance cover image
LinkedIn Pages Overall Performance

LinkedIn Pages performance tracking for KPIs, page views, posts, and audience demographics in Looker Studio.

Comprehensive LinkedIn Pages analytics focused on the metrics that matter—clicks, engagements, impressions, reach, shares, and likes—with clear period-over-period comparisons. Break down page-view trends for key sections like About, Careers, Jobs, and Products, including desktop vs. mobile. Spot winners and underperformers fast with post performance, button clicks, and page analysis tables enhanced by bars and heatmaps. Understand your audience with demographics by job function, seniority, industry, follower country, and company size. Purpose-built for Looker Studio to centralize LinkedIn Page reporting for teams and stakeholders.
Free
Organic LinkedIn Report 3 pages side menu Metricool cover image
Organic LinkedIn Report 3 pages side menu Metricool

LinkedIn organic reporting with Metricool data covering growth trends, engagement, and top post performance across three pages.

LinkedIn analytics template powered by Metricool data to track your company page’s organic results across three focused pages: Summary, Growth, and Posts. See month-over-month and year-over-year comparisons for followers, engagement, interactions, and impressions, plus 12‑month follower trends and daily new followers. Identify the best days for growth and impressions, spotlight top posts by reach and engagement, and review a detailed post table with reactions, clicks, shares, views, and watch time. Built for client-ready reporting so teams can quickly spot what’s working and improve content and publishing cadence. Includes a 30‑day Metricool trial code and a connection tutorial.
$53.30
LinkedIn Leads Campaign Funnel Engagement Report cover image
LinkedIn Leads Campaign Funnel Engagement Report

Full‑funnel LinkedIn Ads lead‑gen tracking with geo, demographics, and top creative insights.

LinkedIn Ads Leads Campaign Funnel & Engagement highlights lead‑generation performance across campaigns in a single QBR view. It visualizes the full funnel—awareness, consideration, and lead gen—with KPIs like reach, impressions, frequency, CTR, CPC, lead form opens, completion rate, leads, and cost per lead. A geo map shows where results come from, and demographics reveal clicks by job title, seniority, company size, and top companies. See total campaigns, investment, and top‑performing creatives to spot what’s working and where to optimize budget.
Free
HubSpot cross-portal performance overview template cover image
HubSpot cross-portal performance overview template

Cross-portal HubSpot performance tracker for sessions, conversion to contacts, lifecycle funnel stages, page views, contacts, and customers.

HubSpot Cross-Portal Performance tracks marketing performance across multiple HubSpot portals in one view. Monitor traffic sessions, session-to-contact conversion, and average page views to understand engagement. Follow a full contact lifecycle funnel—from new visitor to contacts, MQLs, SQLs, opportunities, and customers—to find drop‑offs and growth opportunities. Trend charts for contacts and customers help highlight what’s working across domains.
Free
Time tracking dashboard for Harvest cover image
Time tracking dashboard for Harvest

Harvest time‑tracking and billing overview with hours, billable amounts, active users, and client/project insights.

Harvest time tracking and billing analytics to monitor team utilization and revenue. Highlights total hours, billable hours, billable amount, and active users with clear month‑over‑month changes. Breaks down time and billings by client, project, user, and task to pinpoint top contributors and bottlenecks. Includes charts for hours and billable amount by client and project plus a calendar view for daily patterns. Ideal for agencies and services teams looking to align workload with billings.
Free
Ultimate Ecommerce Google Analytics 4 GA4 cover image
Ultimate Ecommerce Google Analytics 4 GA4

GA4 ecommerce dashboard for tracking acquisition, engagement, devices, demographics, and active users.

GA4 ecommerce template that brings together acquisition, engagement, and audience insights for online stores. Track users, new users, sessions, engaged sessions, and engagement rate with filters for hostname, country, device, and date. Visualize trends by traffic medium, device category share, gender mix, and 1/7/28‑day active users. Sections for Overview, Page Views, Ecommerce, and Miscellaneous help move from traffic to revenue analysis. Useful for spotting winning channels, device optimization opportunities, and audience shifts fast.
Free
Google Analytics 4 GA4 Looker Studio Template cover image
Google Analytics 4 GA4 Looker Studio Template

Comprehensive GA4 Looker Studio template covering traffic, engagement, conversions, and ecommerce insights.

All‑in‑one GA4 dashboard for tracking website and app performance across traffic, engagement, conversions, and ecommerce. Break down visitor sources by marketing channel, location, and device to see where growth comes from. Spot winning content and understand user behavior with interaction and session metrics. Measure revenue, average order value, product performance, and shopping behavior to optimize sales. Compare time periods to uncover trends and seasonality for smarter planning.
£149
GA4 Audit cover image
GA4 Audit

GA4 attribution audit to spot misclassified traffic, “not set” issues, consent mode impacts, and inflated Direct.

GA4 self-audit focused on attribution integrity and data quality. Identifies spikes in Unassigned and (not set) sessions, highlights landing pages affected by missing parameters, and quantifies conversions tied to unknown sources. Evaluates how Consent Mode impacts Google/CPC attribution and detects over-attribution to Direct. Uses concise tables and trend lines to pinpoint misclassified traffic and measurement gaps. Ideal for marketers and analysts validating channel grouping and event parameter completeness.
Free
GA4 File Download Report Legacy cover image
GA4 File Download Report Legacy

GA4 Looker Studio template focused on file_download events to reveal top files, trends, and channel/device sources for smarter content and promotion decisions.

GA4 File Download Event Analysis template for Looker Studio that turns the file_download event into clear, actionable insights. Identify top downloaded files, extensions, and filenames, track trends over time, and see distribution by device, marketing channel, and traffic source. Pinpoint which assets drive engagement and where downloads originate to guide content, promotion, and UX decisions. Supports both the native GA4 connector (with registered event parameters) and a BigQuery workflow. Includes overview and detail views to investigate spikes, anomalies, and high-performing assets.
Free
GA4 SEO Looker Studio Dashboard cover image
GA4 SEO Looker Studio Dashboard

GA4 SEO template highlighting traffic, organic performance, events, and purchases to reveal what drives growth.

Turns GA4 data into clear SEO insights across traffic, sources, and organic performance. Track sessions, users, engagement, and events with month‑over‑month and year‑over‑year trends to spot growth and issues quickly. Compare channels and page paths to see which content and acquisition paths drive sessions and conversions. Explore organic by country/region, events, and purchases to connect search behavior to outcomes. Ideal for marketers and business owners who want a clean view of what’s working in search and where to optimize.
$25
Google Ads VS Facebook Ads cover image
Google Ads VS Facebook Ads

Compare Google Ads vs Facebook Ads performance across CTR, CPC, CPA, spend, and conversions with geo and device insights.

Side-by-side comparison of Google Ads and Facebook Ads to pinpoint which channel delivers better results. Tracks CTR, CPC, cost per conversion, spend, impressions, clicks, and conversions with clear visual comparisons. Highlights top campaigns and ads with key metrics to spot quick wins and underperformers. Includes geo insights for where clicks come from and a device-level breakdown to guide budget shifts and targeting tweaks.
Free
Google Ads report template cover image
Google Ads report template

Google Ads PPC dashboard for Looker Studio to track spend, CTR, CPC, ROAS, and conversions by campaign, keyword, device, and location.

Google Ads performance template for Looker Studio focused on PPC visibility, clicks, and conversions. Track key metrics like impressions, CTR, CPC, CPM, ROAS, spend, and conversions to spot winners and waste. Break down results by campaign, ad group, keyword, device, and location to understand where performance comes from. Evaluate trends and answer practical questions such as which campaign converts best and how mobile CPC compares. Ideal for marketers and agencies needing a clear view of acquisition efficiency and return on ad spend.
Free
Google Ads Display Performance cover image
Google Ads Display Performance

Google Ads Display performance tracker with core KPIs, period comparisons, and breakdowns by demographics, geography, device, and campaign levels.

Tracks Google Ads Display campaign performance at the account, campaign, and ad group levels. Highlights key metrics like impressions, average CPM, and display impression share with daily trends versus the previous period. Breaks results down by demographics, audience targeting, geography, and device to reveal where reach and engagement are strongest. Surfaces top and lagging performers to guide bid, budget, and creative decisions. Ideal for marketers seeking quick, actionable visibility into display outcomes.
Free
Google Ads Impression Share Insights cover image
Google Ads Impression Share Insights

Google Ads impression share insights with YoY changes, daily trends, and breakdowns by slot, type, and keywords.

Google Ads Impression Share Insights focused on measuring how often ads appear versus total opportunities. Highlights visibility and reach with year‑over‑year change, plus daily trends for cost and search impression share against the previous period. Breaks performance down by ad slot, ad type, and keywords to spot where coverage is gained or lost. Helps diagnose gaps from budget or rank and prioritize optimizations to grow exposure and efficiency.
Free
Google Ads Account Health cover image
Google Ads Account Health

Google Ads account health overview with spend trends, performance snapshots, and channel views for Search, Display, Video, Shopping, and App.

Google Ads account health template focused on fast diagnosis of performance and spend. Provides a daily spend trend, a performance snapshot, and an account performance overview to quickly spot shifts. Includes dedicated views for Search, Display, Video, Shopping, and App campaigns to compare channels. Useful for catching anomalies, pacing issues, and reporting wins in weekly reviews. A notes section helps capture insights and actions.
Free
Google Ads Budget Depletion Insights cover image
Google Ads Budget Depletion Insights

Daily and hourly Google Ads budget depletion insights to prevent budget‑limited downtime and optimize spend.

Google Ads Budget Depletion Insights focuses on spotting when campaign budgets run out and where spend is constrained. Daily and hourly summaries surface budget pacing and depletion patterns so you can reallocate budgets and protect performance. Ideal for monitoring budget‑limited campaigns and identifying the times of day when coverage drops. Not intended for Shopping campaigns.
Free
Google Ads Shopping Auction Insights cover image
Google Ads Shopping Auction Insights

Google Ads Shopping Auction Insights tracking for impression share, overlap, and outranking by day, campaign, ad group, and device.

Track Google Ads Shopping Auction Insights to benchmark Shopping campaign visibility against competitors. Monitor impression share, overlap rate, and outranking share to see who appears with you and who outranks you. Break down trends by day, campaign, ad group, and device to find where competitive pressure is strongest. Compare periods to flag gains or losses in visibility and competitiveness. Use insights to prioritize bids, budgets, and product coverage where share is slipping.
Free
Facebook Funnel Template cover image
Facebook Funnel Template

Funnel-focused Facebook Pages dashboard that measures reach, engagement, clicks, comments, and reactions by post.

Facebook Pages funnel analytics focused on how audiences move from seeing a post to engaging with it. Tracks post views, unique reach, and average views per person, then quantifies engagement rate across clicks, comments, and reactions. Breaks out click and comment rates plus the share each contributes to overall engagement. Includes a reactions breakdown (Like, Love, Haha, Wow, Anger, Sorry) and a performance-by-post view to spot drop‑offs and winning content. Built for social teams to optimize content and prove impact quickly.
Free
Facebook Ads Google Ads report template cover image
Facebook Ads Google Ads report template

Unified Facebook Ads + Google Ads template for tracking PPC metrics, blended spend, and ROI across channels.

Blends Facebook (Meta) Ads and Google Ads into one PPC performance view in Looker Studio. Track CTR, CPC, conversions, CPA, ROAS, impressions, and spend with comparisons by campaign, ad group/ad set, device, location, and demographics. See blended ad spend and daily results to compare channels, spot trends, and shift budgets with confidence. Ideal for marketers and agencies needing quick cross-platform insights and ROI tracking.
Free
Free Facebook Ads Funnel Dashboard Template for Looker Studio cover image
Free Facebook Ads Funnel Dashboard Template for Looker Studio

Funnel-focused Looker Studio template for Facebook Ads that tracks spend, ROAS, CTR, and stages from impressions to payments to boost performance.

Facebook Ads Funnel Dashboard for Looker Studio visualizes your Meta/Facebook Ads performance across the funnel—from impressions and reach to add-to-wishlist, add-to-cart, payments, and conversions. It surfaces spend, ROAS, and CTR trends so you can pinpoint which campaigns and audiences drive purchases. Clear charts reveal bottlenecks by stage, helping you reallocate budget and refine creatives for higher efficiency. Ideal for e‑commerce and performance teams aiming to grow revenue while cutting wasted ad spend.
Free
CallRail call tracking dashboard cover image
CallRail call tracking dashboard

CallRail analytics covering call and lead trends, timing patterns, sources, and agent answer performance.

CallRail performance tracking focused on calls, leads, and answer quality. Monitor month‑over‑month trends for calls vs. leads and answer rate vs. lead rate. Identify peak times with calls by day of week and hour and see how many are first‑time callers. Attribute conversions with a breakdown by traffic source. Evaluate team responsiveness with answer rates by agent email to optimize campaigns and staffing.
Free