Looker Studio Report Gallery

The best free & paid Looker Studio templates, curated and quality-ranked for data reporting.

Showing 81 - 120 of 552

Google Ads Agency Report cover image
Google Ads Agency Report

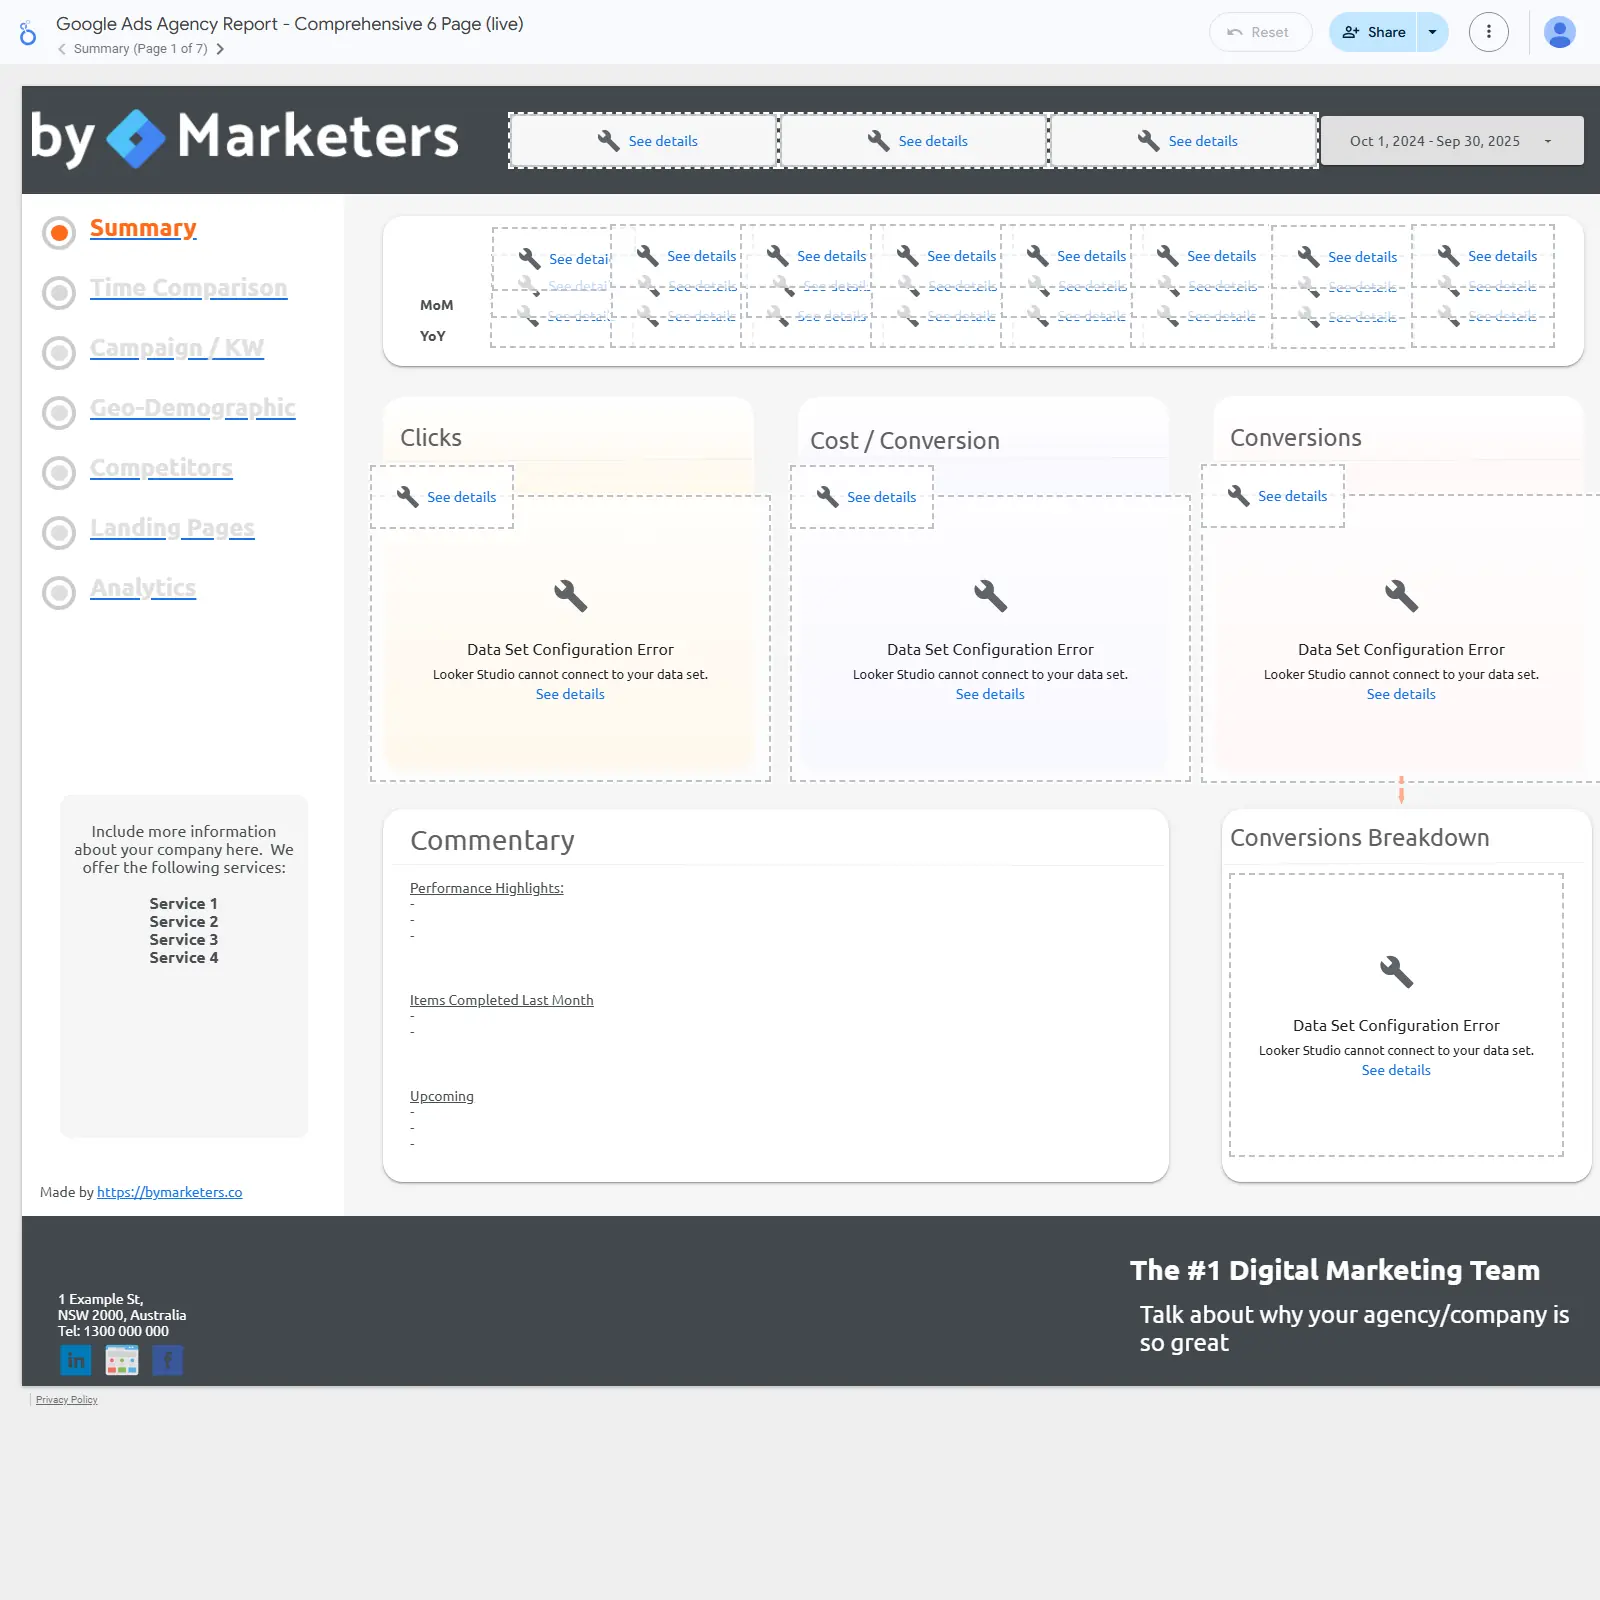
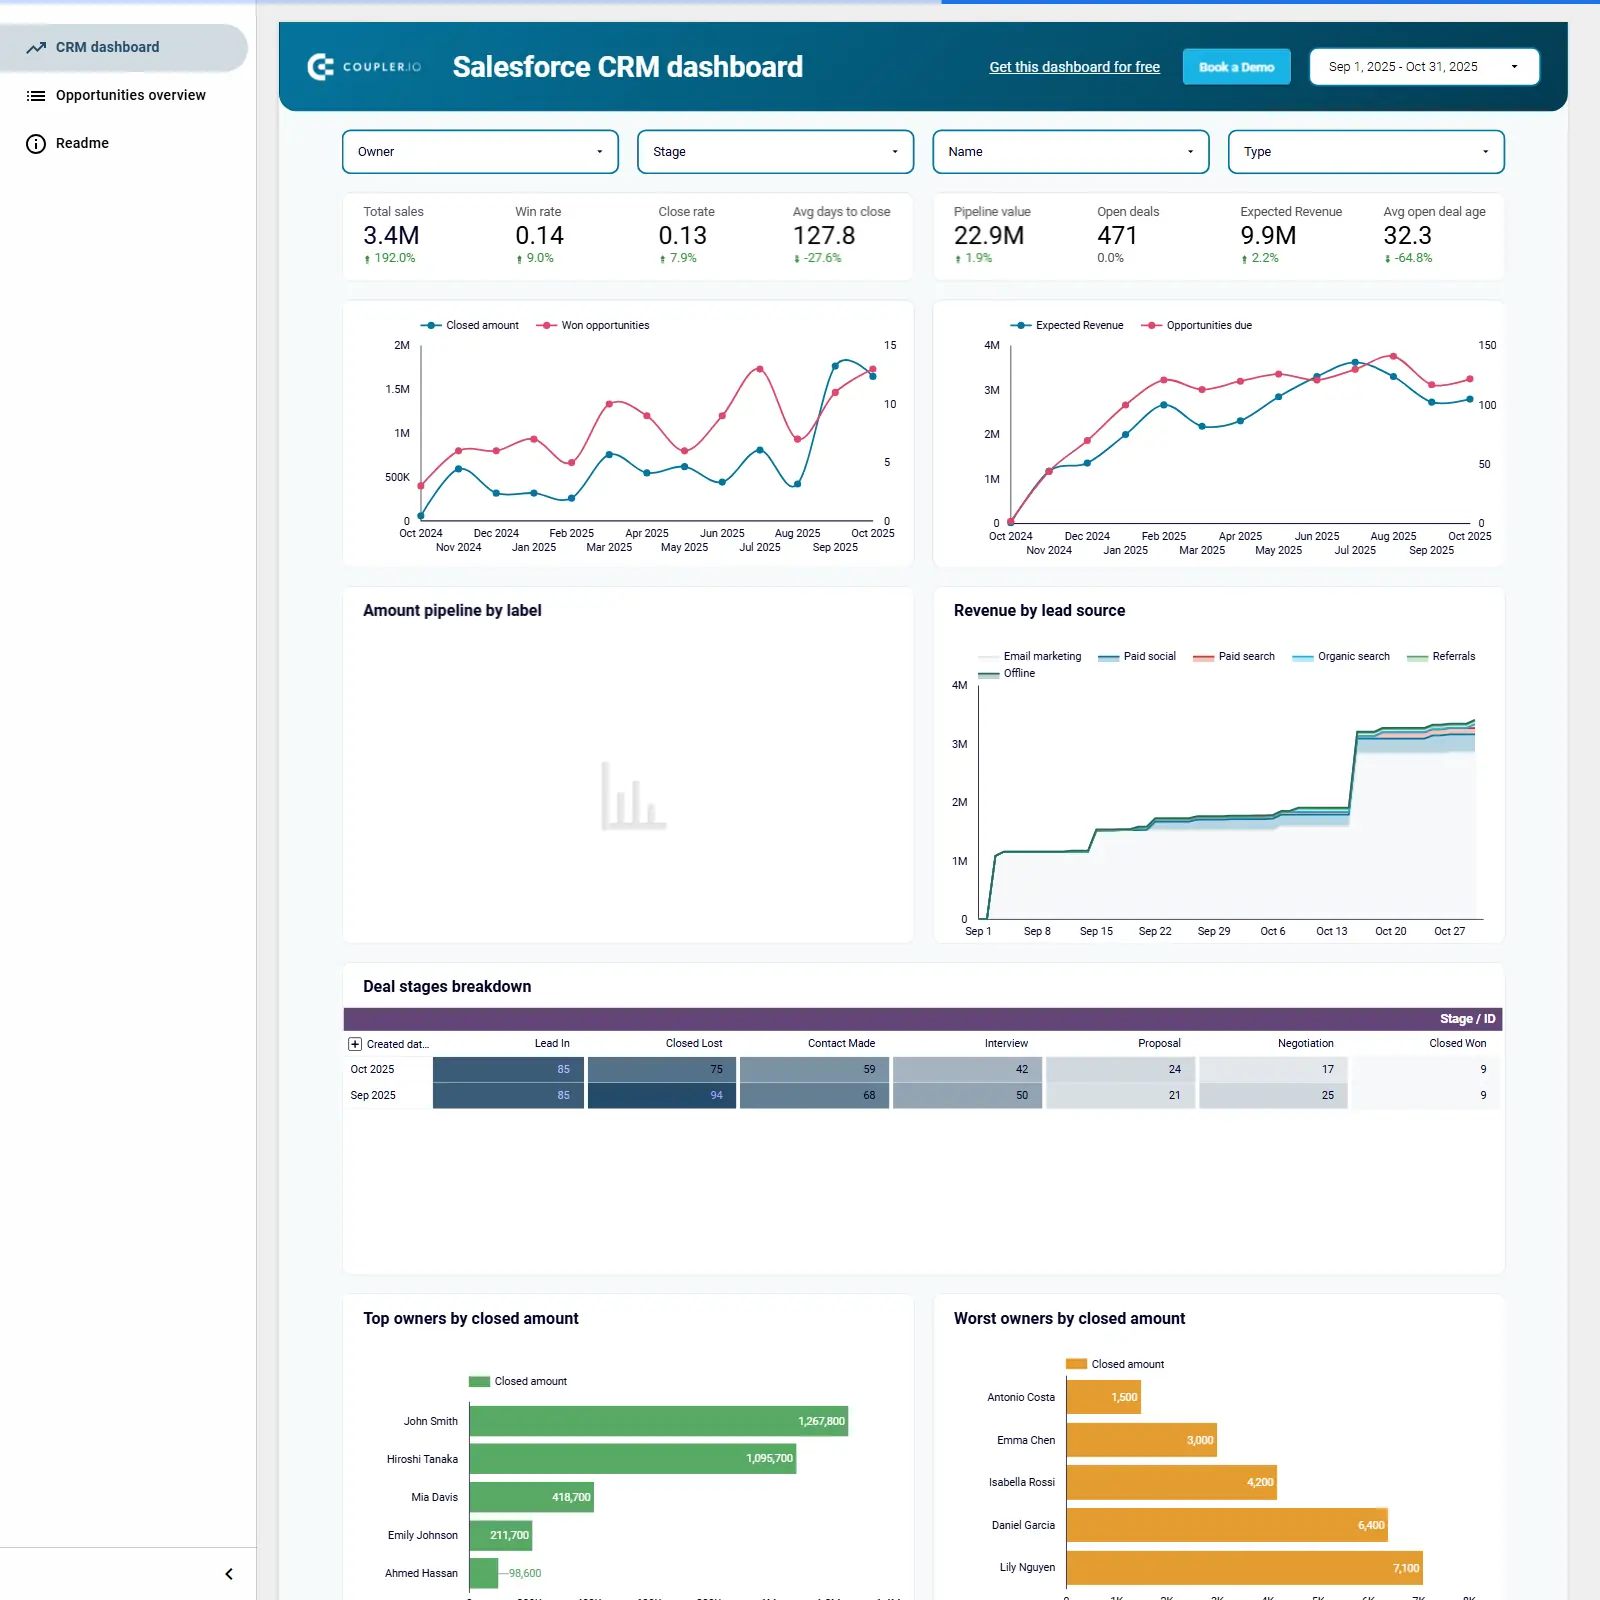
Agency‑grade Google Ads + GA4 monthly reporting across 7 pages with KPIs, trends, campaigns, geo, competitors, landing pages, and analytics.

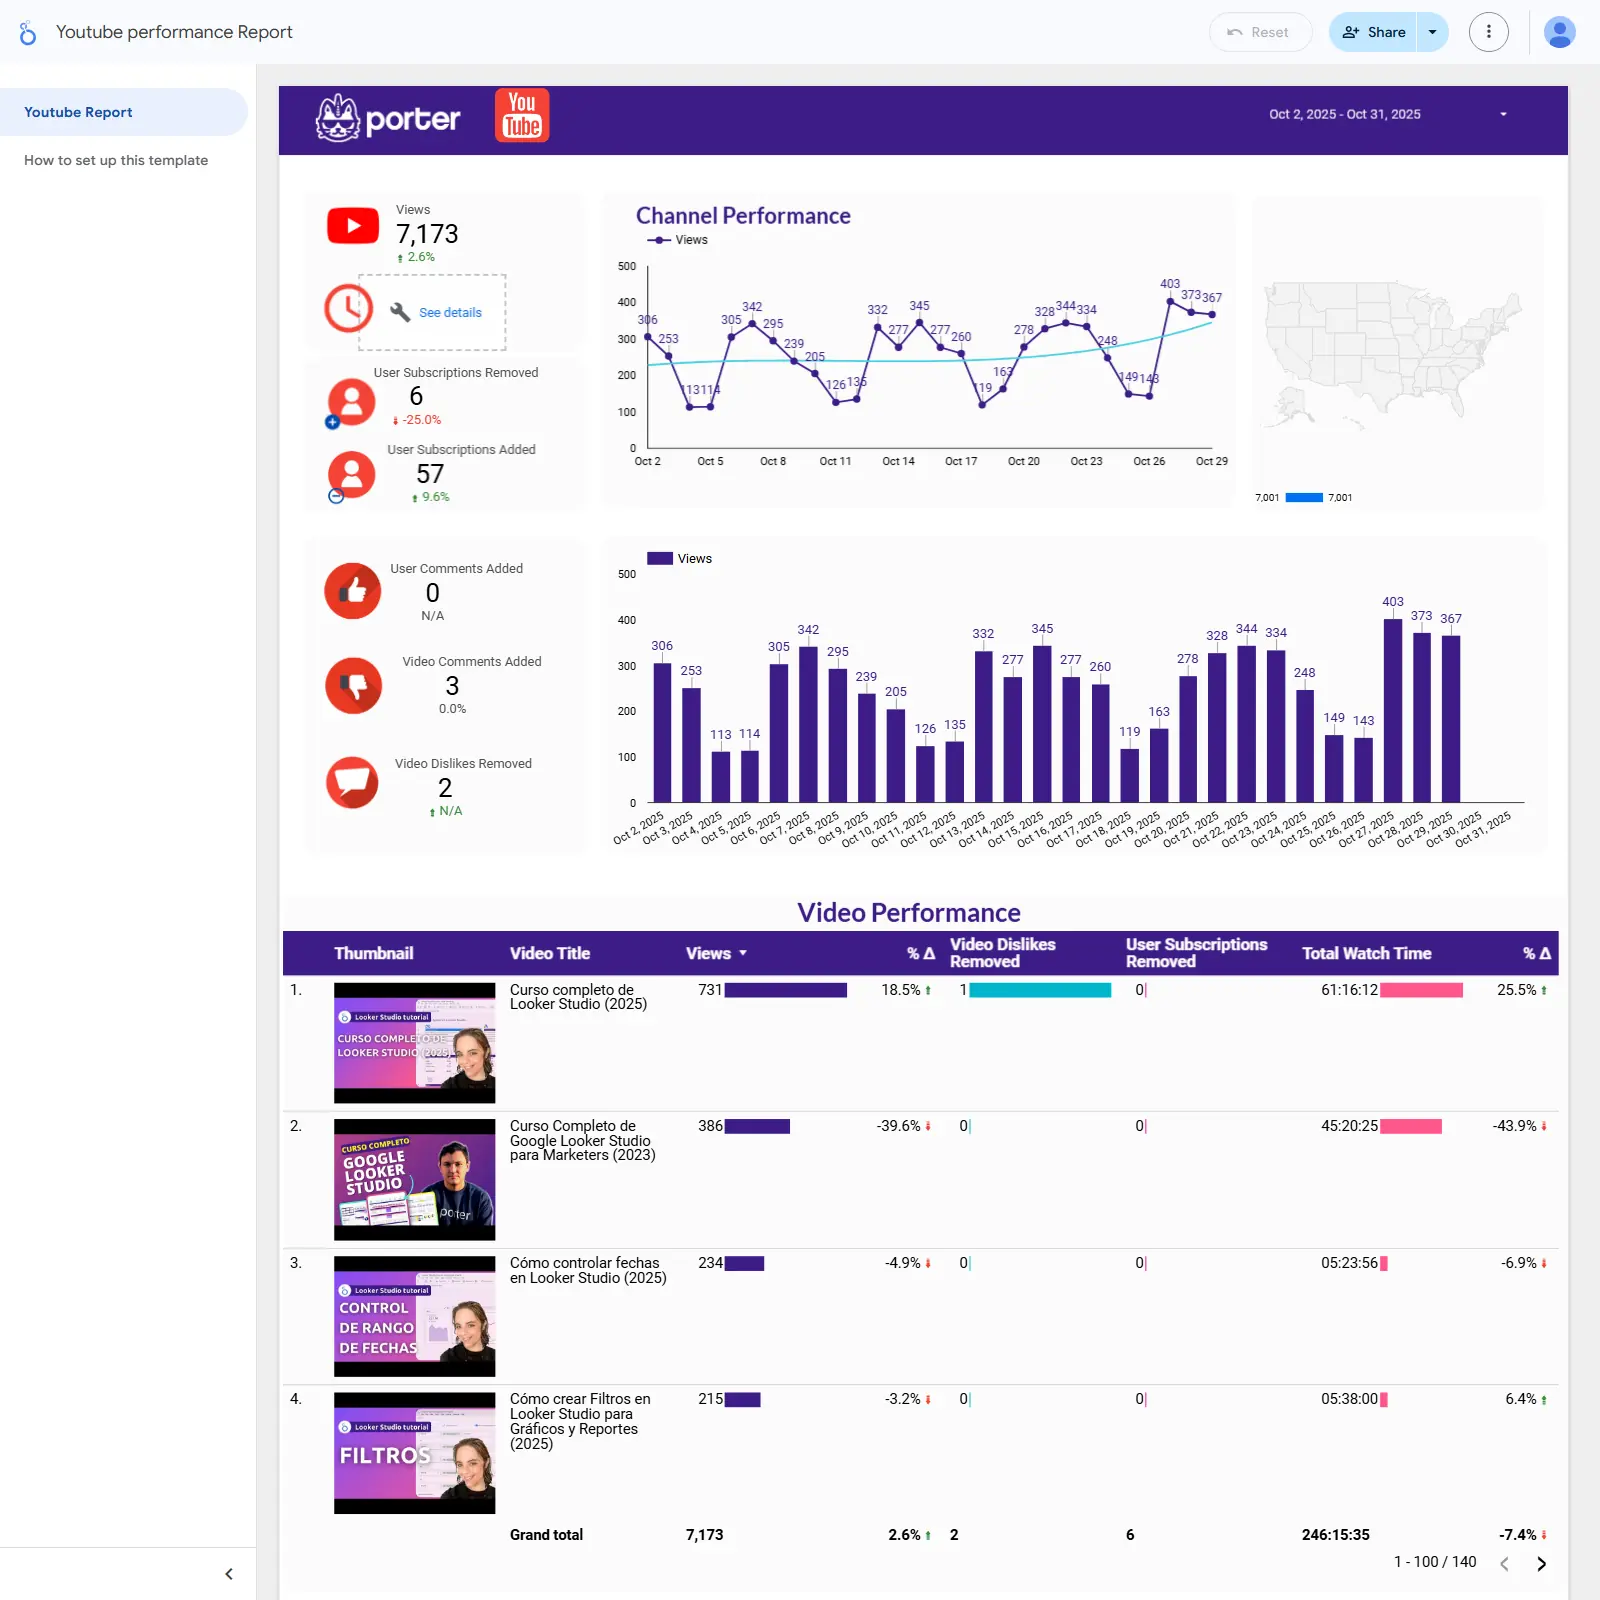
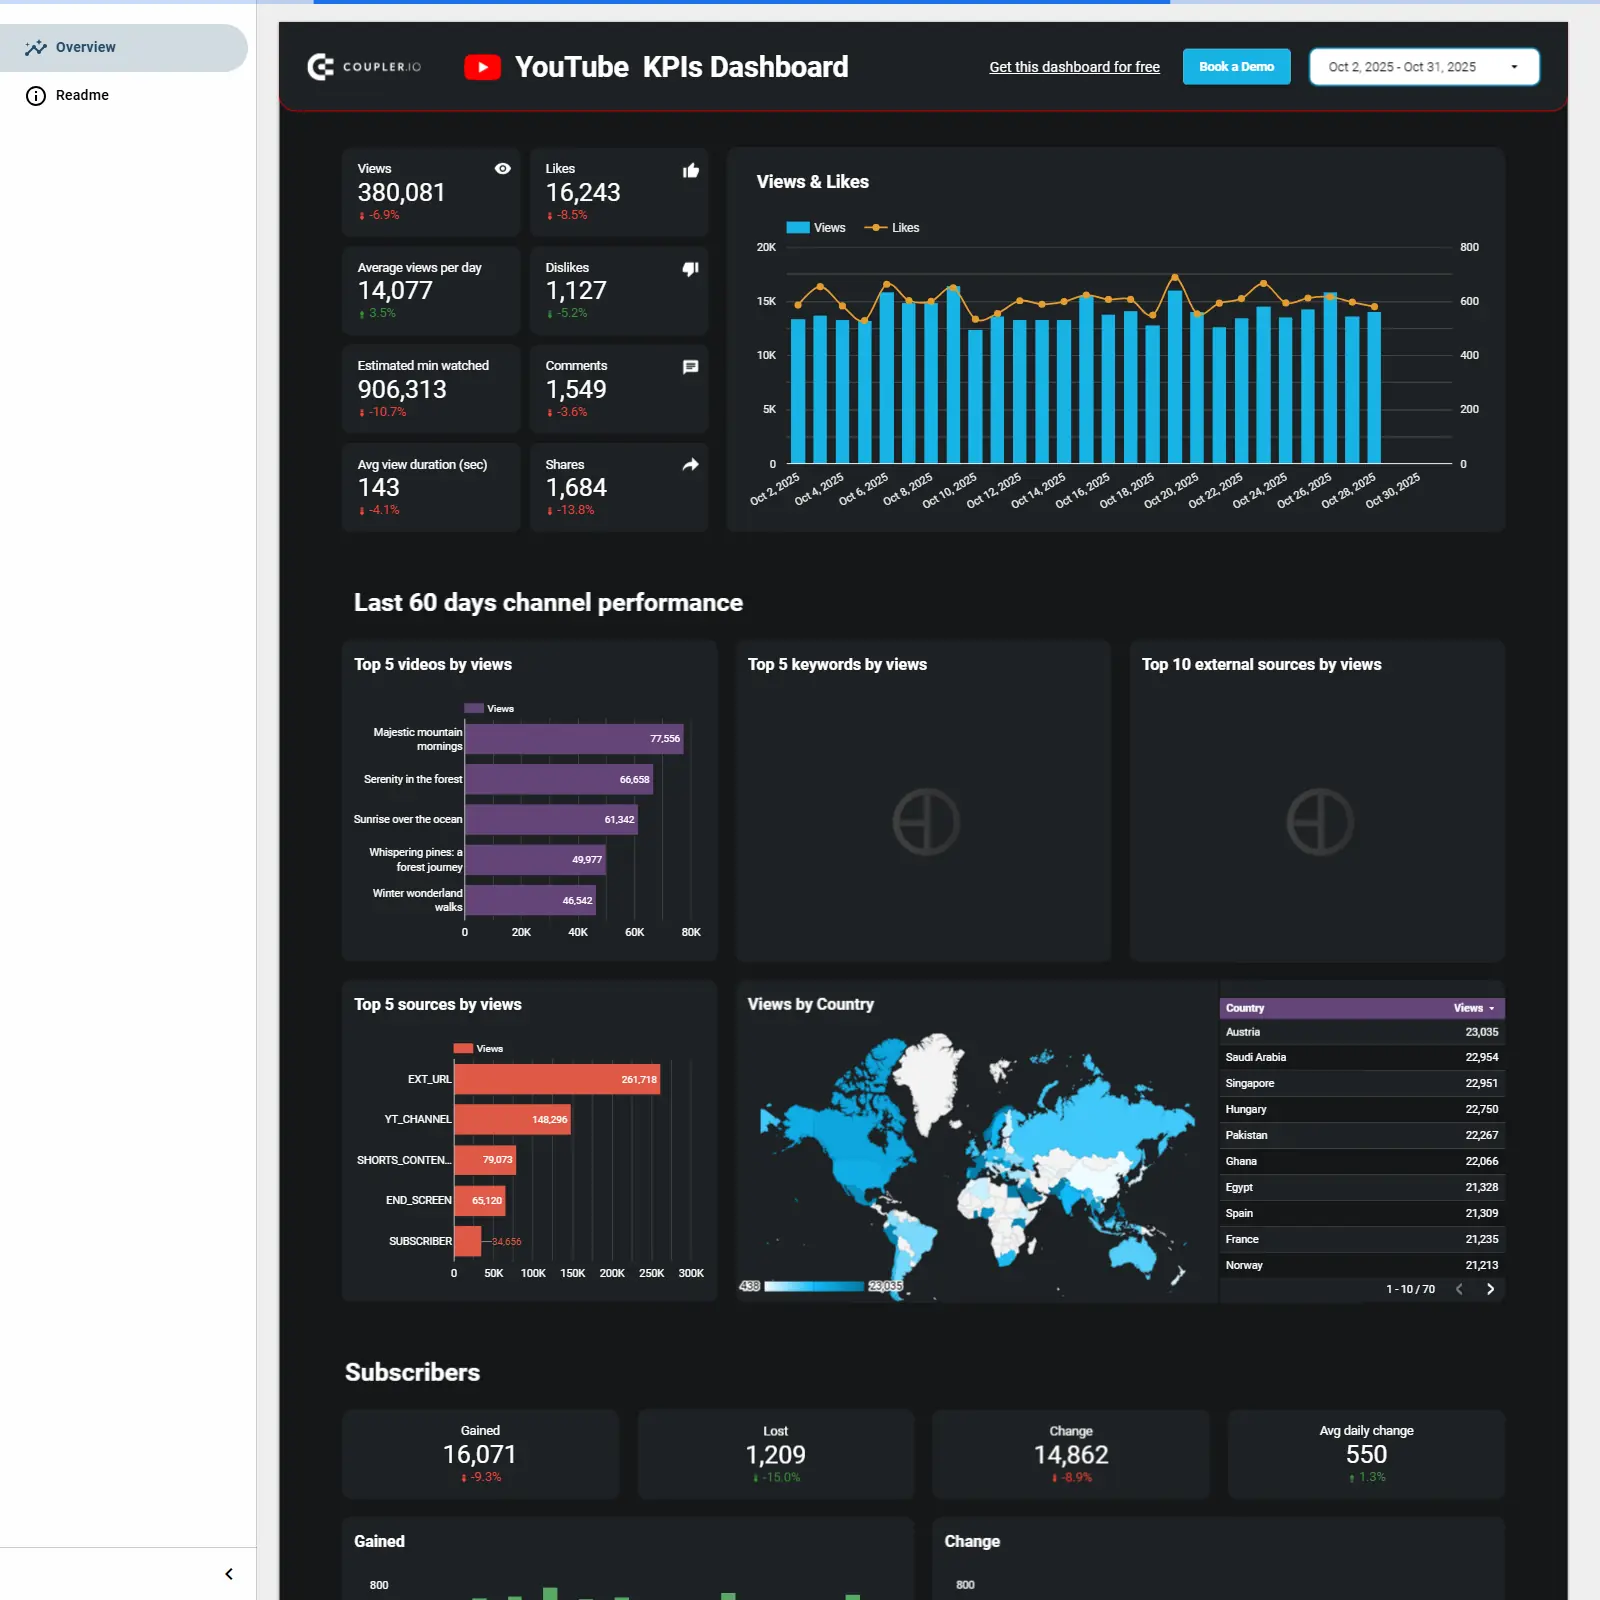
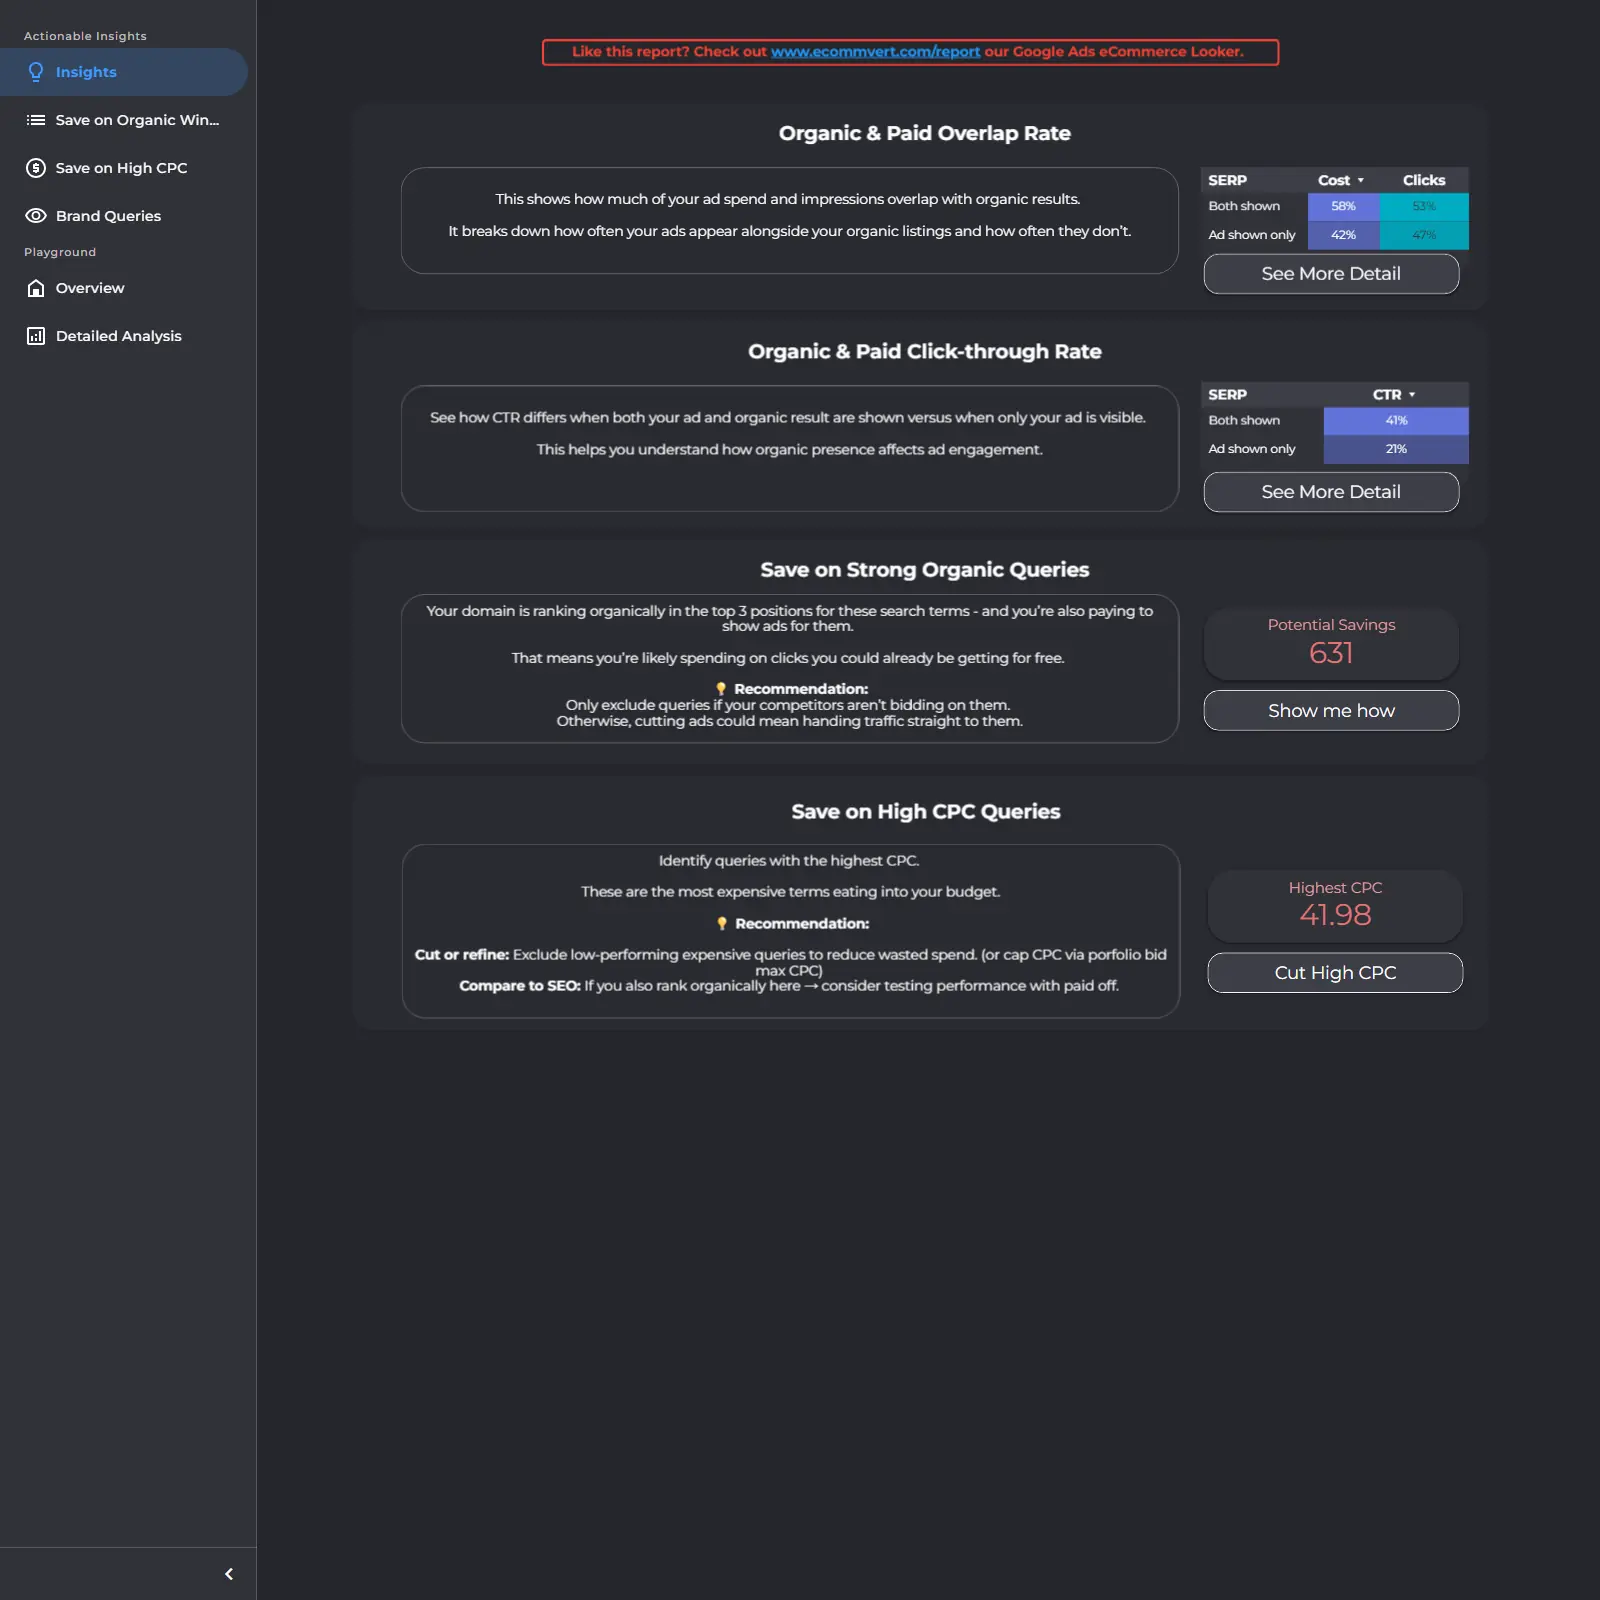
Comprehensive Google Ads agency dashboard for monthly reporting, combining Google Ads and GA4 data across 7 pages: Summary, Time Comparison, Campaigns/Keywords with search query mining, Geo‑Demographics, Competitors (Auction Insights), Landing Pages, and Analytics. Surface KPIs like cost, clicks, conversions, and cost per conversion, compare trends over the last 12 months, and pinpoint wins or issues by campaign, device, and location. Turn client meetings into clear conversations with built‑in commentary sections, co‑branding (agency and client logos), and space to outline services. Use GA4 side‑by‑side with Google Ads to validate attribution and benchmark against other channels. Best for lead‑gen and non‑ecommerce accounts (no ecommerce tracking).
$99.00
Organic Facebook Report side menu Metricool cover image
Organic Facebook Report side menu Metricool

Facebook organic analytics with Metricool data covering MoM/YoY trends, posts vs. reels performance, growth drivers, and audience demographics.

Facebook organic analytics template powered by Metricool data, organized with a side menu across six pages: Summary, Page, Growth, Posts, Reels, and Demographics. Track MoM and YoY trends for followers, impressions, engagement, interactions, reactions, posts, and reels, plus 12‑month follower evolution and daily performance. Compare posts vs. reels to understand their impact on reach and engagement, surface top 5 content, and review detailed tables with clickable post and reel previews. Uncover growth drivers with new followers by day, day‑of‑week insights, and ratios of publishing activity to results. Segment your audience by age, gender, country, and city to tailor content strategy.
$78.02
Ads and social media performance dashboard for Meta cover image
Ads and social media performance dashboard for Meta

Unified Facebook and Instagram ads + social analytics with KPIs, trends, geo insights, and post-level performance.

All-in-one Looker Studio template for tracking ads and social media across Facebook and Instagram. Monitor core KPIs—impressions, clicks, spend, CPM, CPC, and CTR—with clear time-series trends. Compare organic reach and paid performance, including spend and CPM/CPC changes. View country-level insights for ad impressions, page likes, and follower growth. Drill into post performance with likes, comments, and shares to find winning content and optimize budgets.
Free
Facebook Ads Looker Studio Template cover image
Facebook Ads Looker Studio Template

Facebook Ads reporting for ROAS, conversions, costs, and audience insights across Facebook, Instagram, Messenger, and Audience Network.

Facebook Ads performance reporting focused on what drives ROI across Facebook, Instagram, Messenger, and Audience Network. Track purchases, ROAS, conversions, CTR, link clicks, cost per result, spend, CPC, and CPM with clear views by campaign, platform, country, and demographics. Reveal trends over time to see what’s improving and where budget is wasted. Compare campaigns and regions to identify winners and refine targeting and creative. Purpose-built to turn ad data into fast, actionable decisions for growth.
€149
GSC Looker Studio Template on Page Keyword Analysis cover image
GSC Looker Studio Template on Page Keyword Analysis

Analyze Google Search Console data by page and keyword to find ranking opportunities and optimize content across devices, countries, and search types.

Page- and keyword-level analysis of Google Search Console data to uncover ranking opportunities and prioritize content updates. Track clicks, impressions, CTR, and average position, and compare performance across devices, countries, and search types. Identify top and underperforming pages and queries to guide optimizations and new content ideas. Built for SEO specialists, marketers, and site owners who need clear, actionable insights from GSC.
$79
Google Search Console - Looker Studio - Full Report cover image
Google Search Console - Looker Studio - Full Report

Looker Studio template for Google Search Console that tracks keyword rankings, traffic KPIs, and performance by brand, device, and location.

SEO Ranking Report for Looker Studio using Google Search Console data. Track ranked keywords, organic impressions, clicks, CTR, and the number of pages gaining visibility with clear trend visuals and year-over-year changes. Understand how keywords are distributed across ranking positions and highlight top-performing terms. Compare branded vs non‑branded queries, and drill into device and geographic performance with KPIs over time to spot wins and optimization opportunities.
Free
Youtube Channel Report Template cover image
Youtube Channel Report Template

YouTube Analytics template that tracks growth, engagement, and top content to guide your publishing strategy.

Gain a clear view of YouTube channel health with metrics for views, total watch time, average view percentage, and subscriber changes. Compare engagement across long vs. short videos, surface top-performing content, and pinpoint the best days for publishing. Dig into subscriber growth and churn by country and follow cumulative trends to understand how your audience evolves. Track performance over time to validate content decisions and refine your strategy.
€149
Accounts Receivable Dashboard for Xero cover image
Accounts Receivable Dashboard for Xero

Accounts Receivable dashboard tracking unpaid and overdue invoices, AR aging, top customers, and monthly paid vs unpaid trends with invoice-level detail.

Accounts Receivable template focused on unpaid and overdue invoices, collections performance, and customer exposure. Key metrics include total unpaid balance, overdue amounts (30+ and 90+ days), and top customers by outstanding value. AR aging tables break down balances across current, 1–30, 31–60, 61–90, and 90+ day buckets with an invoice-level list of due dates and amounts. Visuals compare paid vs. unpaid by month and summarize the last 12 months of payments by customer. Ideal for finance teams to prioritize follow‑ups, reduce DSO, and forecast cash flow.
Free
CRM dashboard for Salesforce cover image
CRM dashboard for Salesforce

Salesforce CRM template for tracking pipeline, revenue, win rates, deal stages, lead sources, and owner performance.

Salesforce CRM dashboard template focused on pipeline health, revenue trends, and sales performance. Tracks core KPIs including total sales, pipeline value, win rate, close rate, average days to close, open deals, expected revenue, and deal age. Highlights deal stage progression and revenue by lead source to spot bottlenecks and channel impact. Compares trends such as closed amount vs won opportunities and expected revenue vs opportunities due. Surfaces best and worst-performing owners to guide coaching and resource allocation.
Free
GA4 Google Ads Report focused on conversions cover image
GA4 Google Ads Report focused on conversions

Unified GA4 + Google Ads conversion reporting with MoM/YoY analysis for audience, acquisition, pages, campaigns, and keywords.

Conversion-focused Looker Studio template that unifies Google Analytics 4 and Google Ads to reveal how marketing efforts drive conversions. Compare performance MoM and YoY across audience, acquisition, top pages, campaigns, and keywords to spot trends and winners fast. Visualize events and conversions over the last 12 months and see which channels and campaigns contribute most to results. Ideal for performance marketers and decision-makers who need clear insights to optimize spend and growth.
$102.52
Big Query Source GA4 File Download Event Report cover image
Big Query Source GA4 File Download Event Report

Analyze GA4 file download events with BigQuery-driven insights by file, page, device, and traffic source.

GA4 File Download dashboard focused on tracking file_download events from your website. Pulls data from BigQuery using the provided SQL (or the native GA4 connector) to surface file names, extensions, URLs, pages, device categories, user counts, and event volume. Breaks down downloads by session and event source/medium to show which channels and campaigns drive the most asset engagement. Highlights top files and pages and patterns over time so you can optimize content and conversion paths. Ideal for teams managing resources, gated content, or documentation downloads.
Free
Google Search Console Explorer Studio v1 3 cover image
Google Search Console Explorer Studio v1 3

Interactive Looker Studio template for Google Search Console with YOY trends, SERP opportunity analysis, and brand vs non‑brand insights.

Looker Studio template for exploring Google Search Console data across queries, URLs, devices, and locations. YOY cumulative trends track progress versus last year for any segment. Bubble charts plot average position against impressions to surface SERP opportunities and isolate question keywords. Brand vs non‑brand filters and advanced query search (contains/regex) pinpoint high‑value terms. A detailed URL table exposes multi‑URL impressions to spot cannibalization and guide SEO fixes.
Free
Youtube report template cover image
Youtube report template

YouTube analytics template for Looker Studio that tracks views, watch time, engagement, subscribers, and video-level performance across audience, geography, and sources.

YouTube performance tracking template for Looker Studio focused on the metrics that matter: views, watch time, average view duration, engagement rate, likes, comments, shares, and subscribers gained/lost (plus optional ad spend). Break down results by video, category, audience demographics, geography, traffic source, and device to pinpoint growth opportunities. Visualize channel trends and compare videos with a detailed table including thumbnails and total watch time to spot winners and underperformers. Use the insights to refine content strategy, optimize promotion, and report impact to stakeholders.
Free
YouTube KPIs dashboard cover image
YouTube KPIs dashboard

Looker Studio template to analyze YouTube performance, traffic sources, and subscriber growth.

YouTube KPIs template for Looker Studio focused on channel and video performance. Tracks core metrics like views, likes, dislikes, comments, shares, estimated minutes watched, average views per day, and average view duration. Highlights trends over time and the last 60 days, with breakouts for top videos, keywords, external referrers, and traffic sources. Adds geographic insights with views by country and a clear subscriber module for gains, losses, and net change. Built to quickly spot winning content and optimize promotion and audience growth.
Free
YouTube Channel Overview Dashboard cover image
YouTube Channel Overview Dashboard

A Looker Studio template for YouTube Analytics that tracks channel growth, audience insights, and video performance with automated refreshes.

Tracks YouTube channel KPIs like views, watch time, average view duration, new subscribers, likes/dislikes, comments, shares, CTR, and card teaser metrics to reveal what drives growth. Visualizes trends over time, highlights top and underperforming videos, and surfaces active publishing days to refine your content strategy. Breaks down audience segments and traffic sources to show who’s watching and where they come from. Refreshes automatically (up to every 15 minutes) via Coupler.io’s connector and supports exporting to Sheets, Excel, or BigQuery. Fully customizable and white‑label friendly for sharing insights with stakeholders.
Free
Google Search Console dashboard cover image
Google Search Console dashboard

Google Search Console SEO dashboard that tracks clicks, impressions, CTR, ranking trends, top pages, and device performance.

Looker Studio SEO dashboard for Google Search Console focused on the core metrics that drive organic growth: clicks, impressions, CTR, and average position with weekly and period trendlines. Surfaces the top 10 pages by clicks or impressions and flags best and worst performers so you know exactly where to double down or fix declines. Breaks down traffic by device to spot mobile vs. desktop gaps that impact visibility. Designed for marketers and SEO teams who want a fast, actionable read on page-level performance and search momentum.
Free
Organic Instagram TikTok Report 14 pages Metricool cover image
Organic Instagram TikTok Report 14 pages Metricool

A 14-page Looker Studio template that unifies Instagram and TikTok organic reporting—growth, content performance, and audience insights—via Metricool.

Unified Instagram and TikTok organic analytics in a 14-page Looker Studio template powered by the Metricool connector. Track monthly, weekly, or annual performance across follower growth, reach, engagement, interactions, and profile activity with side-by-side trends and 12-month views. Analyze content in depth—posts, reels, stories, and videos—with daily performance, top-content rankings, and impression sources. Surface audience insights with demographics by gender, age, country, and city to refine targeting. Consolidate reporting for both networks in one place and add your key conclusions for client-ready summaries.
$123.28
Social Media report template cover image
Social Media report template

Unified Looker Studio template to track and compare social KPIs across major platforms with campaign-level insights.

Multi-platform social media analytics template for Looker Studio built by Porter. Connect Instagram Insights, Facebook Insights, LinkedIn Pages, TikTok, Pinterest, and Google Business Profile to monitor follower growth, engagement rate, reach, impressions, clicks, ad spend, video views, and website actions. Slice results by platform, campaign, and date to find top-performing content and channels. Features include white‑label charts, custom metrics, data blending, goals, historical data, filters, and scheduled email alerts. Designed for marketers and agencies who want a single, client-ready view of social KPIs.
Free
Paid Ads Organic Report cover image
Paid Ads Organic Report

Google Ads + SEO overlap insights to reduce wasted spend and target high‑impact queries with clear savings cues.

PPC-SEO insights template for eCommerce that helps cut wasted Google Ads spend. Reveals paid-and-organic overlap, including cost and CTR differences when ads appear alongside organic listings versus ad-only. Surfaces strong organic queries where ads can be scaled back and high‑CPC terms that drain budget. Calculates potential savings and gives practical recommendations for exclusions, bid caps, and testing.
Free
Local SEO Report Template cover image
Local SEO Report Template

Local SEO template that blends GA4, Search Console, and Google Business Profile to measure local traffic, visibility, and conversions across locations and channels.

Local SEO analytics template that unifies Google Analytics 4, Google Search Console, and Google Business Profile to track local visibility, traffic, and conversions. Monitor sessions over time with source, country, and device breakdowns, and drill into content performance, events, and top pages. Compare local SEO results against other marketing channels to spot what to scale or fix. Aggregate multi-location GBP data via a free connector to analyze Maps and Search views together. Turn trends and conversion insights into actions that lift local presence and revenue.
€409
Landing page performance dashboard cover image
Landing page performance dashboard

Landing page analytics template combining Google Search Console and GA4 to compare SEO, engagement, and e‑commerce results across pages.

Landing page performance template for Looker Studio that blends Google Search Console and GA4 to reveal how each page attracts and converts traffic. Track SEO visibility with impressions, clicks, CTR, and average position, then connect it to engagement metrics like new users, sessions, session duration, bounce rate, and key events. Tie efforts to outcomes with e‑commerce purchases and purchase revenue. Compare pages side by side to surface top performers and quick-win opportunities for SEO, UX, and conversion improvements.
Free
All in One GSC GA4 dashboard cover image
All in One GSC GA4 dashboard

Unified GA4 + Search Console SEO template for tracking traffic, queries, pages, and conversions with MoM/YoY views.

All‑in‑one SEO template that blends GA4 and Google Search Console to track organic performance alongside conversions. Ten focused pages cover overview (MoM/YoY), acquisition by channel, page performance, conversion sources and locations, and query analysis by device and country. Highlights top landing pages, top queries, and the content that drives conversions, with flexible filters including RegEx for deep dives. Built to monitor trends, attribute results, and uncover high‑impact opportunities across keywords and pages. Works with free GA4 and GSC connectors and includes a quick connection tutorial.
$94.35
Google Products Template cover image
Google Products Template

GA4-based dashboard for tracking traffic, engagement, and revenue across acquisition, devices, geography, landing pages, and e‑commerce.

GA4 analytics template focused on web and e‑commerce performance across Google products. Monitor sessions, engaged sessions, engagement rate, average session duration, revenue per session, and sessions per user. Explore trends over time and drill into traffic sources, campaigns, countries, device categories, screen resolutions, and landing pages. Connect acquisition with events, conversions, and e‑commerce outcomes to spot what drives growth. Ideal for tying insights from GA4 with Search Console and Google Ads to guide budget and content decisions.
Free
E-commerce report template cover image
E-commerce report template

Looker Studio template for Shopify, GA4, Facebook Ads, and Google Ads that tracks sales, conversions, and marketing performance by product, customer, and channel.

E‑commerce performance template by Porter for Looker Studio that brings together Shopify, GA4, Facebook Ads, and Google Ads to monitor the full revenue picture. Tracks gross sales, costs, and net sales alongside conversion rate, average order value, and bounce rate. Breaks results down by time, product, customer, and source to pinpoint profitable items and high‑value segments. Includes focused views for retention, funnels, KPIs, and SEO to assess marketing effectiveness across the journey. Helps teams spot behavior patterns and act quickly to increase ROI and growth.
Free
Paid Ads Organic Report - Google Ads cover image
Paid Ads Organic Report - Google Ads

Organic–paid search overlap insights to reduce ad waste, improve CTR, and prioritize high‑value queries.

Organic and paid search alignment focused on cutting wasted spend and boosting efficiency. Surfaces overlap between ads and organic rankings, including how CTR changes when both appear versus ad‑only. Pinpoints queries where the site already ranks top 3 organically so ad budgets can be reduced, with estimated savings. Highlights high‑CPC terms to trim or refine, plus guidance for brand and non‑brand queries with clear, actionable recommendations.
Free
PPC multi-channel dashboard cover image
PPC multi-channel dashboard

Cross‑channel PPC dashboard that consolidates ad metrics and spend to compare performance and guide budget decisions.

A multi‑channel PPC dashboard focused on consolidating ads data from Google Ads, Meta, LinkedIn, and other platforms to compare performance side by side. Tracks spend, impressions, clicks, CTR, CPC, conversions, and ROAS with time trends and breakdowns by source and campaign type. Highlights spend and CPC by date and source, impressions vs. clicks over time, and clicks by source to quickly spot winners and waste. Surfaces opportunities by evaluating keyword and creative effectiveness alongside metrics like search impression share and frequency. Guides smarter budget allocation and optimizations that lift ROI across platforms.
Free
Social Organic Monthly Report short version 7 pages Metricool cover image
Social Organic Monthly Report short version 7 pages Metricool

7-page Metricool-powered Looker Studio template for monthly organic performance across Instagram, TikTok, Facebook, X, and LinkedIn with trends and top content.

A 7-page Looker Studio template built for monthly organic social media reporting using the Metricool connector. It tracks Instagram, TikTok, Facebook, X, and LinkedIn, consolidating core KPIs—followers, reach, impressions, interactions, and engagement—with month-over-month and year-over-year comparisons. See follower evolution for the last month and 12 months, daily performance, and the month’s top posts or videos with direct links. A concise summary page helps document conclusions and deliver client-ready insights fast. Available in English and Spanish, and includes a connection tutorial plus a 30‑day Metricool trial code.
$116.28
Ad pacing and budget tracking report template cover image
Ad pacing and budget tracking report template

Goal-based Facebook Ads template to track budget, leads, traffic, messages, app installs, and conversions with monthly trends.

Facebook Ads campaign analysis template focused on budget tracking and performance across the funnel. Compare current results to goals and monitor monthly trends to catch pacing gaps early. Covers key outcomes including leads, website traffic, messages, app downloads, and conversions to see what’s moving the needle. Align spend with targets, evaluate ROI by objective, and prioritize the campaigns that deliver. Built for marketers who want a clear, goal‑based view of Facebook Ads performance.
Free
Xero Accounts Payable dashboard cover image
Xero Accounts Payable dashboard

Accounts Payable dashboard for QuickBooks and Xero that tracks amounts due, aging, top vendors, paid bills, and bank balances to prioritize payments and manage cash.

Accounts Payable dashboard template for Looker Studio powered by Coupler.io centralizes billing and vendor data from QuickBooks and Xero. Track total amount due, overdue balances (30+ and 90+ days), and AP aging to gauge risk and payment timing. See unpaid bills by vendor, identify top creditors, and dive into detailed bill tables with due dates, currencies, and amounts. Review paid bills by vendor alongside bank balances, opening/closing balances, and cash received/spent to plan payouts. Prioritize payments, prevent delinquencies, and align cash on hand with upcoming obligations.
Free
Woocommerce Looker Studio Template cover image
Woocommerce Looker Studio Template

Actionable WooCommerce analytics covering sales, products, customers, geographies, payment methods, and time trends to grow revenue.

WooCommerce performance tracking focused on sales, orders, refunds, and average order value, with clear trends across the last 12 months. Pinpoint top products and categories, see which countries, states, and cities drive revenue, and compare payment methods like cards vs PayPal. Evaluate the impact of coupons and discounts and identify peak buying days and hours to optimize campaigns and inventory. Explore customer behavior and top customers to raise repeat purchases and AOV. Connect via WooCommerce REST API for instant reporting and brand it with your own colors and logo.
€149
Woocommerce Template Complete 5 pages cover image
Woocommerce Template Complete 5 pages

5-page WooCommerce analytics template for Looker Studio with 12‑month trends, MoM/YoY KPIs, and deep dives into orders, products, and countries.

5-page Looker Studio template for WooCommerce that tracks sales, orders, products, customers, and average order value with MoM and YoY comparisons. Visualize 12‑month trends with baseline averages, seasonal year-over-year patterns, and yield by month to understand growth and seasonality. Dig into orders with daily breakdowns, status-level tables, and the busiest days of the week to optimize operations. Compare product performance month-over-month and year-over-year, highlight best sellers, and monitor contribution over the last 12 months. Evaluate markets with country-level trends, top 5 countries by net sales, and the top product per country using a free WooCommerce connector and included tutorial.
$90.85
Organic TikTok 4 pages top menu Metricool cover image
Organic TikTok 4 pages top menu Metricool

TikTok organic analytics for Metricool data with trends, video performance, and audience demographics.

A focused Looker Studio template for tracking organic TikTok performance with the Metricool connector across four pages. See month-over-month and year-over-year comparisons for followers, reach, views, videos, and interactions, plus 12‑month trends and top videos. Explore profile growth with daily engagement, views, profile views, reach, and interactions alongside posting activity. Analyze video results with per‑day metrics, impression sources, average watch time, and a detailed table (views, likes, comments, shares, reach, duration, engagement). Understand your audience with gender and country breakdowns to guide content and market decisions.
$57.96
Free Stripe Analytics Dashboard Template on Looker Studio cover image
Free Stripe Analytics Dashboard Template on Looker Studio

Looker Studio template for analyzing Stripe revenue, refunds, customers, transactions, and subscriptions in one clear view.

Stripe Analytics Dashboard for Looker Studio unifies Stripe payment data to track revenue, refunds, transaction volume, customers, and subscription health. Monitor available vs. pending payouts, product performance, and refund trends to quickly spot bottlenecks and risk. Compare payment methods and transaction statuses to understand what drives purchases and where churn may occur. Pinpoint opportunities to improve cash flow, reduce failed or unpaid subscriptions, and grow recurring revenue.
Free
Shopify store traffic overview dashboard cover image
Shopify store traffic overview dashboard

Shopify + GA4 funnel tracker covering traffic, conversions, customers, orders, and revenue trends.

Ecommerce performance template for Shopify that connects store sales with GA4 traffic to map the full funnel from sessions and views to add‑to‑carts, checkouts, and purchases. Highlights key KPIs like orders, total sales, average order value, and average items per order alongside total and new users. A monthly funnel table and trend charts reveal sales growth, customer acquisition, and conversion bottlenecks. Ideal for spotting what drives revenue and where shoppers drop off.
Free
Shopify report template cover image
Shopify report template

Shopify analytics template for Looker Studio to track sales, customers, products, and marketing performance in one place.

Track end-to-end Shopify performance in Looker Studio with KPIs like orders, net and gross sales, returns, and average order value. Understand customer behavior with metrics for new vs repeat buyers, lifetime value, conversion rate, cart abandonment, and refunds. Evaluate marketing efficiency using traffic source, ad spend, ROAS, and customer acquisition cost. Compare product performance and inventory to highlight best sellers and revenue drivers. Use these insights to optimize campaigns, merchandising, and profitability.
Free
Free Salesforce Sales Funnel Dashboard Template for Looker Studio cover image
Free Salesforce Sales Funnel Dashboard Template for Looker Studio

Salesforce sales funnel and revenue tracking in Looker Studio with lead sources, stages, conversions, and channel performance.

Salesforce Sales Funnel dashboard for Looker Studio focused on tracking pipeline health from lead sources to closed outcomes. Visualizes funnel drop‑offs, lead status, and opportunity stages alongside revenue and opportunity trends over time. Breaks down performance by source (e.g., email, partner, referral, web, social) to reveal channels driving qualified leads and won deals. Highlights counts, conversion movement, and value to help prioritize outreach, fix bottlenecks, and forecast. Ideal for sales and marketing teams aligning on where to invest to accelerate conversions.
Free
Salesforce sales team performance dashboard cover image
Salesforce sales team performance dashboard

Salesforce sales performance template tracking win/loss, revenue, rep comparisons, and task efficiency.

Looker Studio template for analyzing Salesforce pipeline outcomes and team productivity. Visualizes won and lost opportunities, won/lost amounts, win rate, and reasons for lost deals by rep, opportunity type, size, and lead source. Highlights totals and trends to benchmark performance and spot revenue swings. Adds task analytics—open/closed tasks and median task age—to monitor throughput and remove bottlenecks. Ideal for sales leaders to prioritize coaching, refine tactics, and forecast more accurately.
Free
Quickbooks financial dashboard cover image
Quickbooks financial dashboard

QuickBooks finance dashboard covering P&L, balance sheet, cash flow, and bank balances with last‑month and MTD insights.

QuickBooks financial dashboard focused on profitability, liquidity, and overall financial health. Tracks profit and loss with last month and month‑to‑date earnings, plus charts for cash end‑of‑period and net cash changes. Summarizes the balance sheet across assets, liabilities, and equity with last‑month and MTD comparisons. Lists bank and cash accounts with totals and breaks balances down by currency. Built for quick visibility into performance and cash runway for finance teams and founders.
Free
Free Pinterest Ads Dashboard Template on Looker Studio cover image
Free Pinterest Ads Dashboard Template on Looker Studio

Pinterest Ads performance dashboard tracking spend, conversions, ROAS, and audience insights to optimize results.

Pinterest Ads analytics template focused on campaign performance and spend efficiency. Track impressions, clicks, conversions, CTR, CPC, CPA, ROAS, and revenue impact with clear gauges, tables, and time‑series trends. Analyze funnel outcomes like add‑to‑cart, checkout, and conversion values to tie sales to ad spend. Explore audience mix by gender and age, plus geographic distribution. Use the insights to reallocate budget, refine targeting, and lift ROAS.
Free
Mailchimp email campaign performance dashboard for Shopify store cover image
Mailchimp email campaign performance dashboard for Shopify store

Unified Mailchimp-to-Shopify funnel tracking with product and revenue insights.

Tracks the full marketing-to-revenue funnel by combining Mailchimp engagement with Shopify sales outcomes. Visualizes key steps from sends, opens, and clicks through to orders and revenue over the last 12 months. Surfaces top-selling items and product mix to reveal winners and gaps. Monitors clicks, total sales, orders, and average order value to quantify campaign ROI and product performance.
Free