Looker Studio Report Gallery

The best free & paid Looker Studio templates, curated and quality-ranked for data reporting.

Showing 401 - 440 of 552

Let s Make GA4 Simple Report cover image
Let s Make GA4 Simple Report

A simple GA4 overview for monitoring users, conversions, events, top pages, and traffic by channel.

Track core GA4 KPIs—total users, new users, conversions, events, and page views—in one consolidated view. Compare performance over time with trend indicators and time-series. Identify the most popular pages and the key events driving engagement. Understand traffic mix by channel and month to see where users come from and how behavior changes. Ideal for quick health checks and lightweight performance reviews.
Free
Google Ads Ecom Performance Dashboard cover image
Google Ads Ecom Performance Dashboard

Google Ads e‑commerce and lead‑gen performance tracking with clear KPIs across campaigns and products.

Monitor Google Ads e‑commerce performance in one place, focusing on sales, conversions, spend, and ROAS across campaigns. Compare outcomes by product and campaign to spot winners, wasted spend, and scaling opportunities. Identify top products, campaigns, and time periods driving revenue and efficiency. Also supports a lead-based (non‑ecom) view for teams optimizing toward leads instead of purchases.
Free
Google Ads - Ad Group Performance cover image
Google Ads - Ad Group Performance

Google Ads ad group performance tracking with top‑performer rankings and period‑over‑period comparisons for smarter bidding and budgets.

Google Ads Ad Group Performance template focused on evaluating ad group efficiency and the impact of spend. Highlights the top ad groups by conversions, cost per conversion, total cost, and average CPC. Adds account-level summaries and period‑over‑period comparisons to reveal trends and shifts. Useful for spotting winners, flagging wasted spend, and guiding bid and budget reallocations.
Free
Instagram Ads Overview Report cover image
Instagram Ads Overview Report

Instagram Ads KPIs, engagement, and audience breakdowns in Looker Studio to pinpoint what drives results.

Instagram Ads Overview Report for Looker Studio that tracks campaign performance and audience engagement in one view. Monitor reach, impressions, cost per action, link clicks, leads, and actions by campaign, with scorecards for post engagements, reactions, and comments. Compare audience response using a clicks-by-gender chart and country-level impression tables to spot high-performing segments. Trend line charts highlight profile momentum, while a date selector helps focus on the periods that matter.
Free
Template Meta Ads - Platform Performance cover image
Template Meta Ads - Platform Performance

Compare Facebook and Instagram ad performance with platform KPIs, trends, and campaign-level insights for Meta Ads.

Meta Ads – Platform Performance focuses on comparing advertising results across Facebook and Instagram. It highlights key KPIs like impressions, reach, clicks, CPC, CPM, CTR, spend, revenue, purchases, and ROAS at the platform level. A global stats section surfaces top metrics at a glance, while charts track performance trends over time and by platform. Campaign-level views for Facebook help pinpoint what’s working and where to optimize budget. Ideal for quickly spotting efficiency shifts and scaling winning placements across Meta.
Free
Apple Search Ads overview report cover image
Apple Search Ads overview report

Apple Search Ads KPIs with campaign and country breakdowns to optimize spend and CPA.

Apple Search Ads performance overview focused on spend, impressions, taps, and results. Highlights top campaigns using total budget, cost, and cost per acquisition to pinpoint winners and waste. Includes a country breakdown by impressions to reveal markets driving scale. Built for marketers managing iOS user acquisition and budget optimization.
Free
Apple App Store Overview report cover image
Apple App Store Overview report

Apple App Store sales and proceeds overview with country, currency, device, SKU, and pricing breakdowns.

Apple App Store analytics focused on sales, pricing, and proceeds for app publishers. Track units, customer price, and developer proceeds with breakdowns by country, currency, device, product type, SKU, provider country, title, and version. Surface high‑value markets and currencies, compare performance across devices, and spot trends in units and pricing over time. Ideal for identifying which products, regions, and price points drive growth.
Free
Adobe Analytics website performance overview template cover image
Adobe Analytics website performance overview template

Adobe Analytics overview template for Looker Studio covering page views, visitor trends, revenue by product, and ecommerce funnels.

Adobe Analytics overview for Looker Studio by Supermetrics that unifies key web and ecommerce metrics in one place. Track page views by page name, visitor trends, revenue by product, and checkout/cart progression. Compare unique visitors by country and monitor KPIs across any date range. Built for marketing and ecommerce teams that want fast, actionable insights from Adobe Analytics inside Looker Studio.
Free
Free Google Keyword Rank Tracking Looker Studio Dashboard cover image
Free Google Keyword Rank Tracking Looker Studio Dashboard

Free Looker Studio template using Google Search Console to track keyword positions, clicks, impressions, CTR, and trends by query and location.

Google Keyword Rank Tracker for Looker Studio focused on Google Search Console data to monitor search visibility. Track keyword positions alongside clicks, impressions, and CTR by query, landing page, and location with time‑series trends. Spot ranking gains and drops to uncover content opportunities and measure the impact of SEO work. Real‑time updates via the Windsor.ai connector with a white‑label layout suitable for client reporting. Built for SEO and content teams that want fast insights to grow organic traffic.
Free
GSC SERP Visibility Summary Demo cover image
GSC SERP Visibility Summary Demo

Google Search Console-powered Looker Studio template to monitor impressions, clicks, CTR, average position, and query/page performance for stronger SERP visibility.

Google Search Console SERP Visibility template for Looker Studio that turns your GSC data into clear insights on search performance. Track impressions, clicks, CTR, and average position to measure visibility and engagement over time. Spot trends and ranking shifts quickly with an at‑a‑glance visibility breakdown and time series. Drill into queries and landing pages to find winning keywords, low‑CTR opportunities, and pages that need improvement. Prioritize actions that lift rankings and bring in more organic traffic.
$10
Youtube Insights - Channel and Audience Analysis cover image
Youtube Insights - Channel and Audience Analysis

YouTube channel and audience analysis in Looker Studio with growth, geography, demographics, devices, and engagement trends.

A YouTube Analytics template for Looker Studio focused on channel and audience analysis. Track channel health with subscribers, videos, total views, and subscriber gains/loss alongside timelines and previous-period comparisons. Compare average view rate, review daily performance in tables, and map where viewers come from. Break down audience demographics by age and gender and see device/OS usage to optimize content and distribution. Monitor engagement quality with trends for likes vs dislikes, shares, and comments.
Free
TikTok Organic overview dashboard cover image
TikTok Organic overview dashboard

TikTok organic performance overview with growth trends, audience demographics, and top videos.

TikTok Organic analytics focused on audience and content performance. Track views and follower growth over time, and break down followers by gender and country. Identify top videos by views and review the newest uploads to spot emerging winners. Built for marketers and creators who want quick insight into reach and audience development.
Free
Microsoft Ads Overall Report cover image
Microsoft Ads Overall Report

Comprehensive Microsoft/Bing Ads performance template covering KPIs, trends, and segment analysis to optimize spend and conversions.

Microsoft Ads Overall Report for Looker Studio tracks PPC performance across CTR, impressions, clicks, cost, and conversions. Trend charts highlight date-wise impressions, conversions, and the relationship between CTR and conversion rate to spot momentum and efficiency gaps. A campaign overview table plus views for ad groups, search queries, and gender demographics reveal where spend and results concentrate. Ideal for diagnosing performance drivers and prioritizing budget, bids, and creatives in Microsoft/Bing Ads.
Free
Template LinkedIn Ads - Leads Performance cover image
Template LinkedIn Ads - Leads Performance

LinkedIn Ads lead‑gen dashboard tracking leads, CPL, and campaign/creative performance for smarter budget and optimization decisions.

Track LinkedIn Ads lead generation with clear views of campaigns, ads, and creatives. Monitor key metrics like leads, spend, cost per lead, conversions, CTR, and conversion rate to quickly spot winners and wasted spend. Compare performance over time and by campaign to guide budget shifts and bidding decisions. Surface underperforming ads and identify best-performing audiences and formats to scale results. Built for marketers running LinkedIn lead gen who need fast, actionable insights.
Free
Blog report template cover image
Blog report template

GA4 Looker Studio template unifying acquisition, engagement, conversion, audience, ecommerce, and retention insights in one place.

GA4 performance template focused on the full marketing funnel for ecommerce and websites. Organizes insights into Conversion, Engagement, Acquisition, Audience (geo, demographics, tech), E‑commerce (GA4), and Retention to reveal what drives growth. Highlights trends across channels and audiences so you can spot opportunities, fix drop‑offs, and scale what works. Ideal for decision‑makers who want a single view of traffic quality, user behavior, and customer value.
Free
Google Analytics Audience Overview cover image
Google Analytics Audience Overview

Audience overview for Google Analytics with key metrics plus country, language, and device breakdowns.

Google Analytics Audience Overview focused on who visits your site and how they engage. Track core audience metrics and trends to understand growth and activity at a glance. Explore where visitors come from with country and language breakdowns. Identify the device mix to see whether traffic skews to mobile, desktop, or tablet. Use these insights to prioritize content, UX, and marketing for your most valuable audience segments.
Free
Facebook Ads Lead Generation cover image
Facebook Ads Lead Generation

Facebook Ads lead‑gen analytics focused on volume, cost efficiency, and top performers across ads, audiences, devices, and regions.

Measure Facebook lead generation in Looker Studio with KPIs for leads, conversions, purchases, cost per lead, cost per conversion, and cost per purchase. Review top ads and ad sets to find creative and messaging that drive the most leads at the lowest cost. Break down results by device, publisher, demographics, and region to pinpoint high‑quality audiences. Track spend vs. leads and monthly trends to understand efficiency and momentum. Use the insights to shift budget, refine targeting, and scale what works.
Free
Facebook Ads Budget Template cover image
Facebook Ads Budget Template

Budget-focused Looker Studio dashboard for tracking Facebook Ads spend, revenue, ROAS, and allocation by campaign, ad set, and objective.

A focused Facebook Ads budget dashboard that helps monitor spend against targets and protect ROI. Track spend, revenue, and ROAS over time, by day of the week, by campaign and ad set, and across objectives. The budget manager highlights overspend and underperforming segments so you can reallocate budget to what converts. Powered by Catchr’s Facebook Ads connector for real‑time KPIs in Looker Studio.
Free
Looker Studio YouTube Channel Dashboard Template cover image
Looker Studio YouTube Channel Dashboard Template

Track subscribers, views, watch time, and top videos for your YouTube channel in Looker Studio.

YouTube Channel Dashboard for Looker Studio to monitor subscriber growth, views, watch time, likes, and comments in one place. Highlights latest uploads and all‑time top videos so you can spot winners and underperformers fast. Includes dedicated pages for an overview, detailed video stats, and channel info to surface trends and retention insights. Ideal for creators and marketers who want to optimize content strategy and posting cadence using real performance data.
Free
Instagram Insights Monitoring Report cover image
Instagram Insights Monitoring Report

Instagram analytics in Looker Studio covering KPIs, trends, demographics, geo, and Story/post insights for actionable content decisions.

Track Instagram performance in Looker Studio across impressions, likes, followers, profile views, and content volume. See trends by date, media type, geography, and audience demographics to spot what’s growing and where to focus. Compare impressions vs. engagement and review post and Story insights like reach, replies, taps, and exits to refine creative. Monitor website clicks alongside profile activity to connect content to outcomes. Built for influencers, agencies, and brand teams who need fast, actionable Instagram analytics.
Free
Looker Studio HubSpot Dashboard Template cover image
Looker Studio HubSpot Dashboard Template

HubSpot CRM sales pipeline and account insights in Looker Studio, covering contacts, companies, industries, locations, and the conversion funnel.

HubSpot CRM performance consolidated in Looker Studio with focused views for Overview, Companies, Contacts, and Owners. Track the sales pipeline and conversion funnel, including counts of contacts, leads, opportunities, and customers. Surface top industries and locations of companies to target the right segments. Monitor recent activity and entity changes to spot momentum or bottlenecks. Ideal for sales and marketing teams seeking quick visibility into pipeline health and account coverage.
Free
Customer Retention Analysis cover image
Customer Retention Analysis

Customer retention dashboard with cohort analysis, LTV, repeat purchase timing, and yearly retention highlights.

Customer Retention Analysis focused on tracking how well customers return and stay active from 2022 to 2024. Highlights include a large cohort analysis to compare repeat behavior over time, plus KPIs for current‑year status. Measures average customer lifetime value and the average time to a repeat order to quantify revenue and loyalty. Surfaces yearly peaks in retention to learn what worked and replicate it. Built for teams that need a clear view of churn, loyalty, and growth opportunities.
Free
Google Ads Overview cover image
Google Ads Overview

Google Ads overview in Looker Studio with campaign/ad KPIs, trends, and device/country insights for quick optimization.

Google Ads Overview template for Looker Studio consolidates key PPC KPIs across accounts, campaigns, and ads. Side-by-side tables compare cost, impressions, clicks, CTR, CPC, conversions, and cost per conversion to spotlight winners and wasted spend. Trend charts track spend, clicks, conversions, and cost per conversion, plus a visual comparison of cost versus conversions. Device and country breakdowns via bar chart and Geo chart reveal where engagement comes from and what to scale back. Built to speed up budget reviews and optimize campaign and ad performance.
Free
Google Ads Opportunity Lost cover image
Google Ads Opportunity Lost

Google Ads opportunity-lost dashboard for budget and bid limits with impression share trends and campaign-level insights across Search and Display.

Google Ads template focused on measuring opportunity lost from budget and bid limits. Quantifies impression share and highlights where Search and Display are losing visibility due to constraints. Includes daily impression share trends and campaign-level views to pinpoint high-impact fixes. Helps prioritize budget shifts and bid adjustments to recover reach and demand.
Free
Google Ads Dashboard cover image
Google Ads Dashboard

Google Ads KPI dashboard for spend, clicks, CPC, conversions, and campaign performance.

Google Ads performance template focused on key PPC metrics: spend, impressions, clicks, CPC, conversions, and conversion rate. Visuals compare impressions vs clicks and clicks vs CPC to quickly gauge engagement and efficiency. Trend and breakdown charts show spend by date and by campaign type, plus conversions by campaign type. Includes top campaigns by conversions and an all‑conversions breakdown to identify winners and wasted spend. Built to support budget allocation and optimization decisions across campaigns.
Free
Facebook Ads Messenger report template cover image
Facebook Ads Messenger report template

Facebook Insights Looker Studio template covering overview, audience, engagement, reactions, video, and Messenger performance.

Facebook Insights dashboard template for Looker Studio focused on social media performance tracking. Combines native Facebook metrics to monitor reach, impressions, engagement, reactions, and content performance across posts and videos. Includes dedicated pages for Overview, Audience, Content Performance/Engagement, Reactions, Video Performance, and Messenger Insights. Surfaces trends, top posts and formats, audience makeup, and messaging activity to spot growth opportunities and refine publishing strategy. Built for the Porter Metrics Facebook Insights connector to enable deeper metric combinations.
Free
Meta Ads cover image
Meta Ads

Looker Studio template to analyze Facebook and Instagram ad spend, performance, and conversions across campaigns.

Meta Ads template for Looker Studio that tracks Facebook and Instagram campaign performance in one place. Monitor spend, impressions, clicks, and key KPIs across acquisition, engagement, and conversion. Explore audience, campaign, and funnel views to spot what’s working and where to optimize. Built to pull real-time data via Catchr so your insights stay up to date. Ideal for marketers who need a clear, fast read on Meta ad performance.
Free
Results Ads Reports cover image
Results Ads Reports

Unified ads results across Google, Facebook, LinkedIn, and Microsoft Ads with investment, revenue, and key KPIs.

Multi-channel ads reporting for Google Ads, Facebook Ads, LinkedIn Ads, and Microsoft Ads, organized with dedicated pages per network. Track investment, revenue, and essential KPIs in one place to compare performance and spot what’s working. Built to plug into Catchr’s no‑code connectors for real-time data and seamless setup. Useful for marketers who need a quick, consolidated read on paid media results.
Free
Campaign Performance Dashboard - Facebook Ads cover image
Campaign Performance Dashboard - Facebook Ads

Facebook Ads campaign performance with trends, CPC/CPM, CTR, frequency, and campaign-level comparisons to optimize spend and results.

Facebook Ads campaign performance at a glance for clearer budget and ROI decisions. Monitor core KPIs like Impressions, Reach, Clicks, Link Clicks, CTR, CPC, CPM, and Frequency to understand cost and engagement. Trend charts highlight how impressions and clicks move over time so you can catch momentum or drops fast. A campaign comparison table surfaces spend, reach, and efficiency by campaign to spot winners and underperformers. Ideal for optimizing budgets, refining targeting, and reporting results to stakeholders.
Free
Template Meta Ads - Overview V2 cover image
Template Meta Ads - Overview V2

Meta Ads overview focusing on spend, reach, clicks, adds to cart, purchases, CPA, and ROAS across campaigns and ad sets.

Meta (Facebook) Ads performance overview tailored for Looker Studio. Tracks the full funnel with spend, impressions, reach, CPM, link clicks and CPLC, adds to cart and CPATC, purchases, purchase value, CPA, and ROAS. Includes trend charts that compare current results with the prior period to spot shifts in cost and efficiency. Campaign and ad set tables highlight top and underperforming segments for quick budget and creative decisions. Ideal for e‑commerce teams monitoring outcomes from awareness to purchase.
Free
Facebook Ads - Multi ad accounts report cover image
Facebook Ads - Multi ad accounts report

Unified Looker Studio dashboard for multiple Facebook Ads accounts with aggregated metrics and account-level drilldowns.

A unified Facebook Ads reporting template that aggregates performance across multiple ad accounts in Looker Studio. Compare accounts side by side or drill into a single account while tracking essential ad KPIs to evaluate spend efficiency and results. Ideal for freelancers, agencies, and multi-country teams needing a consolidated view of overall performance. Connect via Catchr to stream real-time Facebook Ads data and keep metrics consistently up to date.
Free
Template ActiveCampaign cover image
Template ActiveCampaign

ActiveCampaign campaign overview in Looker Studio for real‑time email KPIs and comparisons.

Track ActiveCampaign campaign performance in Looker Studio with a focused overview of your email KPIs. Pulls metrics and dimensions directly from ActiveCampaign via Catchr for real‑time visibility into sends, opens, clicks, and engagement by campaign. Compare campaigns, spot trends, and surface winners to optimize content and timing. Built for marketers who need quick, shareable insights and clean visuals. Free template that works with Catchr’s ActiveCampaign connector.
Free
GEO AI Mode AI Overviews Dashboard for Search Console cover image
GEO AI Mode AI Overviews Dashboard for Search Console

Monitor clicks, impressions, position, and trends for AI Overviews‑like queries from Google Search Console.

Tracks Google Search Console performance for AI Overviews‑like queries. Surfaces clicks, impressions, and average position with a clean summary and a query table for granular analysis. Highlights daily trends so you can spot changes in visibility and traffic tied to these query types. Useful for SEOs assessing the impact of Google’s AI Overviews on branded and non‑branded keywords.
Free
TikTok Ads Performance cover image
TikTok Ads Performance

Track TikTok Ads KPIs with overview, campaign/ad performance, spend analysis, and demographic insights in Looker Studio.

TikTok Ads Performance focuses on tracking the essential KPIs for your TikTok advertising, with clear views for overview, campaign and ad performance, and demographics. It highlights spend trends over time, spend by advertising objective, and top campaigns to spot what’s working and where to reallocate budget. Built for Looker Studio with Catchr’s no‑code connector, it brings all your TikTok Ads metrics and dimensions into one place with real‑time updates. Ideal for quickly assessing performance and guiding creative, targeting, and budget decisions.
Free
Google Ads Visibility Overview cover image
Google Ads Visibility Overview

Track Google Ads visibility and impression share trends by device, region, date, and campaign.

Google Ads visibility at a glance with impressions, viewable impressions, call impressions, search/content impression share, and absolute top/top impression percentage. Time-performance visuals highlight trends so you can catch dips in impression share early. Breakdowns by date, device, and region map uncover where visibility is strongest or needs attention. Campaign-level comparisons help prioritize budgets and bidding to win more eligible impressions.
Free
Amazon Seller Central Dashboard cover image
Amazon Seller Central Dashboard

All-in-one Looker Studio dashboard for Amazon sellers to track sales, orders, and inventory with detailed damaged-quantity insights.

Amazon Seller Central dashboard for Looker Studio that centralizes sales, orders, and inventory performance for Amazon sellers. Surface quick insights on total sales and order health while tracking latest orders with fields like order status, channel, Prime and replacement indicators. Monitor inventory status alongside a detailed damaged-quantity breakdown by carrier, customer, distributor, and warehouse, mapped to ASIN and product names. Built to highlight operational issues and stock risks so you can react faster. Can be white‑labeled with your brand logo.
Free
Stripe cover image
Stripe

Looker Studio dashboard for Stripe to monitor balance, customers, subscriptions, payments, and invoices in real time.

Stripe analytics for Looker Studio focused on cash flow and subscription performance. Track current balance, new customers, new subscribers, failed/default payments, and invoices at a glance. Connects directly to Stripe for real-time data with access to all metrics and dimensions. Ideal for monitoring revenue health and spotting payment issues quickly. Built by Catchr and ready to share with your team.
Free
Snapchat Ads Overview Report cover image
Snapchat Ads Overview Report

Single-page Snapchat Ads overview with trends, audience breakdowns, and campaign performance for quick optimization.

Single-page Snapchat Ads analytics focused on the essentials: impressions, clicks, video views, swipes, camera saves, spend, and period-over-period change. Daily trend charts highlight how engagement and reach evolve over time. Audience insights break down impressions by country and gender for quick targeting takeaways. A campaign performance section helps pinpoint top performers and areas to cut waste. Ideal for monitoring results and steering budget and creative decisions fast.
Free
Shopify E-Commerce Report cover image
Shopify E-Commerce Report

Single-page Shopify Looker Studio dashboard for sales, orders, AOV, discounts/refunds, top products, and inventory insights.

Single-page Shopify analytics in Looker Studio that brings sales, transactions, and product performance into one view. Track total and net sales, customer order count, average order value, discounts, refunds, and top orders/products alongside inventory insights. Compare revenue and order trends over time and see which items drive the most sales and margin. Use it to spot growth opportunities, control costs, and keep stock levels aligned with demand.
Free
Bing Ads Looker Studio Template cover image
Bing Ads Looker Studio Template

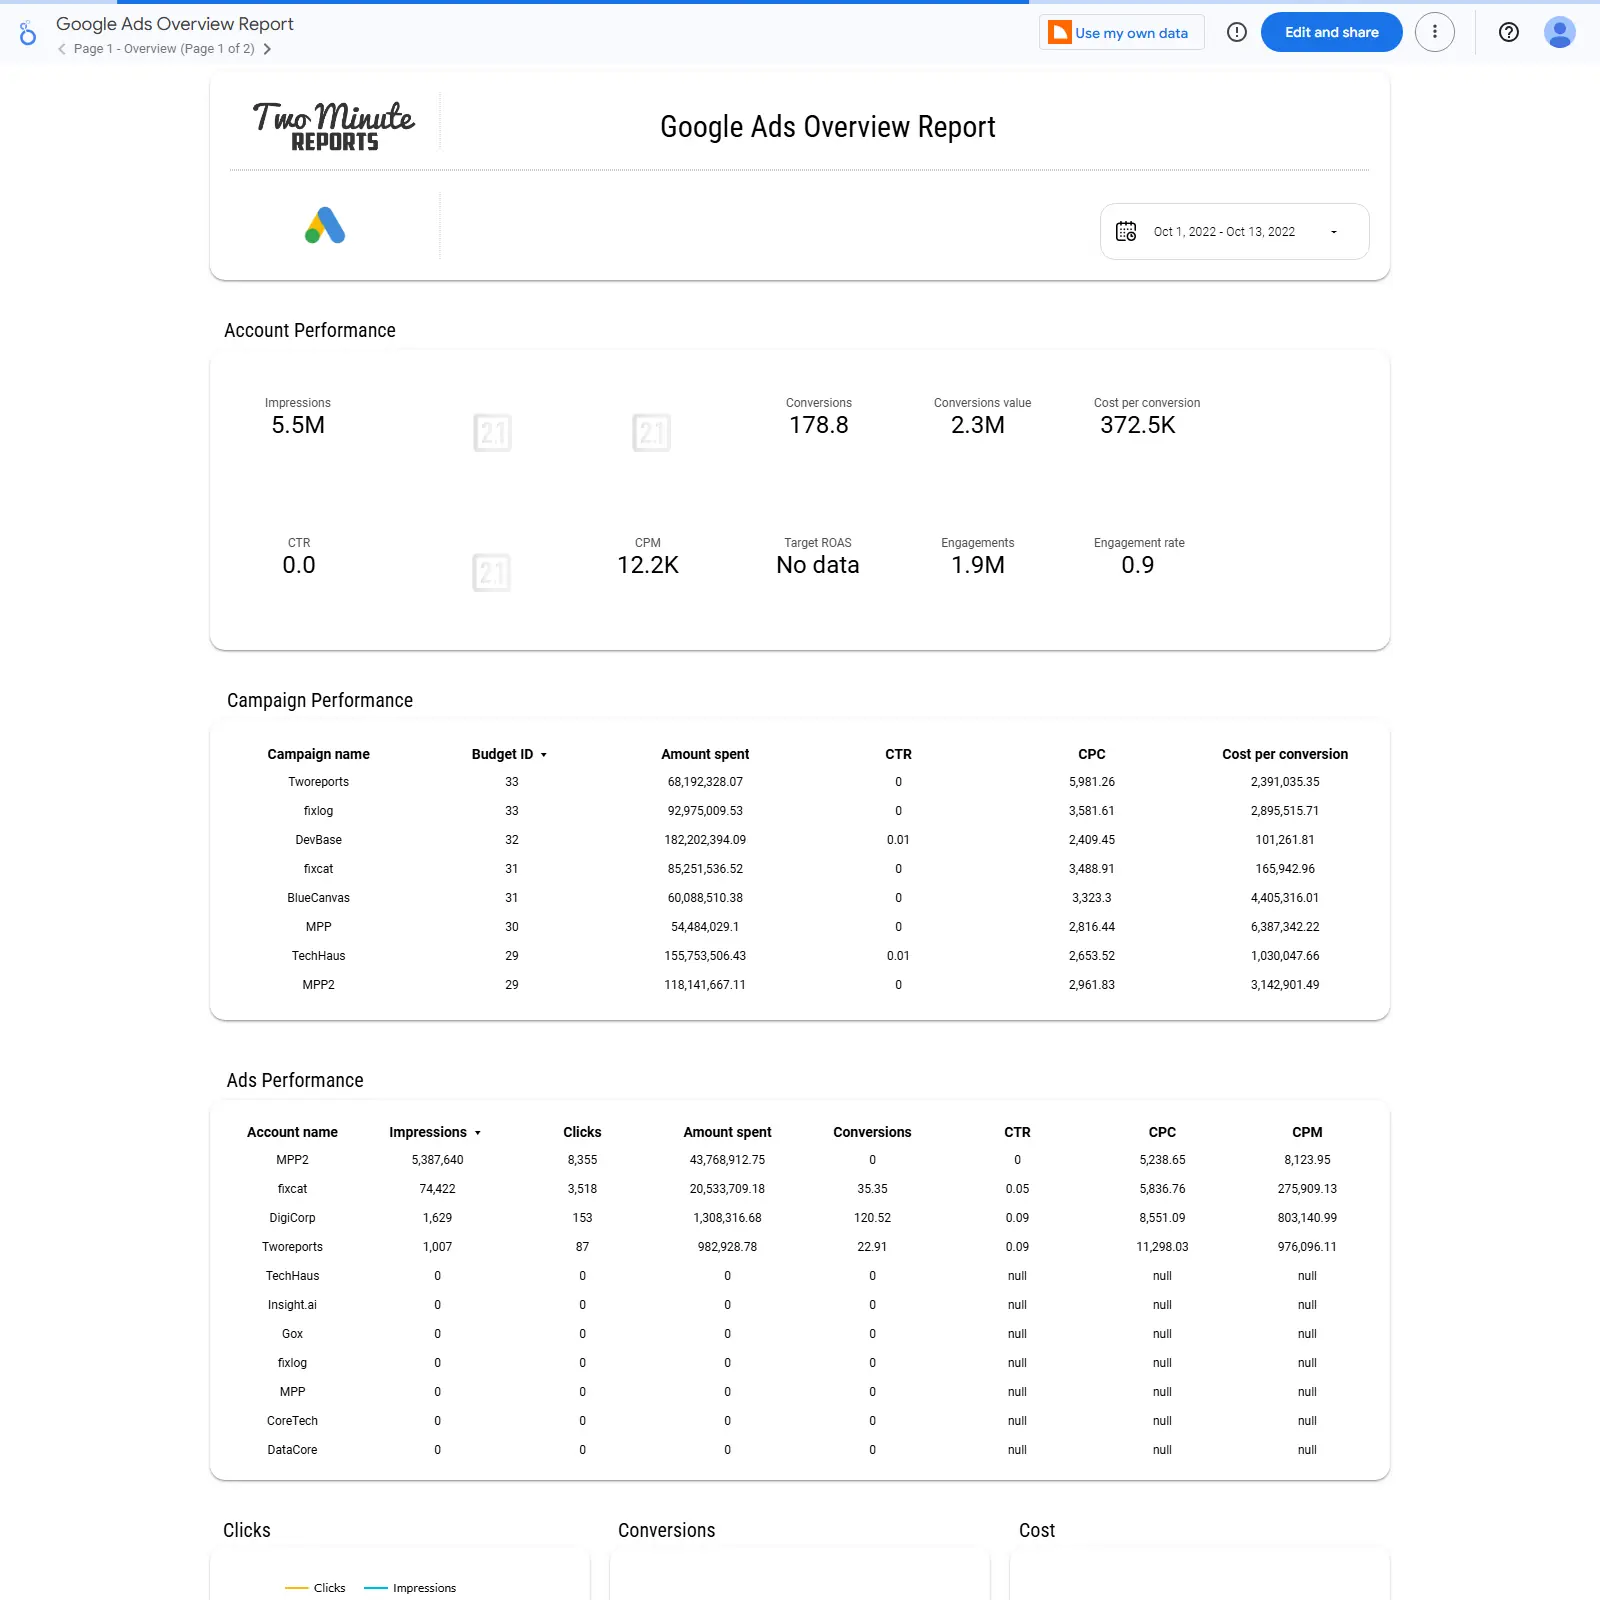
Microsoft/Bing Ads reporting template in Looker Studio to track performance, find winning keywords and audiences, and improve ROI.

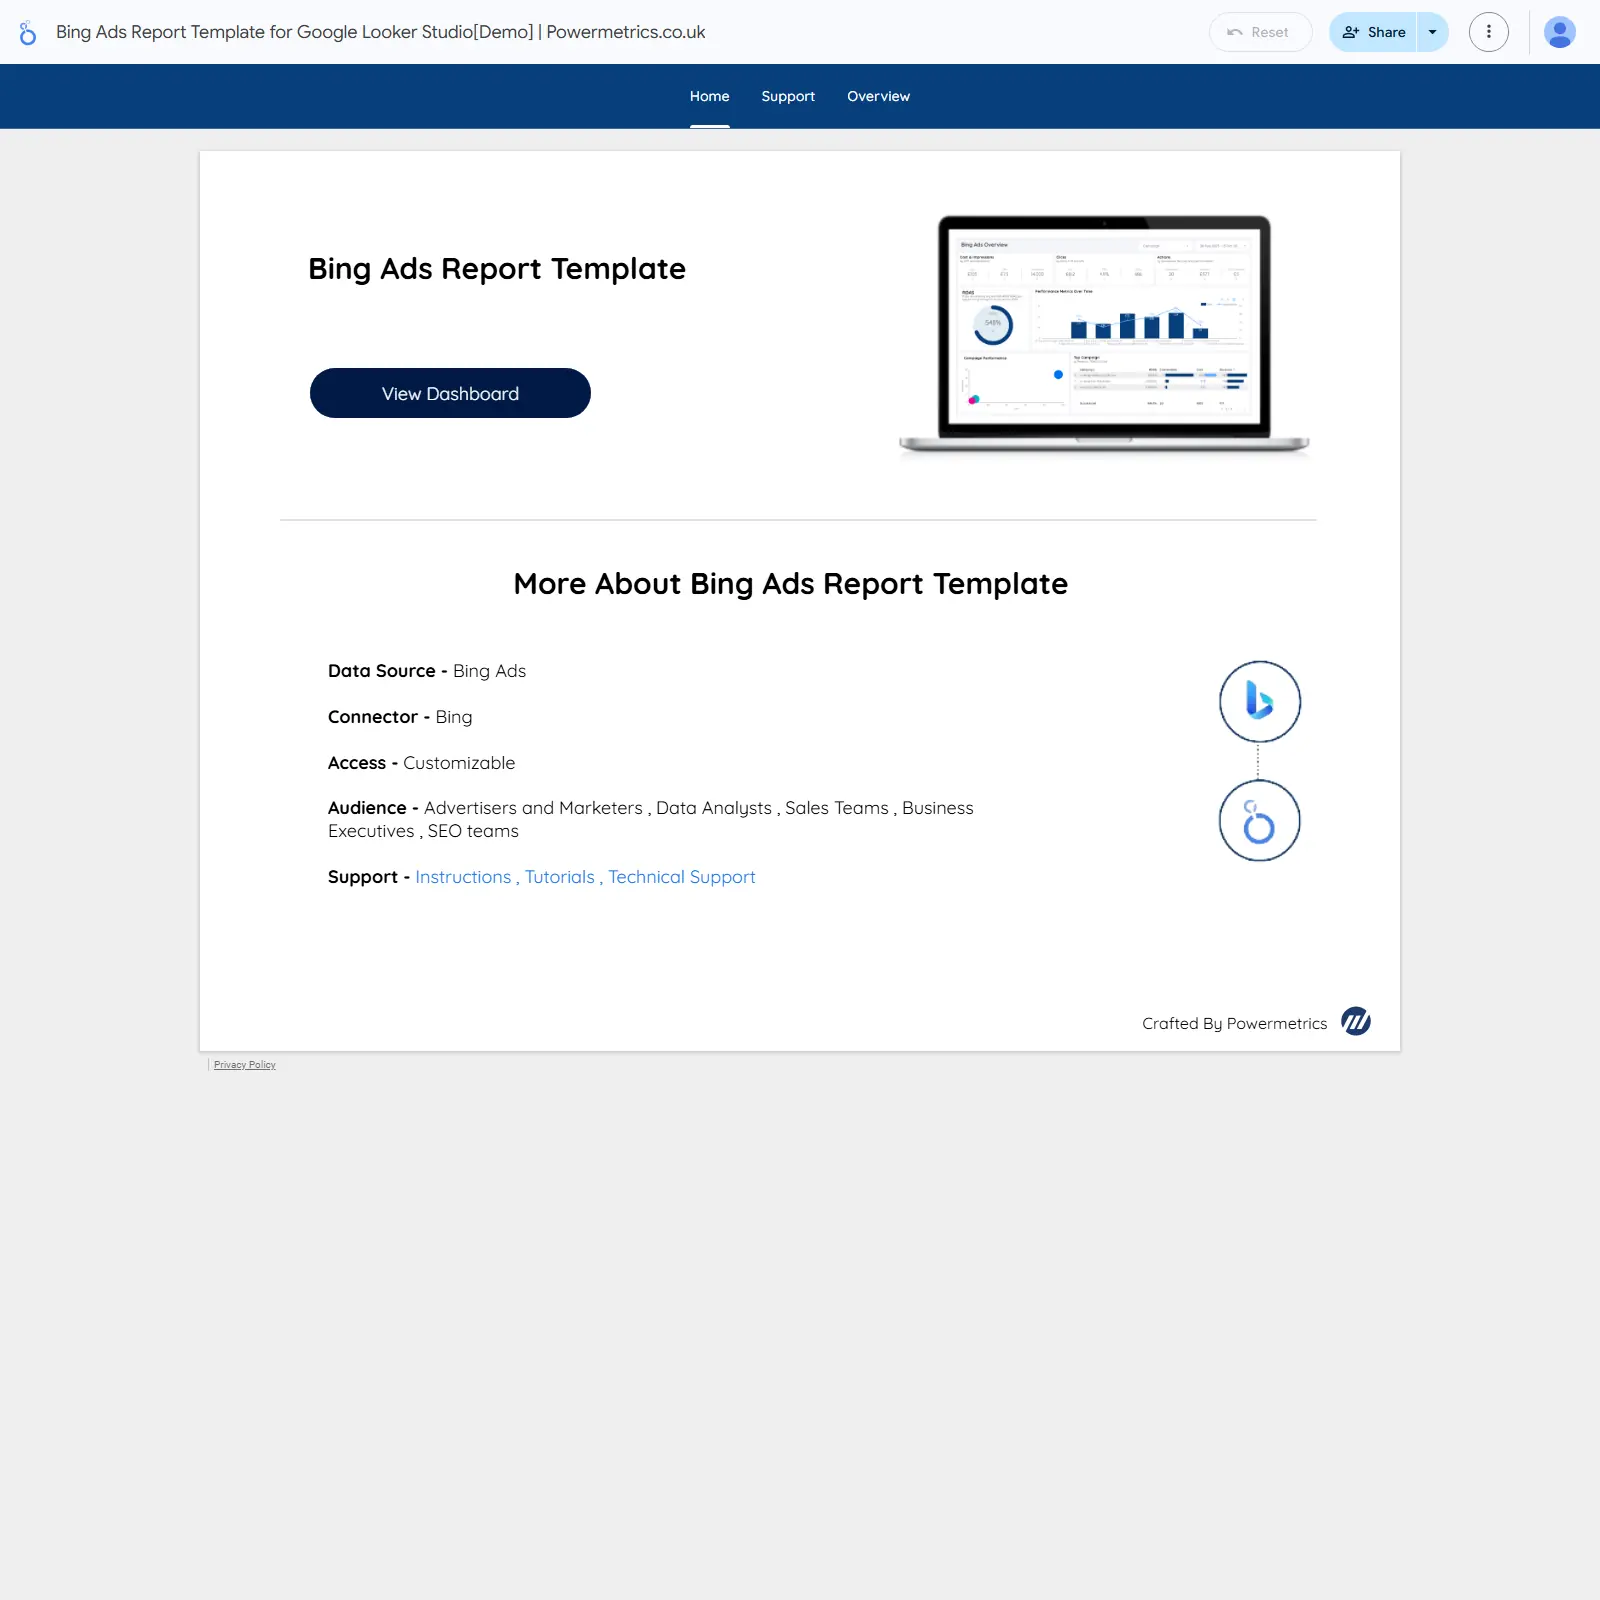
Bing Ads Looker Studio Template for Microsoft Ads performance tracking and optimization. Monitor core PPC metrics like clicks, impressions, CTR, CPC, cost, conversions, CPA, ROAS, quality score, and ad position, plus keyword, device, search query, geographic, and time-of-day insights. Compare campaigns and networks to spot winners, control spend, and lift ROI with clear visuals. Built for marketers, analysts, sales and SEO teams, with integration guidance and technical support available. Ideal for turning Bing Ads data into fast, actionable decisions.
£89